
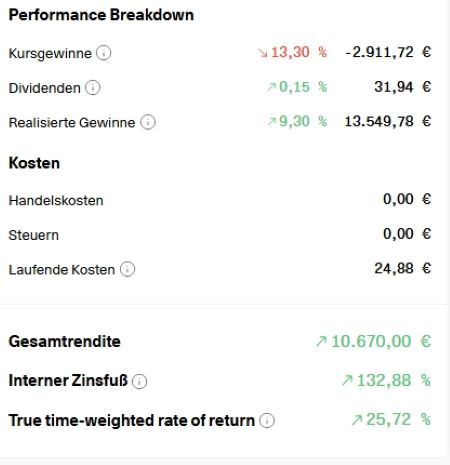
$EKT (-1,1%) Unfortunately, it was a complete letdown. So I’ve now decided to part ways with it. Having one fewer stock in my portfolio also makes it easier for me to keep track of things. And I really won’t shed a single tear over this one. The loss is manageable, and the capital gains tax refund helped seal the deal.
Energiekontor
Ação
Ação
ISIN: DE0005313506
Ticker: EKT
DE0005313506
EKT
Price
Discussão sobre EKT
Postos
42

2Mês·
News from Last Week
Monday:
Unsurprisingly, both June and July were the hottest months ever recorded in Europe. This is having an increasingly significant impact on the economy. Both shipping routes and electricity production are being restricted. Low water levels in the Rhine, Danube, and Po rivers, in particular, are causing problems. Wildfires are also affecting tourism.
Wednesday:
Unlike $MUV2 (-0,88%) Munich Re, $HNR1 (-0,99%) Hannover Re increased its profit to 1.4 billion euros in the first half of the year. Overall, prices in the reinsurance business fell by about 4%. Despite this, revenue still rose by 0.2%.
Germany has approved an early retirement pension for all children born in 2020 or later. Parents can either have the money deposited into an account they open themselves, or the Bundesbank will invest it directly in the stock market on the children’s behalf. Parents and grandparents can contribute additional funds to the 10 euros per month.
https://www.tagesschau.de/inland/innenpolitik/kabinettsbeschluss-fruehstartrente-100.html
Thursday:
Record revenue for car rental company $SIX2 (+0,03%) Sixt in the first half of the year. Overall, revenue increased by 9% to 2.1 billion euros. Profit rose by more than 28% to 84.5 million euros.
Friday:
One day after the quarterly results and the confirmed forecast, $EKT (-1,1%) Energiekontor revised its forecast because wind farms in Scotland will be connected to the grid later than expected. This is, of course, a major misstep in capital market communication. The information from Scotland must have come in yesterday; otherwise, it’s also legally questionable.

www.handelsblatt.comKlima: Juni und Juli waren in Westeuropa so warm wie noch nie


4Mês·
Providing the momentum for new growth
Hello, everyone,
Energy and electricity will remain a major topic. When it comes to renewable energy, some investors are often a bit skeptical. But even this form of energy is gaining more and more acceptance.
That’s why I’d like to introduce you to a company in this sector today.
Since I know that our dear @Dividendenopi has been deeply involved with this topic. After all, he was invested in $EKT (-1,1%) invested for a long time. Naturally, I’m particularly interested in his opinion.
But of course, I’m just as interested in your opinions.
SOLV began delivering some of the earliest large-scale solar power plants in the U.S. in 2008. As the projects grew, so did the company’s capabilities—from engineering, procurement, and construction to commissioning, operation, and maintenance. Today, they are a full-lifecycle provider capable of designing, building, operating, and optimizing complex facilities, including high-voltage substations, transmission interconnections, and end-to-end SCADA/network systems. SOLV is known for its leadership in utility-scale solar and battery storage, for bankable execution, and for long-term performance.
SOLV is a leading provider of infrastructure services for the energy sector, including engineering, procurement, construction, testing, commissioning, operation, maintenance, and retrofitting. Since its founding in 2008, the company has built more than 500 power plants with a generation capacity of 21 GWdc and currently provides O&M services under long-term contracts for 150 power plants with over 20 GWdc of generation capacity.
Demand for electricity is accelerating as data centers grow and U.S. manufacturing recovers. SOLV Energy delivers the large-scale solar and battery storage projects that power these industries on time and at scale. With proven expertise, extensive resources, and full lifecycle capabilities, they build power plants that deliver long-term performance and added value for customers and communities.
2,600 employees, including nearly 1,950 skilled tradespeople.
SOLV boasts:
- 500+ completed projects
- 20+ GW under management
- EPC + O&M customers in 48 U.S. states
- Backlog: $8.0 billion (EPC + O&M)
- 150+ active projects
046aaf8c-2921-4257-9c68-7ea176174113
The presentation explicitly states:
“Accelerating investment in data centers … is driving unprecedented load growth”
“The fastest-growing loads require carbon-free power”
This means:
✔ Data centers are a key driver of demand
- Hyperscalers (AWS, Google, Microsoft, Meta)
- AI data centers
- Colocation providers
These companies require enormous amounts of renewable energy, often through PPA structures.
✔ SOLV benefits directly from EPC projects
Data centers do not build solar plants themselves—they enter into PPAs with developers. These developers then contract EPC players like SOLV.
✔ SOLV clearly positions itself as a “data center enabler”
The presentation shows:
- 5× higher load growth driven by data centers
- Solar + BESS as the preferred solution for data centers
- SOLV as #2 EPC and #2 BESS contractor in the U.S.
→ This is a direct strategic focus on the data center boom.
🧠 3) Juan’s Conclusion (short & clear)
Juan says: SOLV doesn’t name any clients, but the pattern is clear: large utilities, IPPs, and infrastructure investors. The key point: Data centers are now one of the strongest drivers of demand, and SOLV, as an #2 EPC + #2 BESS contractor, is perfectly positioned to build precisely these projects.
In short: No names, but clearly data center exposure—and it’s growing.
May 4, 2026
SOLV Energy veröffentlicht die Finanzergebnisse des ersten Quartals 2026 am 12. Mai 2026
May 4, 2026
April 1, 2026
SAN DIEGO, February 12, 2026 (GLOBE NEWSWIRE) – SOLV Energy, Inc. (“SOLV” or the “Company”) (Nasdaq: MWH), a leading provider of infrastructure services to the energy industry, announced today the completion of its public offering of 23,575,000 shares of its Class A common stock, which also included
February 12, 2026
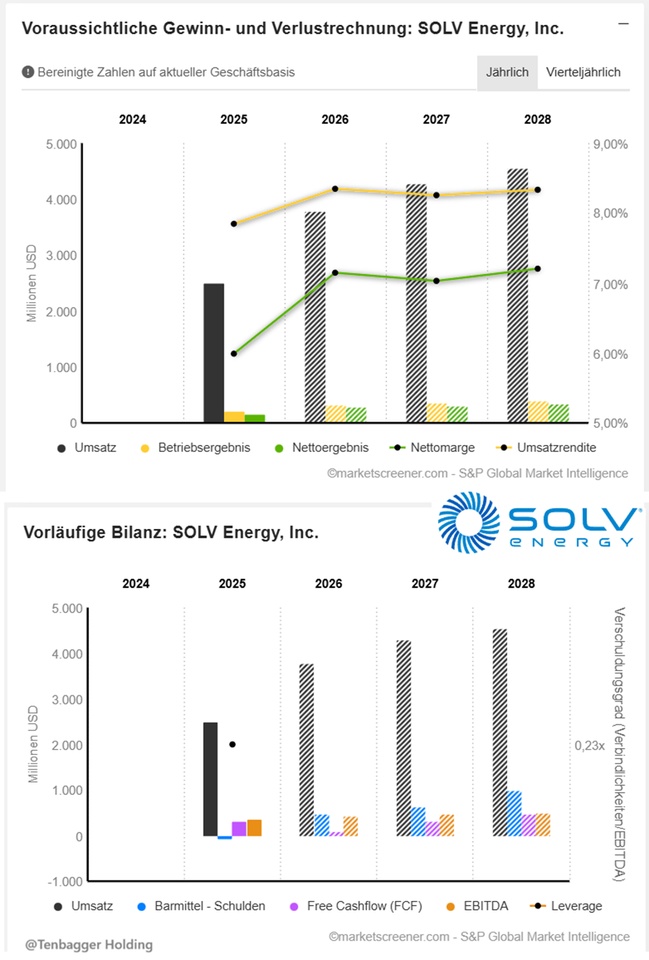
Juan’s Take on SOLV Energy’s Financial Metrics for 2025–2028
(short, concise, investor-focused)
Juan says: SOLV Energy delivers a strong growth profile, but with significant fluctuations in cash flow. Revenue and EBIT are rising steadily, while margins remain stable in the single-digit range. Free cash flow fluctuates sharply—first rising, then plummeting, then rebounding strongly—which is typical for project-heavy solar and EPC businesses.
The net debt turns deeply negative starting in 2026, which is a clear balance sheet advantage. EPS is growing at a solid double-digit rate, but overall profitability remains modest.
In short: Top-notch growth, strong balance sheet, volatile cash flow—a solar pure play with momentum but a cyclical pulse.
Market value 4,853
Number of shares (in thousands) 115,349
Juan’s Conclusion on the 2026–2028 Valuation Metrics
(short, precise, investor-focused)
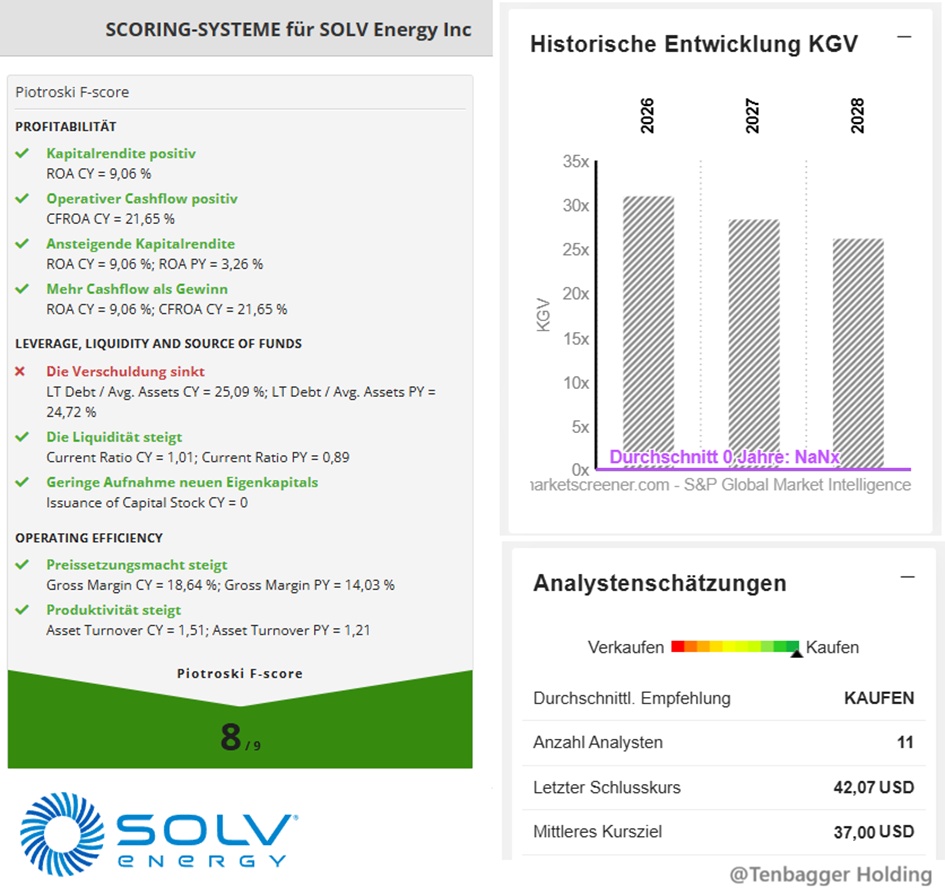
Juan says: SOLV Energy looks like a typical high-growth stock that is just beginning to see its valuation normalize. The P/E ratio is falling steadily from 31× to 26×, while the P/B ratio is falling from 7.8× to 5.2× —a clear indication that the market is increasingly pricing in the company’s growth.
The FCF yield rises sharply from 2% to nearly 12%, which makes the stock significantly more attractive from a fundamental perspective. The PEG above 3 shows, however, that while growth is strong, it is no longer “cheap.”
In short: Valuation is easing, cash flow attractiveness is rising, but the stock remains a growth play with premium potential.
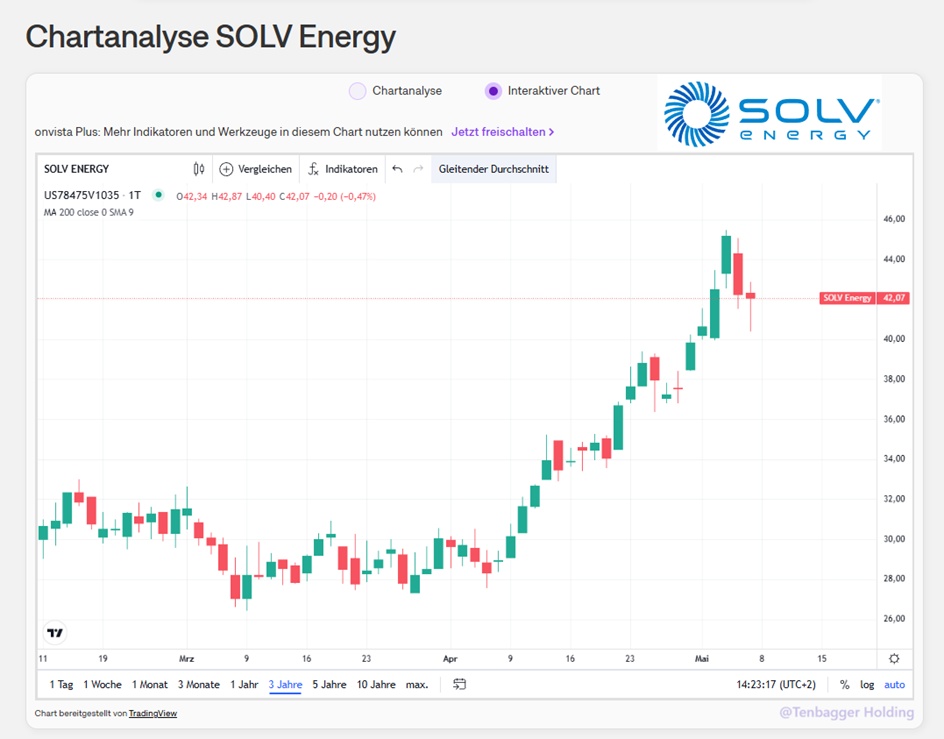
Performance
1 week +5.60%
1 month +48.55%
June 17, 2026, 10:00:00 PM •
Nasdaq (USD)
34.69 USD
June 18, 2026, 1:31:06 PM •
Société Générale (EUR)
29.80 EUR
$mwh
+ 3
2020
6 Comentários
Hey @Tenbagger2024,
You did reach out to the great @Dividendenopi, but I’m not going to pass up the chance to run this through my analysis machine right away!
First, the praise: You’ve got an absolute mega-trend on your hands. The narrative that “data centers and AI need massive amounts of green energy” is currently the hottest story on the market, and as an EPC and O&M service provider, SOLV Energy is exactly the shovel seller this gold rush needs. I also really like what I see on the balance sheet—the fact that net debt will turn negative starting in 2026 shows that the fundamentals are solid. This isn’t some zombie company, but a real business.
But now comes the brutal reality check from the perspective of my “dumbbell” strategy:
1. The Margin Trap (Core Quality Check)
You say it yourself: Margins remain stable in the single-digit range. EPC (Engineering, Procurement, Construction) is a cutthroat project-based business. You have massive revenue, but in the end, relatively little sticks. For my core quality formula (revenue growth + operating margin), this means: Even if revenue is skyrocketing, the weak margin drags the score down. I like margins of 15% and up—that’s where real money is made.
2. The Cash Flow Cycle (FCF Check)
As a stoic dividend and cash flow hunter, “volatile FCF” naturally breaks my heart. According to your data, we’re currently at an FCF yield of about 2%. My filter says: >5% is attractive. The fact that analysts predict the yield will jump to 12% by 2028 is just music in the future. The stock market trades on the future, sure—but project-based business remains cyclical. One delayed major project, and cash flow slides into the next quarter.
3. Valuation & FOMO Risk
This is setting off all my alarm bells: The stock has only been on the market since February 2026 (IPO hype) and just posted a +48.55% gain last month. A P/E ratio of 31 and a PEG ratio of over 3 for an infrastructure builder with low margins is ambitious. The market is currently pricing in pure “AI data center” growth. This almost violates my ironclad exclusion rule: Right now, the “story > numbers.”
My cold, hard conclusion:
This is absolutely not a stock for a stoic dividend-focused portfolio (the A-side). If anything, $MWH is a purely speculative growth satellite for the B-side. But after a nearly 50% surge in 30 days, I’m definitely not jumping on this bandwagon blindly.
Top-notch research and a super exciting company! It’s definitely going on my watchlist for the B-side—but only once the RSI has cooled off and the initial hype has died down.
Greetings from the engine room,
Raketentoni 🚀
You did reach out to the great @Dividendenopi, but I’m not going to pass up the chance to run this through my analysis machine right away!
First, the praise: You’ve got an absolute mega-trend on your hands. The narrative that “data centers and AI need massive amounts of green energy” is currently the hottest story on the market, and as an EPC and O&M service provider, SOLV Energy is exactly the shovel seller this gold rush needs. I also really like what I see on the balance sheet—the fact that net debt will turn negative starting in 2026 shows that the fundamentals are solid. This isn’t some zombie company, but a real business.
But now comes the brutal reality check from the perspective of my “dumbbell” strategy:
1. The Margin Trap (Core Quality Check)
You say it yourself: Margins remain stable in the single-digit range. EPC (Engineering, Procurement, Construction) is a cutthroat project-based business. You have massive revenue, but in the end, relatively little sticks. For my core quality formula (revenue growth + operating margin), this means: Even if revenue is skyrocketing, the weak margin drags the score down. I like margins of 15% and up—that’s where real money is made.
2. The Cash Flow Cycle (FCF Check)
As a stoic dividend and cash flow hunter, “volatile FCF” naturally breaks my heart. According to your data, we’re currently at an FCF yield of about 2%. My filter says: >5% is attractive. The fact that analysts predict the yield will jump to 12% by 2028 is just music in the future. The stock market trades on the future, sure—but project-based business remains cyclical. One delayed major project, and cash flow slides into the next quarter.
3. Valuation & FOMO Risk
This is setting off all my alarm bells: The stock has only been on the market since February 2026 (IPO hype) and just posted a +48.55% gain last month. A P/E ratio of 31 and a PEG ratio of over 3 for an infrastructure builder with low margins is ambitious. The market is currently pricing in pure “AI data center” growth. This almost violates my ironclad exclusion rule: Right now, the “story > numbers.”
My cold, hard conclusion:
This is absolutely not a stock for a stoic dividend-focused portfolio (the A-side). If anything, $MWH is a purely speculative growth satellite for the B-side. But after a nearly 50% surge in 30 days, I’m definitely not jumping on this bandwagon blindly.
Top-notch research and a super exciting company! It’s definitely going on my watchlist for the B-side—but only once the RSI has cooled off and the initial hype has died down.
Greetings from the engine room,
Raketentoni 🚀
•
1111
•5Mês·
Energiekontor vs. TDIV
$EKT (-1,1%) is finally moving into the green zone for me. I'm now considering liquidating the position I've been stuck with for over 2 years and simply shifting the sum into the $TDIV (-0,12%) and simply reallocate it to the What is your opinion, is there anyone here who $EKT (-1,1%) who is confident that the stock will outperform in the next 2-3 years $TDIV (-0,12%) in terms of both growth and dividends?
44
4 Comentários5Mês
Hello
Short info, should you be interested
IE000QYDXKV5 is the accumulating variant of $TDIV, with an issue date of 17.04.2026 and placed in Ireland!
Short info, should you be interested
IE000QYDXKV5 is the accumulating variant of $TDIV, with an issue date of 17.04.2026 and placed in Ireland!
•
55
•5Mês·
Most important news of the past week
As every week before the start of the new week, the most important news from the past week.
Tuesday:
Bayer surprises with its agricultural division of all things. The company is still struggling with legal disputes. In the first quarter, the profit of $BAYN (-0,25%) Bayer doubled to 2.76 billion euros. Also because the pharmaceuticals business performed better than analysts had expected.
$G24 (-0,62%) Scout24 raises its growth forecast and dispels AI concerns. The EBITDA margin is set to rise to 64% by 2028. Revenue is expected to grow at a double-digit rate by then.
Wednesday:
$EOAN (+0,57%) Eon presents good figures for the first quarter. Consolidated net profit climbed significantly by 7% to 1.3 billion euros. Eon also invested 1.4 billion euros. Eon is the largest provider of energy networks in Europe.
$EKT (-1,1%) Energiekontor started the year as planned. The Group's own portfolio has increased to around 450 megawatts. Projects with a capacity of 650 megawatts are under construction and construction is proceeding according to plan.
https://www.ecoreporter.de/artikel/energiekontor-liegt-im-plan-aktie-gewinnt-57/
Due to a record order from Ukraine, SFC Energy $F3C (+0,36%) SFC Energy is raising its forecast. Sales are expected to rise to between 163 and 175 million euros. The major order from the Ukraine alone brings in 42.7 million euros; highly mobile fuel cells will be sold.
Thursday:
Cisco raises its forecast significantly, the share price gains substantially. For the full year, Cisco now expects sales of USD 62.8 - 63 billion. In the last quarter, profits rose by almost a third to USD 3.4 billion.
Friday:
Kevin Warsh takes over as Chairman of the Fed this Friday. Many are curious to see what central bank policy will look like under the new chairman. Trump, at least, would like to see interest rates cut. In the past, Warsh was better known for his position on reducing the Fed's balance sheet.
https://www.zeit.de/2026/22/kevin-warsh-federal-reserve-notenbank-donald-trump/seite-3
33

6Mês·
Energiekontor achieves solid consolidated result in the 2025 financial year and strengthens basis for further growth
Press release from $EKT (-1,1%) dated 31.03.2026. Light at the end of the tunnel? At least for today, a clear plus again, after the share price had already risen yesterday.
- Group EBT at the upper end of the adjusted forecast
- Sales and earnings up on previous year
- Dividend proposal doubled to EUR 1.00 per share
- Challenging market environment - increasing visibility expected over the course of the year
- Significant earnings potential for the coming financial years
Bremen, March 31, 2026 - Energiekontor AG ("Energiekontor"), one of the leading German project developers and operators of wind and solar parks based in Bremen and listed in the General Standard, has met the forecast for the 2025 financial year, which was adjusted in October 2025, at the upper end of the range and, from today's perspective, expects a further improvement in consolidated earnings in the 2026 financial year. In addition, Energiekontor confirms its multi-year growth target, taking into account the changed framework conditions.
Adjusted forecast for 2025 met at the upper end of the range - dividend proposal doubled
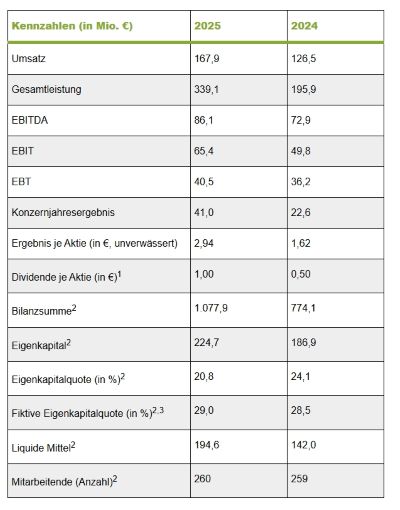
In an increasingly complex and challenging market environment, Energiekontor generated increased consolidated revenue of EUR 167.9 million in the 2025 financial year (2024: EUR 126.5 million). Total operating performance amounted to EUR 339.1 million (2024: EUR 195.9 million). In particular, the increase in project planning activities recognized in profit or loss led to a higher consolidated operating result (EBIT) of EUR 65.4 million (2024: EUR 49.8 million), which corresponds to an EBIT margin of 38.9% (2024: 39.4%). Adjusted for higher interest expenses, Energiekontor generated consolidated earnings before taxes (EBT) of EUR 40.5 million (2024: EUR 36.2 million) and an EBT margin of 24.1 percent (2024: 28.6 percent).
The year-on-year increase in Group EBT thus meets the earnings forecast adjusted in October 2025 for Group EBT in the 2025 financial year at the upper end of the range, which envisaged consolidated earnings before taxes of around EUR 30 to 40 million. Previously, Energiekontor had assumed a higher range of around EUR 70 to 90 million. The main reason for the reduced profit forecast was the postponement of key closing conditions for upcoming transactions, which could therefore no longer be met in the 2025 financial year. This related in particular to project delays caused by the authorities and the resulting deadline extensions as well as the postponement of the announcement and updating of grid connection commitments as part of the ongoing grid reform in the UK.
In the 2025 financial year, Group taxes were positive in the amount of EUR 0.4 million (2024: EUR -13.6 million), resulting in a Group net income for the year of EUR 41.0 million (2024: EUR 22.6 million), which was therefore slightly higher than the Group EBT. The positive tax effect mainly resulted from favorable tax conditions for a project sold abroad and the reversal of deferred taxes. Basic earnings per share amounted to EUR 2.94 (2024: EUR 1.62).
The shareholders of Energiekontor AG should participate in the development of the company even in challenging financial years. The amount of the dividend payout is based on the net profit generated. The Management Board and Supervisory Board will therefore propose to the Annual General Meeting on May 27, 2026 in Ritterhude that around 35 percent of Energiekontor AG's net retained profits be used for the dividend distribution. The proposed distribution corresponds to a dividend of EUR 1.00 per share, which is double that of the previous year (2024: EUR 0.50).
Significant increase in earnings in the Project Planning and Sales segment
In the 2025 financial year, the Project Planning and Sales segment generated increased external revenue of EUR 94.9 million (2024: EUR 52.4 million). At EUR 20.8 million, segment EBT almost tripled compared to the previous year (2024: EUR 7.3 million).
In the 2025 financial year, Energiekontor sold seven wind projects with a total generation capacity of around 209 megawatts (2024: 51 megawatts), of which one British wind project and one German repowering wind project contributed to the segment result for the 2025 financial year. The remaining five turnkey wind projects that have been sold and are currently under construction will be recognized in profit or loss when they are commissioned in the 2026 and 2027 financial years.
As of December 31, 2025, a total of 21 projects with a total generation capacity of around 640 megawatts were under construction or financial close had been reached for these projects (December 31, 2024: 368 megawatts). In addition, Energiekontor commissioned two solar parks and one wind park with a total generation capacity of around 83 megawatts in the reporting year (2024: 124 megawatts). As of the reporting date, there were also 34 building permits with a total generation capacity of almost 1.2 gigawatts (December 31, 2024: 1,129 megawatts). In terms of total nominal capacity, the majority was attributable to the UK project business, followed by Germany, while the remaining share was predominantly attributable to the French market.
Stable earnings in the electricity generation segment with further expansion of the proprietary portfolio
In the 2025 financial year, external revenue in the Electricity Generation segment from the Group's own wind and solar parks was roughly on a par with the previous year, with the segment generating external revenue of EUR 68.6 million (2024: EUR 69.4 million). The segment result (EBT) amounted to EUR 17.1 million (2024: EUR 26.0 million). The lower earnings are mainly due to one-off special effects recognized in profit or loss, which were included in the previous year and which were primarily based on receivables in connection with the compensation of earnings shortfalls at various wind farms in Germany. Apart from this, the segment result in the 2025 financial year showed a comparatively solid development.
The total generation capacity of the Group's own portfolio of wind and solar parks increased to around 448 megawatts in the course of the 2025 financial year (December 31, 2024: around 395 megawatts). The expansion of the proprietary park portfolio was driven forward in particular by the commissioning of new solar projects. Further projects with a total generation capacity of more than 230 megawatts, which are intended for the proprietary portfolio, are currently under construction. The aim is to expand the proprietary park portfolio to over 680 megawatts, with this target figure rising continuously as further financial closures are achieved.
Electricity production from our own parks amounted to around 617 gigawatt hours in the reporting year and was therefore slightly above the previous year's level despite a significantly below-average wind year. Additional generation contributions from newly commissioned solar parks had a stabilizing effect.
Operating Development, Innovation and Other segment makes solid contribution
The Operational Development, Innovation and Other segment recorded revenue and earnings development slightly below the previous year's level. External revenue decreased slightly to EUR 4.4 million (2024: EUR 4.6 million). The segment result (EBT) reached EUR 2.5 million (2024: EUR 2.8 million).
Project pipeline continues to grow - share of advanced projects increased again
Energiekontor was again able to expand the high level of its project pipeline in the 2025 financial year. As of December 31, 2025, the project pipeline amounted to around 11.6 gigawatts (excluding US project rights) compared to 11.2 gigawatts in the previous year. Including US project rights, it amounted to around 12.2 gigawatts (31 December 2024: around 12.1 gigawatts).
At the same time, the proportion of projects in advanced development phases increased again. Their total generation capacity amounted to around 3.1 gigawatts (December 31, 2024: around 2.7 gigawatts) and forms the basis for short and medium-term growth while maintaining the high quality of the project pipeline. Technological diversification was also driven forward. Solar projects now account for around a third of the project pipeline.
Continued focus on growth strategy 2023 to 2028
The 2025 financial year was characterized by a very dynamic market environment. In particular, extended project realization times, limited availability of systems and infrastructure as well as delays in grid connection confirmations and tendering processes - especially in the UK - affected the timing of project sales. In Germany, too, there are currently still uncertainties with regard to the future structure of the EEG subsidy system from 2027 and the specific design of the announced grid package, the effects of which cannot yet be conclusively assessed. It can be assumed that these framework conditions will initially remain in place for the rest of 2026. Energiekontor expects that planning certainty will gradually increase over the course of the year as soon as the regulatory requirements in the core markets of Germany and the UK become more concrete.
In this context, the operational development of the business remains robust. At the same time, the market mechanisms in project development have changed noticeably. An increasing number of approved projects is coming up against continued high costs for plants, infrastructure and financing as well as falling award values in the Federal Network Agency's tenders, which is increasing the economic pressure on individual projects. Energiekontor is countering these developments with consistent project selection and focused management of the project pipeline. The company is benefiting from its lean organizational structure and high operational efficiency.
Against this backdrop, earnings performance remains largely determined by the timing of individual project sales and realizations. At the same time, the continuous expansion of the proprietary portfolio strengthens the basis for stable, recurring income and increases the resilience of the business model. At the same time, despite the high level of investment activity, the company has a robust liquidity position and a solid equity base that financially secures the implementation of the project pipeline and the expansion of the proprietary portfolio. This further increases the stability and predictability of the Group's earnings base. In addition, Energiekontor is continuously working on further strengthening its competitive position through targeted technological and innovative improvement measures, including in the areas of smart wind farm controlling, proactive maintenance, hybrid parking concepts, battery storage solutions and other measures to improve project profitability.
Based on current project planning and taking into account the remaining uncertainties with regard to regulatory and market conditions, Energiekontor currently expects consolidated earnings before taxes (EBT) in a range of EUR 40 to 60 million for the 2026 financial year (2025: EUR 40.5 million). The forecast deliberately reflects the current uncertainties regarding the timing of project implementation. The main contributions to earnings are expected to be generated from several ready-to-build sales in the UK market, from the commissioning of the three German turnkey wind farms sold in the 2025 financial year and from the company's own wind farm portfolio.
With increasing planning certainty regarding the regulatory and infrastructural conditions over the course of the year and the resulting confirmation of previous project planning, Energiekontor sees significant potential for additional earnings contributions in the coming financial years. Against this background, the growth strategy 2023 to 2028, which aims to achieve Group EBT of EUR 120 million in the 2028 financial year, remains focused on sustainable and profitable growth and will be further specified and sharpened with increasing clarity over the course of the year, actively taking into account the market and general conditions that have changed in the meantime.
"In the 2025 financial year, we created a solid earnings base in a very challenging environment and met the upper end of our forecast, which was adjusted in October 2025. Even if the currently communicated forecast range for 2026 may appear cautious at first glance in view of the existing project portfolio, it deliberately reflects the remaining uncertainties regarding the timing of project implementations. However, with increasing clarity regarding the regulatory and infrastructural framework conditions, we expect significantly improved predictability and continue to see considerable potential for additional earnings contributions in the coming years," says Peter Szabo, CEO of Energiekontor AG.
The Annual Report 2025 contains further information on Energiekontor's business development, financial position, economic and market environment and outlook. It is available for download at https://www.energiekontor.de/investor-relations/finanzberichte.html for download.
1For the reporting year 2025 subject to the approval of the Annual General Meeting on May 27, 2026.
2As at the reporting date (31.12.).
3More details on the notional equity ratio in the Annual Report 2025 on page 81.
The Energiekontor AG share (WKN 531350/ISIN DE0005313506/General Standard) is listed on the SDAX of the German Stock Exchange in Frankfurt and can be traded on all German stock exchanges.
contact
Julia Pschribülla
Head of Investor & Public Relations
Phone: +49 (0)421-3304-126
1515
3 Comentários
6Mês
Very nice. The dividend increase tastes good. If the share price shows some movement in 2026, I'll almost be satisfied.
•
22
•
7Mês·
Position sizing under uncertainty - Why portfolio weighting is more important than the perfect entry point
Reading time: approx. 4-5 minutes
One of the questions that comes up again and again here on Getquin is: When is the right time to buy? The discussion often revolves around valuations, historical multiples or possible setbacks. This perspective is understandable. At the same time, it often distracts from a decision that is at least as important for the risk of a portfolio: the position size.
Many losses do not occur because an idea was fundamentally wrong. They occur because a position was too large. Conversely, the opposite also happens. A good idea works, but is weighted so small that it has hardly any effect on the portfolio. It is therefore worth thinking not only about whether a company is interesting, but also about how much capital should be allocated to it in the first place.
The background is relatively simple. The future is uncertain. Companies can perform better or worse, markets can grow or stagnate, valuations can rise or fall. Forecasts usually try to predict a single future path. In practice, it often makes more sense to work with scenarios, i.e. several plausible developments.
This is exactly where the logic of position sizes begins.
Position values are essentially derived from two dimensions. Firstly, from the quality of a company. This includes competitive advantages, return on capital, market position and the stability of cash flows. Secondly, from the uncertainty of future developments. This can arise from technological changes, cyclical markets, regulatory risks or simply the size of a company.
The higher the quality and the more stable the business model, the larger a position can be in the portfolio. The more uncertain the possible future paths, the more cautious the weighting should be.
A small thought experiment illustrates this logic.
Assume a company is analyzed and three plausible scenarios for the next five years are defined.
In the bullish scenario, the company grows strongly, the valuation remains stable and the share price doubles. In the neutral scenario, the company grows moderately and the share price rises by around 40 percent. In the bearish scenario, growth is disappointing and the share price falls by around 30 percent.
If these scenarios are assigned probabilities of around 30 percent for the bullish scenario, 50 percent for the neutral scenario and 20 percent for the negative scenario, this results in an expected value.
30 percent times plus 100 percent
50 percent times plus 40 percent
20 percent times minus 30 percent
The weighted expected value is therefore approximately plus 44 percent over five years. That is attractive. Nevertheless, a high expected value does not automatically mean that a position should be large. The spread of possible outcomes is also crucial. An investment with high uncertainty typically has a lower weighting than a company with more stable cash flows and narrower scenarios.
In practice, this often results in three categories in the portfolio.
The first category is core positions. These are companies with structural competitive advantages, high returns on capital and relatively stable business models. An example of this is $GOOGL (-0,92%) (Alphabet). The company has dominant platforms in the search engine and advertising market as well as considerable economies of scale. Another example is $V (-0,95%) (Visa). The global payment network benefits from strong network effects, high margins and a business model that functions relatively independently of short-term economic fluctuations. Such companies can often achieve weightings of around five to ten percent in the portfolio.
The second category is satellite positions. These are usually smaller companies or companies with more volatile results whose business model nevertheless appears attractive. Examples of this could be $ERII (+0,67%) (Energy Recovery) or $EKT (-1,1%) (Energiekontor). Both benefit from structural trends such as water infrastructure or renewable energies, but are also subject to greater operational fluctuations than global platform companies. Typical weightings here are often in the range of two to five percent.
The third category is option positions. These are investments with very high uncertainty but potentially high upside. Commodity companies or very small growth companies often belong in this group. An example would be $DML (+0,52%) (Denison Mines) from the uranium sector. Such positions are often deliberately kept small, between half a percent and two percent of the portfolio. The idea behind this is simple. If the investment fails, the damage is limited. If the scenario works out, the contribution can still be relevant.
A concrete numerical example makes this logic more tangible. Let's assume a portfolio of 100,000 euros. A core position with an eight percent weighting then corresponds to around 8,000 euros. A satellite position with a weighting of three percent corresponds to around EUR 3,000. An option position with a weighting of one percent corresponds to around EUR 1,000. Even if such an option position fails completely, the effect on the overall portfolio remains manageable.
Another point is often underestimated. Position sizes are not static. They change automatically over time. If a share rises sharply, its weighting in the portfolio increases. Many of the biggest portfolio winners arise precisely because successful positions are not reduced too early.
An originally small position can become one of the largest positions in the portfolio over the years. This is not a mistake, but often a sign that a good idea has actually developed.
Conversely, it can make sense to reduce positions if valuations rise sharply or if the weighting has become disproportionately large due to price gains. The aim here is not to time short-term price movements. The aim is to maintain the stability of the portfolio architecture.
The most common mistake in this context is overconcentration. It is rarely the result of a consciously planned strategy. It is often the result of narratives. A convincing story, a phase of rapid price gains or strong attention can lead to individual positions being expanded further and further. This makes the portfolio more susceptible to errors.
The key insight is therefore relatively simple.
A robust portfolio is not created by timing every share perfectly. It is created by allocating capital sensibly according to quality, valuation and uncertainty.
Or to put it another way.
The entry determines the price.
The position size determines the risk.
The next article in the series therefore deals with a question that follows on directly from this. How do you actually deal with winners in the portfolio? When should a position simply be allowed to continue and when does a weighting become too large? An exciting example of this is $GOOGL (-0,92%) (Alphabet). A company that has achieved enormous increases in value over many years and at the same time repeatedly raises the question of how to deal sensibly with such winners in the portfolio. This is exactly what the next part will be about: Managing winners properly.

8181
18 Comentários
I've been working on the topic of managing winners properly for some time now. When will the next part be published?
•
44
•9Mês·
Dividendenopi inside ( Part 2 )
We continue with insights into the goings-on of the dividend opi. If you missed the first part, you can find it here: Dividendenopi inside Teil 1 Dividendenopi Rewind2025
As the second part is less about shares, I'll at least start with the rest and the question from @Epi about the Zockeropi. I still have one position each in the, let's say, hidden area of $EKT (-1,1%) and $NOVO B (-0,34%) each. Neither trading nor dividend stocks as I see it, so they are bobbing around in the middle of nowhere. Both are currently in negative territory and have a current market value of around €30,000. To be honest, I still don't really know what I'm going to do with them. In my opinion, EKT is still a rock-solid value and clearly undervalued. Despite all my understanding for the delays, which are apparently through no fault of their own, they have to deliver this year. Otherwise I will actually realize the losses, but they are absolutely manageable. And about Novo, well, what more can I say... Ignored the warnings during the high phase and took the crash in its stride. Due to the recovery over the last few days, the share is moderately down by just over 10%. Depending on my mood on the day, however, this could quickly disappear.
And to ensure that my strategy as a whole doesn't get boring and that the gambling child in me is kept in mind so that it doesn't do anything stupid with larger investments, I have turned more intensively to short-term trades since the middle of last year. In June with $DEFI (-2,7%) and $HIMS (-3,68%) initial modest successes have encouraged and "hooked" me by, among other things @Multibagger one or two copy trades. My play money is strictly limited to a maximum of 5% of my total capital. I haven't invested that much yet, but despite everything $IREN (-1,77%) , $CIFR (-2,87%) and some other trades have brought me nice profits on the side. Most recently I closed yesterday $AII (+1,39%) closed yesterday with 40% plus. The largest position in the trading portfolio at the moment is again $IREN (-1,77%) with EK 35€ and a slight plus. The rest, $CA1 (-0,07%) , $DEFI (-2,7%) , $LYC (-1,34%) , $NB (-1,13%) and $null are not doing so well at the moment, which is why I am currently in the red. I currently have € 20,000 invested there, but the holding period for these shares and the long is also designed for a maximum of 6 months, so I will look again in April.
So far so good.... Now comes the outing and the boring part of my investments, which still make up the majority of the capital invested. Expiring fixed-term deposits have already been and will be put into the market. Due to my age, I tend to be a bit conservative when it comes to choosing my broker and would have a stomach ache with a neo-broker for this amount. For a while I had my investments diversified with S-Broker, ING and Consors. Overnight deposits at various institutions in recent years, where the best new customer offers were available. I'm still hopping and currently have a good €370,000 in call money. The best interest rate for 12 months until mid-26 is with BBVA, where I'm realizing 3.25% thanks to a promotional bonus. Volkswagenbank, Fordbank, Stellantisbank and Renaultbank are always offering special promotions for existing customers with interest conditions to compensate for inflation. The advantage of all the aforementioned banks is the monthly interest payout for regular income, and the trend at the moment is again towards higher offers for new customers of just under 3%, so I will be shifting around a little over the next few days and weeks. Longer-term fixed-term deposits will gradually expire over the next 2 years, where I have conditions from the beginning of 24, e.g. at Kommunal Kredit for 4.5%, the others are between 3.4 and 4.1%. In total, this currently amounts to € 125,000 with annual interest payments for further cash flow.
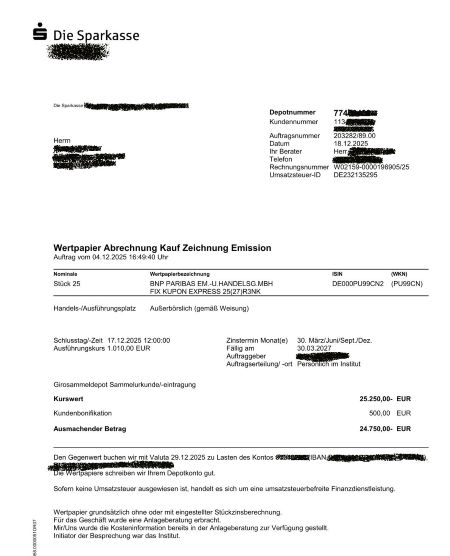
The third large chunk, and therefore the rest of my capital, is invested in bonds and certificates. More on this in a moment. Where do I have my securities account now? Drum roll... 😇😇At the savings bank, sic!🤷♀️ At a large savings bank in the big city around the corner as part of a private banking agreement. I have an all-in-fee that costs really fat fees every year. 1.25% of my average portfolio value p.a. And that's a four-figure sum at the top end. Before everyone faints or thinks I'm out of my depth, a few words of explanation and insight into my decision. I can trade where I want, as much as I want and what I want within the limits of these fees. Of course, I can also pay less for a used small car, but as I mentioned, it's just not for me. One of the reasons I took this route was because of the annual costs I would otherwise incur with ING and S-Broker. Given the trading volumes, that wasn't exactly low either. For me, these costs would have been costs anyway. The decisive advantage, in addition to almost 24-hour all-round support and a personal portfolio manager, lies in trading certificates. I like to use fixed coupon express certificates for cash flow. They are available on many stocks. This year I was / am invested in Siemens, LVMH, BMW, Daimler Truck, Vonovia, Renk, among others. They all had / have interest rates between 6.5% and 9.75%. Latest "deal" a certificate on $R3NK (-2,06%) on 29.12 with 11.7% and a new one now starting in January with 11.5%. The interest is paid out quarterly on a pro rata basis and makes a not insignificant contribution to my monthly income. I am always offered these certificates for subscription before they are issued, the issue premium is waived as part of my agreement and I receive a large part of the "internal commission" from the savings bank, which is called a customer bonus. I am attaching the statement of my Renk certificate from December 29th to make it easier to understand.
In this case, with an otherwise regular issue price of € 1,010 for a € 1,000 share, I have in any case already "recouped" part of my fees (saved issue premium plus lower subscription price), with other providers and lower interest rates this can be up to 2.5% and more. These express certificates usually come back in the next 6 to 9 months when the early payout levels are reached and I get back the € 1,000 nominal value, plus the interest accrued up to that point. Unfortunately, I have to pay tax on the difference between my cheaper purchase and the nominal value as a profit. The money is then immediately reinvested in corresponding new certificates. This means that I have a regular annual circulation with a corresponding volume, not every certificate is returned, and in total this recoups my fees. Sounds a bit like a milkmaid's calculation, but it works out. We can discuss this in more detail. For now, this is only part of my motivation. However, these certificates are one of the main pillars of my cash flow and are relatively default-proof thanks to downward barriers of 40 to 50%, but of course you have to look at the underlying securities.
Other investments are in capped bonus certificates with a barrier. These offer no ongoing cash flow, but "reward" you with decent returns if they perform well and are particularly suitable for sideways or slightly falling markets. For both variants, it must be said that dividends from the reference stocks are excluded and a strong upward trend in the individual underlying stocks does not lead to overperformance and in the latter case is also limited (capped) or leads to premature liquidation in the case of express certificates. If you keep abreast of the market, the risks are manageable and the maturities are limited to a maximum of 2 years, usually less.
There are other variants of these certificates, if there is interest I would present these in a separate series. They are not performance boosters, but with the right selection they can lead to stability and ongoing cash flow or pre-defined potential price gains even if the markets do not perform as everyone would like.
That's it from my side, I've let my pants down and shown how I, as an old fart with an appropriate amount of capital, try to structure my monthly returns without taking excessive risks and why and how I do it. Perhaps it will help some investors who are not so risk-averse to think about alternatives. I would like to thank everyone who has stuck with me to the end and see you soon. Your Dividend Topi

10Mês·
Basic knowledge - reading beta correctly: What your portfolio reveals about its market sensitivity
Reading time: approx. 5–6 minutes
Many of my recent posts have focused on metrics that help clearly classify business models, risks, and valuations. Beta is one such metric—and it plays a particularly important role. It’s widely available and easy to look up, but it only becomes truly meaningful when viewed in the context of an entire portfolio. This is because beta does not describe the company itself, but rather how a stock behaves in relation to the market.
Mathematically, beta measures the relationship between stock returns and market returns. It is based on the covariance of these returns—which is always derived from historical data. However, the interpretation is inevitably forward-looking, because we use past patterns to infer how a stock will typically behave relative to the market in the future.
Formally, the metric is defined as:
Beta = Covariance(stock return, market return) / Variance(market return)
In practical terms, this means: When the market moves, how strongly does the stock typically move along with it? Values around 1 indicate movements similar to the market; higher values indicate greater volatility, while lower values indicate more stable behavior.
The reason beta is often misinterpreted is that it is not stable. It depends heavily on the time period, the market phase, and the chosen index. A company can continue to perform solidly, but suddenly exhibit a different beta due to changes in interest rates or the risk environment. Beta therefore measures behavior—not quality.
To better illustrate how beta affects a portfolio, it’s worth taking a look at my portfolio. It combines robust, high-quality stocks such as Visa, Alphabet, and Honeywell; growth-oriented technology stocks such as ASML, Nu Holdings, and Innodata; defensive infrastructure and water stocks such as Consolidated Water, Energiekontor, and Energy Recovery; the global ETF tracking the MSCI ACWI; and a uranium block as a cyclical play featuring Cameco, NexGen, Denison Mines, Paladin Energy, and Yellow Cake. Bitcoin rounds out the mix as a standalone, significantly more volatile component.
This mix clearly illustrates why beta is useful to me in my day-to-day investing. Different stocks can be fundamentally strong yet contribute very differently to the portfolio’s volatility profile. Some positions smooth out volatility, while others amplify it—regardless of whether the companies are well-managed or highly profitable. It’s about market behavior, not balance-sheet quality.
For my beta analysis, I use conservative, industry-standard 3–5-year figures from major providers. Most betas are calculated based on daily or monthly returns over precisely these time periods—long enough to be statistically stable and short enough to realistically reflect current market phases. Where official data is unavailable, appropriate sector values are used.
The betas used are as follows:
Large Caps
• $ASML (+0,71%) : 1.25
• $GOOGL (-0,92%) : 1.05
• $V (-0,95%) : 0.95
• $HON (+1,67%) : 1.00
Mid-Caps / Infrastructure
• $CWCO (-0,92%) : 0.80
• $EKT (-1,1%) : 0.75
• $ERII (+0,67%) : 1.20
• $SOP (+1,48%) : 1.10
Small-Cap / High Beta
• $INOD (-0,19%) : 1.80
Uranium Segment (Cyclical)
• $CCO (+0,17%) : 1.40
• $NXE (+0,57%) : 1.60
• $DML (+0,52%) : 1.70
• $PDN (-1,26%) : 1.50
• $YCA (+0,9%) 1.30
ETF
• $ISAC (-0,11%) : 1.00
Crypto
• $BTC (-0,84%) : 2.50
The only factor that matters for the portfolio beta is the size of each position relative to the portfolio.
Here’s how the portfolio beta is calculated:
You look at the size of each position in the portfolio, multiply that share by the beta of the respective stock, and add up all the contributions. Each position therefore contributes to the overall beta exactly in proportion to its weighting.
Applying the weightings of my portfolio in this context yields the following result: The portfolio has a beta of approximately 1.33. This value aligns with the portfolio’s structure: a stable foundation, several growth-oriented components, a deliberately included uranium block, and Bitcoin as a stronger lever.
A beta at this level indicates a fundamentally more aggressive portfolio.
- During uptrends, it outperforms the market.
- During corrections, it reacts more quickly and more sharply.
- The strongest drivers are Bitcoin, Innodata, NexGen, Denison Mines, and Paladin Energy.
- Visa, Consolidated Water, Energiekontor, and the MSCI ACWI ETF provide counterbalances.
This shows that beta is no substitute for fundamental analysis, but it does reveal how a portfolio moves and why. It helps calibrate expectations, contextualize fluctuations, and manage the portfolio’s structure more consciously. A beta of 1.33 is not a judgment on quality—it’s a description of movement. The only thing that matters is whether this dynamic aligns with your own investment strategy.
Finally, two questions for you:
Do you know your portfolio’s beta?
And does it play a role in your portfolio strategy—or not really?

2424
15 Comentários
No, I don't actually know the figures for my entire portfolio.
However, my portfolio has been extremely nervous so far. 😂
However, my portfolio has been extremely nervous so far. 😂
•
11
•
10Mês·
Opinion on Energiekontor⚡️
After some research, I am considering joining Energiekontor.
Of course, they were recently penalized quite a bit due to a reduction in their annual targets, but strong growth has been indicated for 2026. In addition, the company seems to be quite well positioned compared to the industry, especially in terms of ROE.
What do you think of the company, is anyone invested here? $EKT (-1,1%)
Good evening to you all 🌝
77
14 Comentários10Mês
I am invested. My equity was just under 49, so I'm well in the red. But that doesn't bother me at the moment. Business is solid and there's also a dividend. If you already have $2GB, I don't see any reason to open a second stock in the sector. Unless you want to build your own sector ETF. Otherwise, there are certainly more exciting stocks at the moment. Just have a look at @Tenbagger2024, he has presented enough recently
•
44
•Títulos em alta
Principais criadores desta semana
Dados tempo real da LSX · Dados financeiros e EOD da FactSet