
$XDEM (-2,22 %)
$XDEV (-0,64 %)
$WSML (-1,33 %)
$CSPX (-1,11 %)
$IWDA (-1,11 %)

iShares MSCI World Small Cap ETF
ETP
ETP
ISIN: IE00BF4RFH31
Ticker: WSML
IE00BF4RFH31
WSML
Price
Discussion sur WSML
Postes
141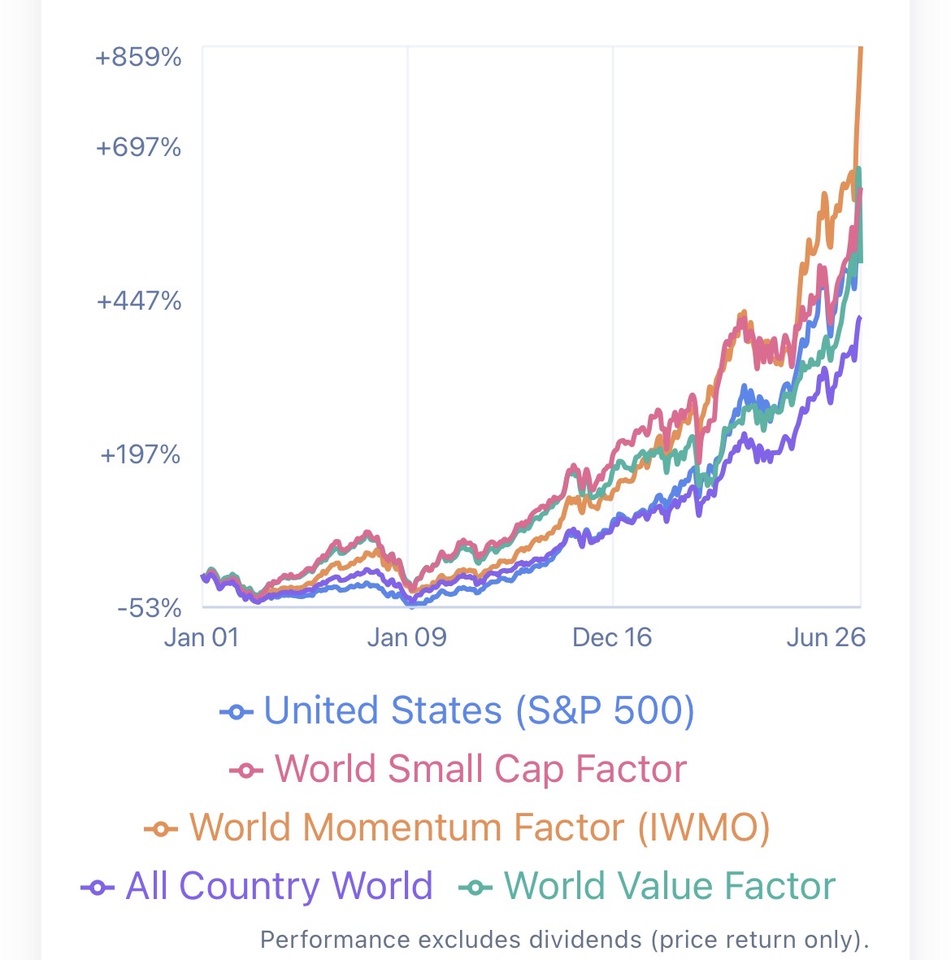
3Sem.·
A doubt of mine
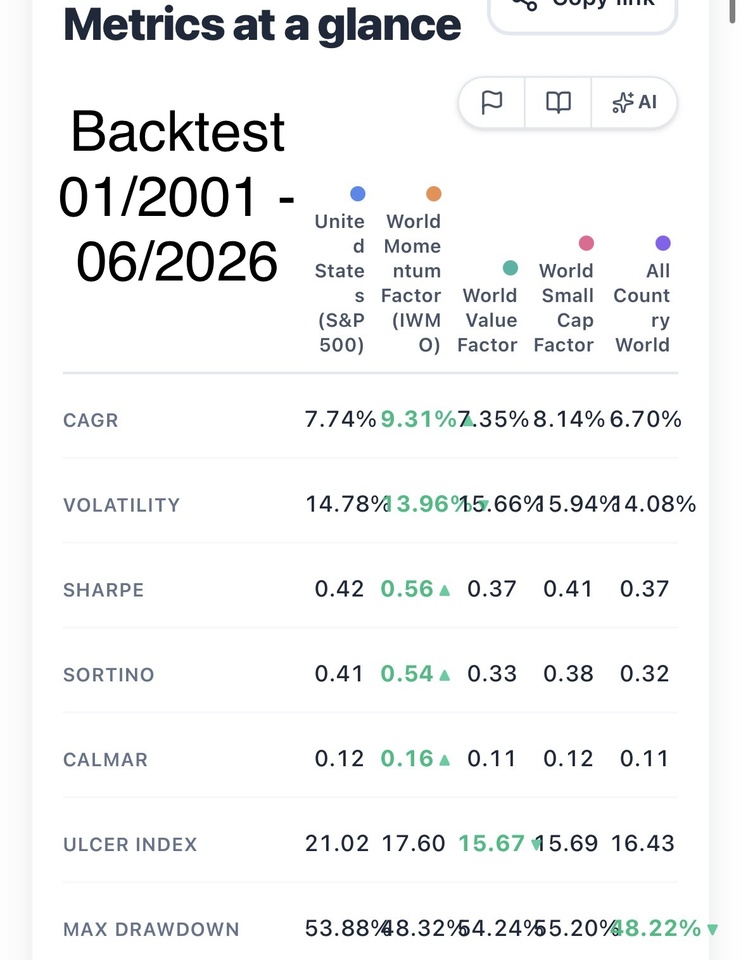
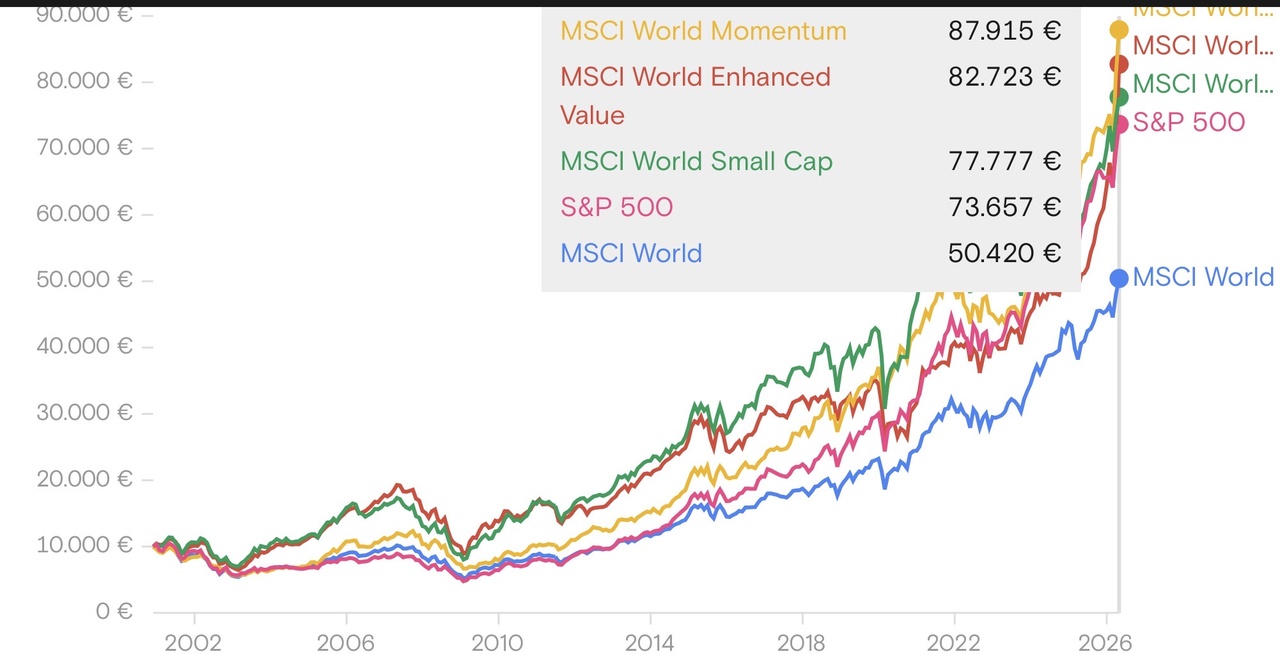
Why people keep on buying $IWDA (-1,11 %) or $VWRL (-1,22 %) as core of their portafolio when the following index perform way better (in fact they beat even the sp500 on a long range, meanwhile keeping global diversification and diversification from the big7).
3Sem.·
MY PLAN TO LIVE OF DIVIDENDS
Hello everyone, I'm 24 y.o. my portfolio is currently worth 55-60 k eur. My plan is to save around 1000 eur per month and invest in growth product for 15-20 years. Specifically:
GLOBAL ETF (50 % allocation):
MSCI WORLD VALUE $XDEV (-0,64 %)
MSCI WORLD MOMENTUM $XDEM (-2,22 %)
MSCI WORLD SMALL CAP $WSML (-1,33 %)
note: they all have had better return (on long range) in comparision with sp500 and ofc msci core world or ftse all word. Plus these etf offer a real diversification from having the big 7 as first positions.
GLOBAL TECH (50 % allocation):
MSCI WORLD INFORMATION TECHNOLOGY $XDWT (-1,9 %)
NASDAQ 100 $XNAS (-1,73 %)
note: msci world IT it's good bcs with the time it can move towards international technology stocks and not only american, meanwhile the nasdaq it has the advantage of having also companies that are not directly linked to technology but general innovation (plug power, rocketlab ecc.). BOTH ETF HAVE THE SAME RETURNS OVER THE TIME.
Once I'll reach the milestone of 1 million I'll allocate everything in these 2 etf high dividend stocks:
VanEck Morningstar Developed Markets Dividend Leaders
iShares STOXX Global Select Dividend 100
note: these etf are incredible, they have only 20 % of USA, they are super diversified all around the world + no tech sector present (that is usually speculative, volatile and where bubbles can be more likely to happen). Only big worldwide companies that offers high dividend and are super stable.
BE READY FOR IT:
avarage dividend annually: 4.5 %
avarage growth annualy: 8 %
it means that you start to take 45 k (before tax) annually in dividends + your capital of 1 million is growthing at 8 % rate and doing composite interest over the years. Each year your dividend passive income increase and your capital too. If there is a finacial crises ? well for sure these etf will loose way more then sp500, nasdaq and other products. These companies are defensive, they have big cash flow and investors invest in them when they are afraid of the tech market or others speculative sectors.
LET ME KNOW WHAT YOU THINK ABOUT IT !!!!!
Enjoy your day and let's make it.
55
5 Commentaires
In theory there is no direct connection between dividend and gained wealth.
You could just stay in your global etf plan and go for it.
Nearly the same goes for sector an Country etfs.
Still everything can go according to plan. Just brace yourself for a smaller crash when high yield stocks cut dividends in half.
You could stay in plan a) and just sell a part of your portfolio. When you need some money.
I plan to hold $XDEM $XDEV $XDEQ $ZPRV $ZPRX and $5MVL for life. Selling small parts of it when I want to spend.
That way I take a more scientific approach and don’t pay unnecessary taxes. At least for me in Germany dividends have high disadvantages anyway
•
22
•
3Sem.·
Trying to balance growth and dividend investing.
I'm trying to find the right balance between ETFs and individual stocks.
My long-term goal is to build wealth steadily over the next 20–30 years, while still owning a handful of individual companies that I believe in.
Over time, I'd also like to shift my portfolio towards a stronger dividend focus, without sacrificing too much long-term growth.
Looking at this portfolio:
- Is there anything that stands out to you?
- Are there any positions you think are unnecessary, overweight, or missing?
I invest €3,500 every month through my ETF savings plan:
$VWRL (-1,22 %) = 800 euro
$WSML (-1,33 %) = 300 euro
$PRAM (-2,01 %) = 300 euro
$JEGP (-0,22 %) = 325 euro
$STHE (-0,19 %) = 325 euro
$BTCE (-0,09 %) = 100 euro
$SDIP (-0,28 %) = 300 euro
$WINC (-0,52 %) = 350 euro
$LDGL (-0,69 %) = 350 euro
$TDIV (-0,03 %) = 350 euro
What would you change first, and why?
Always interested in constructive feedback.
31Positions
43 967,56 €
8,59 %
55
3 Commentaires
3Sem.
It seems you've made a few mistakes in the past. What happened, and what have you done to improve?
•
11
•
1Mo·
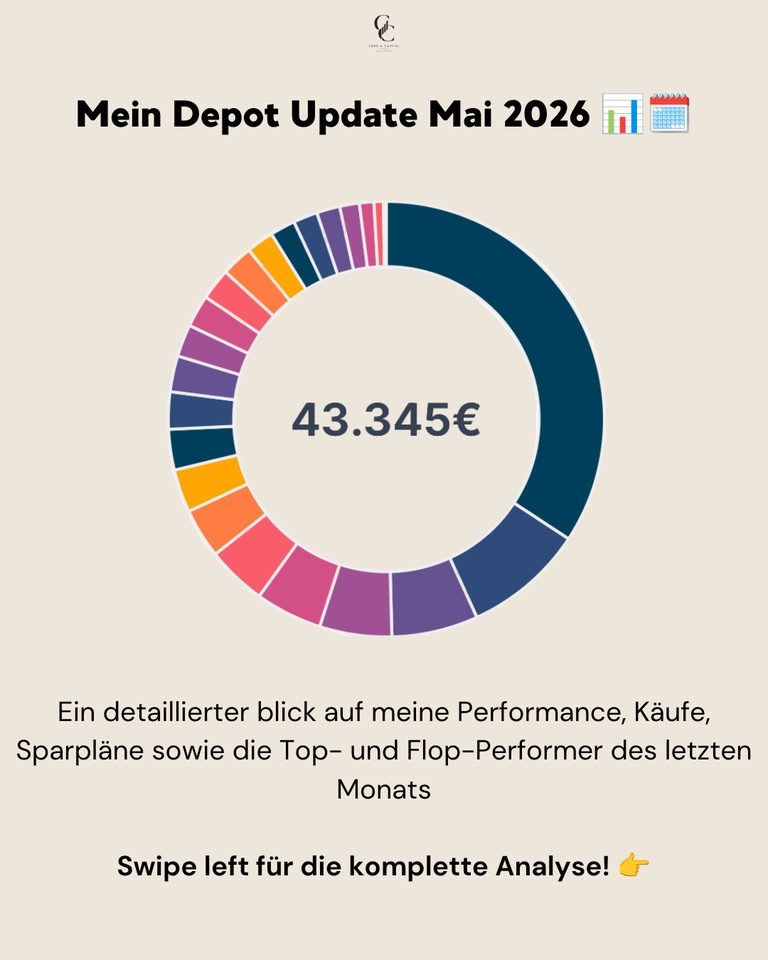
📊 My securities account update May 2026
May was dominated by strong figures and a massive rally in the tech and cloud sector. While April was still characterized by a general recovery, excellent quarterly figures and the unbroken AI boom continued to fuel the markets in May. The Nasdaq in particular benefited greatly from this and reached new highs. Even though volatility was noticeable in isolated cases, investors made strong gains in growth stocks.
My portfolio was able to take advantage of this strong momentum and achieve an outstanding performance, but was narrowly beaten by the extremely strong performance of the Nasdaq 100:
📊 Monthly performance: +9,33%
📊 Portfolio value: ~43.345 €
📊 Performance max. (06.01.2022): +43,84%
📊 Performance YTD: ~+10,44%
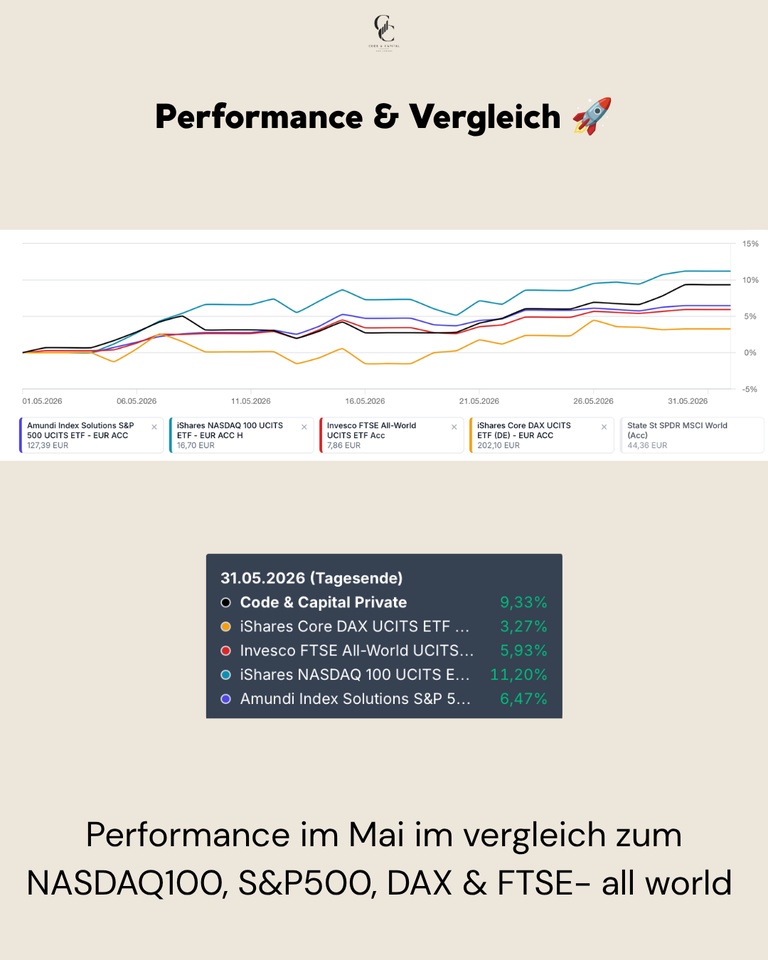
Performance & comparison 🚀
Performance in May was exceptionally strong, driven by my high weighting in US tech stocks. While European indices such as the DAX made rather moderate gains, US stocks dominated the action. My portfolio did extremely well with a whopping gain of over 8 % and clearly outperformed the broad market.
Performance in comparison (01.05.-31.05.2026):
My portfolio: +9,33%
NASDAQ 100: +11,20%
S&P 500: +6,47%
FTSE All-World: +5,93%
DAX: +3,27%
Buying, selling & allocation 💶
In the month of May, € 300.00 flowed into the MSCI ACWI USD (Acc)
$ACWI and € 50.00 in the MSCI World Small Cap
$WSML (-1,33 %). In addition, smaller savings plan tranches were invested in Solaria Energia
$SLR (-2,66 %) (150,30 €), Rheinmetall $RHM (+5,74 %) (14,00 €), Ferrari
$RACE (-0,61 %) (€6.00) and Hermes
$RMS (-11,24 %) (€ 3.01) were invested.
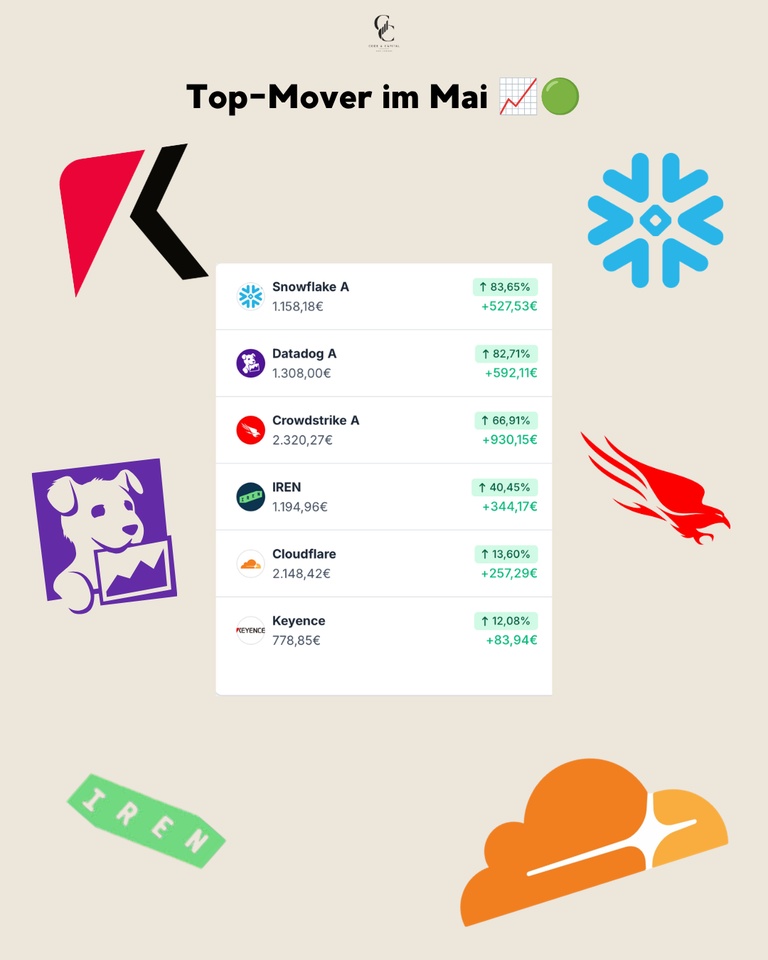
Top movers in May 🟢
The list of winners in May is led by outstanding developments in the cloud and cybersecurity sector - an absolute feast for tech investors.
The absolute frontrunner was $SNOW (+5,06 %) with a veritable price explosion of +83,65% (+€ 527.53), closely followed by $DDOG (+3,4 %) with +82,71% (+592,11 €). Both values showed incredible momentum. Also $CRWD (-1,43 %) was convincing across the board and delivered a strong +66,91% (+€ 930.15), which was the biggest gain in the portfolio in absolute terms. $IREN (-11,51 %) continued its strong trend and recorded a further +40,45% (+344,17 €). The outstanding tech performance was rounded off by $NET (+0,13 %) with a solid +13,60% (+€ 257.29), while Keyence also $6861 (+0,93 %) with +12,08% (+€83.94) also developed extremely positively.
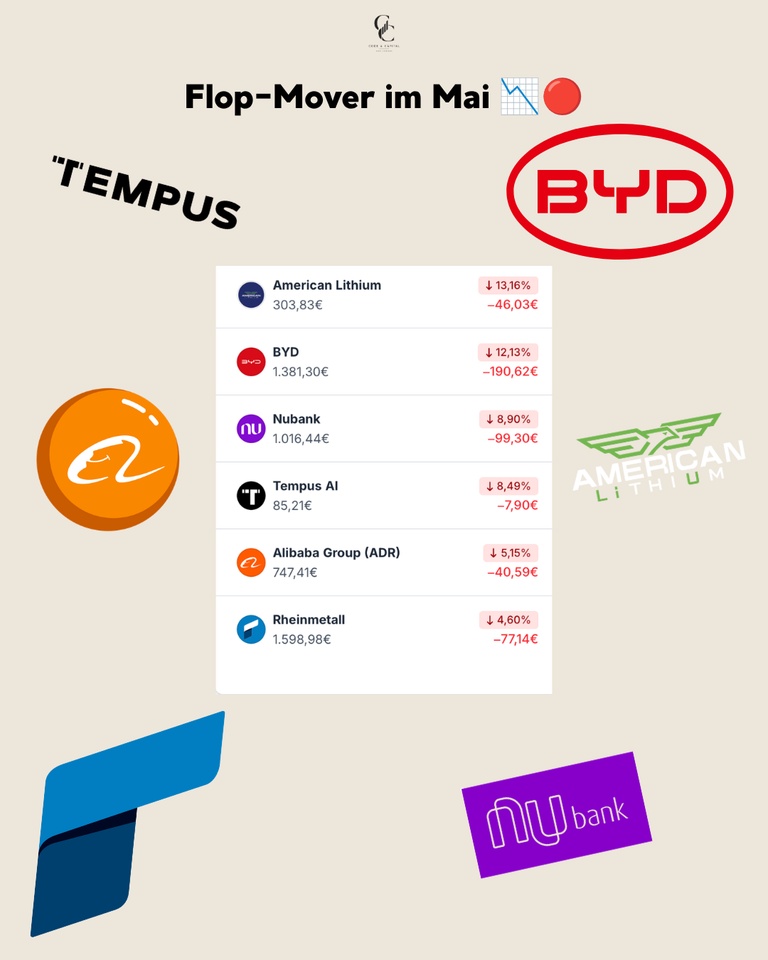
Flop movers in May 🔴
Despite the generally extremely strong sentiment, there were also some stocks that consolidated or showed weakness in May.
American Lithium was the worst performer, falling by -13,16% (-46.03 €), still unable to find a bottom in the current market environment. With $1211 (+2,59 %) the minus of -12,13% (€ -190.62) was due to falling EV sales and the ongoing price war in China. $NU (-3,25 %) After the strong previous months, the share price fell by -8,90% (-99.30 €) after the strong previous months. Also $TEM (-3,68 %) also recorded a slight setback of -8,49% (-7.90 €), similar to $BABA (-0,2 %) with -5,15% (-40,59 €). $RHM (+5,74 %) also lost ground and lost -4,60% (-77.14 €), indicating further profit-taking in the defense sector.
Conclusion 💡
May was an outstanding month that impressively demonstrated how much a targeted positioning in the tech and cloud sector can pay off.
❓ Question for the community
This was my month in numbers, what was your best buy in May? Which stock surprised you the most?
👇 Write it in the comments!
➡️ Follow @codeandcapital for transparent portfolio updates!
🔗 Link in bio: Wikifolio, Getquin & Parqet Portfolio
🗞️ Newsletter: codeandcapitalquant.beehiiv.com
+ 2
1414
6 Commentaires
What makes you feel positive about $RACE, even with the addition of a savings plan?
•
22
•
2Mo·
ETF portfolio additions
Hello everyone,
On the way to the next milestone of EUR 50,000, I have just made two purchases. $WSML (-1,33 %) and $EXI1 (-0,87 %) have been added to the portfolio.
All ETFs are now saved on a monthly basis. I am now quite happy with the composition. Now it's time to save constantly until retirement.
In your opinion, is there a sensible ETF addition for my existing portfolio that does not overlap too much with the existing positions?
I myself have thought about a possible single position $O (+0,13 %) to increase the monthly dividends for the future and because I haven't found an ETF in the real estate sector that really makes sense for me.
Any tips and ideas would be appreciated.
9Positions
46 017,83 €
7,40 %
33
9 Commentaires
Honestly? Please don't buy another ETF. You are well covered. The only consideration would be to consolidate the two dividend ETFs into one ETF. But it doesn't necessarily have to be. Otherwise, good luck!!!
•
44
•
2Mo·
Stagnating portfolio - a question of time or nonsense?
After a long time of active trading and many reallocations, I would like to share my current portfolio transparently with you and deliberately collect feedback / discussions from the community :) (so ready for a qualified roast)
I originally come from the "active" corner with many certificates, warrants and tactical trades - some very successful, some with total losses. Over time, I've realized that although you can land some strong individual hits, the long-term capital allocation and structure of the portfolio is ultimately decisive.
I am therefore currently trying to realign my portfolio:
On the one hand, to continue to take advantage of opportunities for above-average returns, but on the other hand to finally build up a stable ETF/fund base.
My basic assumptions about the market at the moment:
- Many large tech stocks still look ambitiously valued or overheated to me
- In the medium term, I expect rotation rather than a linear "everything continues to rise" trend
That's why my portfolio currently looks a little unusual:
- large positions as a basis in AI & biotech funds, which currently have paused savings plans (due to overheating) ($KJGJC0 (-2,64 %) & $DWWD (-0,73 %) )
- plus turnaround bets such as Nike or Pernod Ricard (many repeat purchases, now a bit of a stomach ache) ($NKE (-0,76 %) / $RI (+1,09 %) )
- Macro/future themes such as copper, rare earths or quantum computing (under construction) ($ARU (+1,83 %) , $COPA (-0,72 %) , $QNTM (-2,31 %) , $WSML (-1,33 %) )
- and occasionally leveraged products and software stocks ($MSFT (+0,31 %) , $SAP (+3,16 %) , $NOW (+5,04 %) , $MC (-1 %) ,...)
My goal now is to build up the whole thing in a cleaner and more structured way and finally set my sights on the 100k.
I have about €2,000 per month available to invest and would like to use it to
- build up a strong ETF/fund base
- but at the same time consciously make individual high-conviction bets
- and significantly scale my portfolio in the long term
What suggestions / recommendations do you have for me with regard to further ETFs or individual positions?
I am also happy to receive critical feedback or counterarguments to my theses. That's exactly why I'm sharing the portfolio here 🙂
22Positions
47 499,69 €
0,81 %
33
1 Commentaire
I'm glad you've now found your strategy.
Why don't you sell your turnaround bets if you have been unsuccessful so far and have bought so much that you have a stomach ache?
If you no longer believe in it, then sell it and shift it to where the money is working for you, for example in an ACWI or FTSE Al World.
Why don't you sell your turnaround bets if you have been unsuccessful so far and have bought so much that you have a stomach ache?
If you no longer believe in it, then sell it and shift it to where the money is working for you, for example in an ACWI or FTSE Al World.
•
11
•
2Mo·
Small regrouping
I sold one of my two defense ETFs today. I had been toying with the idea for a few days and wanted to switch the amount into my small-cap ETF $WSML (-1,33 %) into my small-cap ETF. For me it was a small sector bet and I'm happy with the realized profit. In retrospect, I should have exited earlier, but that's always the case...

99
2Mo·
Restructuring
Hey, I have a question for you: what do you think of my portfolio changes?
I've been on the stock market since January and initially invested in three ETFs ($EIMI (-2,43 %) , $IWDA (-1,11 %) ,$WSML (-1,33 %) ) these positions are now gone. Instead, dividend payers have now been added to the portfolio. Was this a sensible decision (in my opinion there is no right opinion on this subject)?
3Positions
365,24 €
0,41 %
33
21 Commentaires
Before you invest, invest in education. You've already added to your portfolio, you're 18 and actually need growth and not sideways stocks that pay dividends. Instead, put a world ETF in your portfolio and save it until you have enough capital and knowledge to invest in individual stocks.
No investment advice.
No investment advice.
•
1616
•
2Mo·
🔄 Retreat, reset and a depot that lets me sleep peacefully again
Some of you may have noticed:
I was hardly active on getquin for a long time. There was no particular external reason for this; it was more of a conscious step back.
At that time, my portfolio was completely high risk oriented. Lots of bets, lots of hope, lots of emotion. In the meantime, I was also really clearly in the red 📉. Those weren't nice phases and, to be honest, I was more mentally preoccupied than I wanted to admit.
So I withdrew.
Not out of frustration, but to reflect.
✅ Less noise, more conviction
For several weeks, months in fact, I thought hard about my strategy:
- Which risk really suits me?
- Which companies do I believe in for the long term, even if things don't go well for a while?
- How do I create a portfolio that not only has return potential, but also brings mental calm?
The consequence of this:
Today, my portfolio is more clearly structured, broader-based and significantly less risky. Without completely foregoing opportunities.
Yes, Rocket Lab ($RKLB (-6,58 %) ) and Iris Energy ($IREN (-11,51 %) ) are still high-risk investments 🚀. I am fully aware of that.
The difference to before:
I no longer hold them out of greed, but out of genuine conviction in the companies and their future.
ETFs as a foundation
However, the most important change came with the foundation of my portfolio: ETFs.
I deliberately opted for a consistent savings plan to bring me long-term stability and growth:
- iShares Core MSCI World ($IWDA (-1,11 %) ) - 900 € per month
- MSCI World Small Cap ($WSML (-1,33 %) ) - 300 € per month
- Xtrackers MSCI Emerging Markets ($XEMD (-1,99 %) ) - € 387.50 per month
- Global X Copper Miners ETF ($COPX (-0,75 %) ) - € 412.50 per month
This mix feels just right for me at the moment:
global, diversified, future-oriented and yet calm enough not to get emotionally involved in every market movement.
🛌 Performance is coming - sleep is more important
My portfolio is currently performing very, very well.
Of course I hope it stays that way for the time being, but that's no longer the main point.
The biggest difference compared to before is something else:
👉 I can sleep well again.
No constant checking, no panic on red days, no extreme hoping for the next hype.
Instead: Trust in my structure and my decisions.
Lg
Don
7Positions
25 407,78 €
16,85 %
2323
5 Commentaires
It's always good to think and make conscious decisions! Good luck with your new portfolio approach 👍
•
33
•Titres populaires
Meilleurs créateurs cette semaine
Données en temps réel par LSX · Données financières de FactSet