
Nu Holdings
Price
Discussion sur NU
Postes
372



Company Profile: SBI Holdings
Hello, GQ Community,
I'm popping in again after a long hiatus! ✌️ After quite some time, I'm back today with another company spotlight.
While it feels like half the community is $SOFI (-1,83 %) or $NU (-1,88 %) the quintessential FinTech company, today I’d like to draw your attention to another absolute heavyweight in the industry. This time, though, we’re traveling to the Land of the Rising Sun! Today, we’re heading to Japan! 🇯🇵
Because what many people don’t even realize is this: While the U.S. and Latin America are celebrating the FinTech hype, a massive capital market revolution is currently underway in Japan—and right at the center of it all is a digital champion that dominates the entire ecosystem.
🏛️ SBI Holdings, Inc. $8473 (-3,23 %) : The Japanese financial and FinTech empire of the NISA revolution
While traditional Japanese megabanks (such as MUFG $8306 (-1,24 %) or Sumitomo Mitsui $8053 (-3,48 %) ) are weighed down by heavy operational baggage from the branch-based era, founder Yoshitaka Kitao has created Japan’s leading digital financial mega-conglomerate with SBI Holdings $8473 (-3,23 %) , Inc., has created Japan’s leading digital financial mega-conglomerate. SBI occupies the most attractive future-oriented sectors of the Japanese capital market: online brokerage (No. 1 in Japan), commercial and digital banks (including SBI Shinsei Bank and SumiShin Net Bank), asset management, venture capital/private equity, as well as crypto-assets and blockchain infrastructure.
With the launch of the new, government-subsidized, tax-free NISA investment system (Nippon Individual Savings Account), Japan is experiencing a historic shift from savings accounts to stocks and ETFs. SBI is the primary beneficiary and infrastructure leader of this movement. On the Tokyo Stock Exchange (TSE), the stock is trading at around 2,925 JPY in October 2026.
1. The Business Model: Japan’s All-in-One FinTech Flywheel ⚙️🇯🇵💳
SBI $8473 (-3,23 %) operates a diversified, highly scalable ecosystem with strong synergies between banking, trading, and investment:
① Online Brokerage & Trading Market Leadership: SBI Securities is by far Japan’s largest online broker. To completely dominate the competition, SBI pioneered the zero-commission model for domestic stocks (“Zero Option”). SBI offsets this through margin trading, foreign exchange transactions, mutual fund management, and integration with its own banking division.
② Banking Powerhouse (SBI Shinsei Bank & SumiShin): Through the full acquisition of Shinsei Bank and strategic partnerships (including the sale of SumiShin shares to NTT DOCOMO to tap into millions of mobile phone customers), SBI combines $8473 (-3,23 %) extremely low-cost retail customer deposits with high-margin corporate and consumer lending business.
③ Asset Management, Private Equity & Crypto: SBI $8473 (-3,23 %) manages massive VC funds in the global fintech, AI, and tech sectors. In addition, the group operates its own crypto exchanges (SBI VC Trade) and maintains a closely intertwined, long-standing partnership with Ripple (XRP) for cross-border payment networks.
2. The Technology: AI Transformation, Zero-Fee APIs & Web3 Pioneer 🧪📊
SBI’s unique technological selling point is based on maximum customer traffic and technological scalability:
AI-First Financial Group: SBI is the first Japanese financial conglomerate to undertake a comprehensive AI transformation in partnership with Anthropic and Ridge-i to roll out automated financial AI agents in customer service and risk management.
Embedded Banking & Sweep Accounts: Through innovations such as SBI Hyper Deposit, SBI seamlessly links brokerage accounts to the bank’s balance sheet. Funds flow back and forth fully automatically and earn interest, which significantly strengthens deposit retention among retail customers.
Web3 & Crypto Infrastructure: While European TradFi banks are shying away from digital assets, SBI is expanding regulated custody, trading, and remittance solutions for institutional and retail customers in the Asian region.
3. Key Figures 📊
Stock Exchange Listing: Listed on the Tokyo Stock Exchange (Prime Market) under the ticker $8473 (-3,23 %)
Current price: ~2,925 JPY.
Market capitalization: ~1.93 trillion JPY (~12.5 billion USD / EUR).
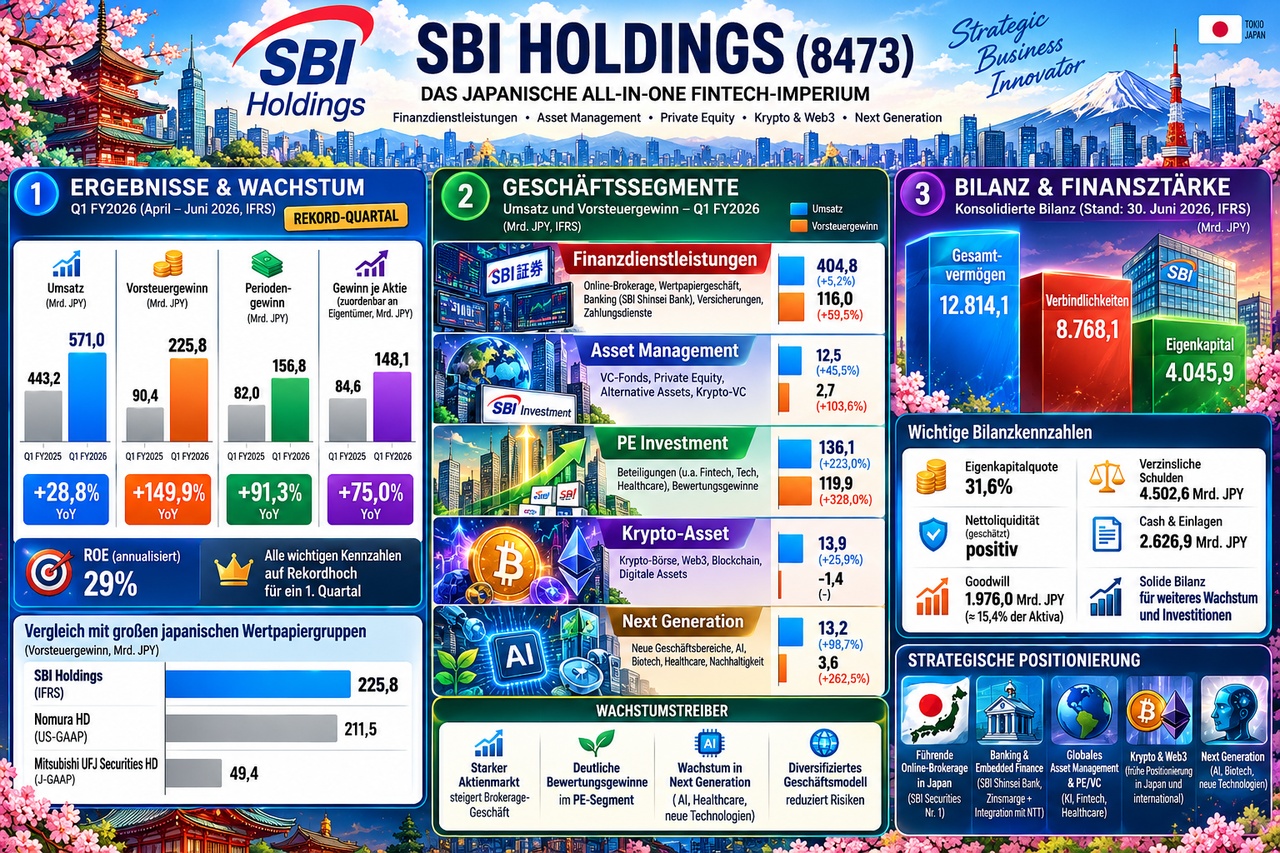
Earnings Surge (Q1 FY26): SBI posted record results in the first quarter of FY2026: Pre-tax profit rose by +149.9% year-over-year to 225.8 billion JPY. Net income climbed by +75.0% YoY to 148.1 billion JPY.
Profitability (ROE): The annualized ROE in this record quarter was >24–29% (the bank’s medium-term target is >15%).
Dividend: Solid dividend policy. Expected dividend yield of ~3.2% to 3.5% (target for FY2026 is ≥ 95–170 JPY per share; interim dividend raised).
Appears extremely undervalued: Trailing P/E ratio ranging from an extremely low ~3.95x to 4.2x. The price-to-book (P/B) ratio is at a favorable ~0.85x to 0.9x (substantial conglomerate discount).
4. Why is this stock particularly exciting right now? 🚀
1. The NISA megatrend in Japan
Through the reformed NISA program, the Japanese government is effectively forcing savers to move their money—which is sitting idle in checking accounts—into the stock market. SBI is securing the lion’s share of these new accounts and AUM.
2. Profit surges driven by one-time gains & consolidation
Sales of SumiShin shares to NTT DOCOMO (approx. 142.4 billion JPY in extraordinary gains over the course of the year), as well as deconsolidation and restructuring gains in the banking sector, are bolstering the balance sheets and generating capital for share buybacks.
3. Bank of Japan (BoJ) Interest Rate Shift
After decades of negative interest rates, SBI Shinsei Bank’s massive deposit business is benefiting significantly from rising net interest margins on corporate loans and mortgages.
5. Competition & Moat ♟️
The Environment:
Traditional brokers (Nomura Holdings $8604 (-0,54 %) , Daiwa): They have high branch costs and are lagging behind in modern, commission-free online trading. SBI $8473 (-3,23 %) has already surpassed Nomura $8604 (-0,54 %) in quarterly pre-tax profit.
Online rivals (Rakuten Securities, Monex): Rakuten $5838 (-2,34 %) is a strong competitor but suffers from the financial problems of its parent company, Rakuten $4755 (+1,55 %) (mobile communications division).
SBI’s competitive moats at a glance:
Network & Economies of Scale (Scale Moat): Over 12–13 million brokerage account holders generate economies of scale that allow SBI to set commissions to zero and erode competitors’ margins.
Financial Ecosystem (Cross-Selling): The integration of brokerage, bank accounts, credit cards, and a crypto exchange under one roof ensures extremely low customer acquisition costs (CAC).
6. Additional Insider Facts💡
Japanese Governance Reform: The Tokyo Stock Exchange is putting pressure on companies trading below their book value (P/B < 1.0x). SBI is responding with more aggressive payouts, dividend increases, and strategies to reduce the holding discount.
The Mynavi & Kyobo Asset: Through strategic investments (such as in the Korean insurer Kyobo Life or Mynavi), SBI is systematically building recurring equity-method income in the triple-digit millions.
7. Risks ⚠️
Equity Gain Volatility (Fair Value Accounting): As a holding company, SBI accounts for its massive private equity and VC portfolio at fair value under IFRS. A weak tech or IPO market immediately has a negative impact on net income for the period. ❗️
Cyclical Dependence on Trading Volumes: In bear markets, trading fees and margin loans plummet. ❗️
Crypto & Regulatory Exposure: Activities in the crypto sector (Ripple/XRP) carry a higher regulatory risk and risk of negative media coverage compared to traditional banks. ❗️
8. Conclusion
SBI Holdings is a highly dynamic FinTech and banking empire that appears to be valued at a bargain and is leading the digital transformation of Japan’s financial sector. Despite highly volatile VC results, the company offers substantial rebound and re-rating potential driven by the NISA boom and rising interest rates in Japan.
Should the global tech sector collapse and SBI’s VC investments lose massive value, while at the same time the Japanese stock market stagnates following the NISA hype, the P/E ratio of ~4x could remain a value trap. The market often punishes complex holding structures with crypto exposure for a long time during crises.
@Get_Rich_or_Die_Tryin
@Tenbagger-Capital
@Dividendenopi
@Raketentoni
@schlimmschlimm
@PikaPika0105
@Multibagger
@Stocktective And, of course, everyone else ✌️



+ 1

Considering that MUFG and SMFG are saddled with “significant legacy burdens,” their operations are actually going pretty well 😂
Rakuten Securities is actually being held back by its parent company, but Rakuten Bank—which is affected by this—could potentially become more independent in the future (Rakuten currently holds just under 50%).
I think a very relevant competitor you didn’t mention is PayPay. PayPay is a payment platform used by over 70 million Japanese people. The company is part of the SoftBank empire. They also already operate a brokerage firm, though it isn’t that big yet. Nevertheless, PayPay is constantly expanding its banking services and has enormous potential thanks to its massive customer base and powerful owners. SoftBank also operates the country’s third-largest telecommunications group and owns the messaging service LINE, which everyone in the country uses. So, if they want to, they can reach almost every Japanese person. In my opinion, that would be one of the main risks for SBI right now.
But of course, that only applies to the retail business itself. All other financial services behind the scenes (e.g., APIs, VC, etc.) remain attractive, of course. They will certainly continue to perform well. However, the further the NISA program progresses, the fiercer the competition will become in certain areas.
Comparison Series, Part 3: Lumentum and Applied Optoelectronics—Who Profits from Artificial Intelligence Data Traffic?
Following PepsiCo $PEP (+1,38 %) versus McDonald’s $MCD (+0,02 %) and Nu $NU (-1,88 %) versus SoFi $SOFI (-1,83 %) , today we’re taking a look at two companies without whose technology a lot of data in data centers would be stuck in a traffic jam for quite a while.
Today we have our first requested comparison of @Tenbagger-Capital
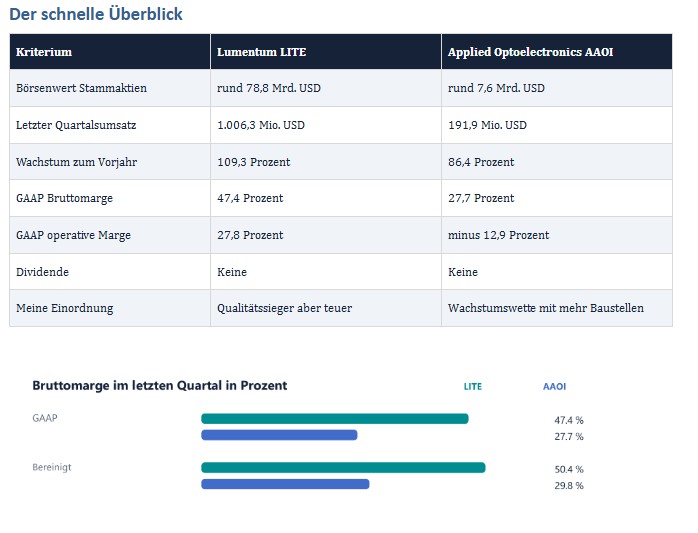
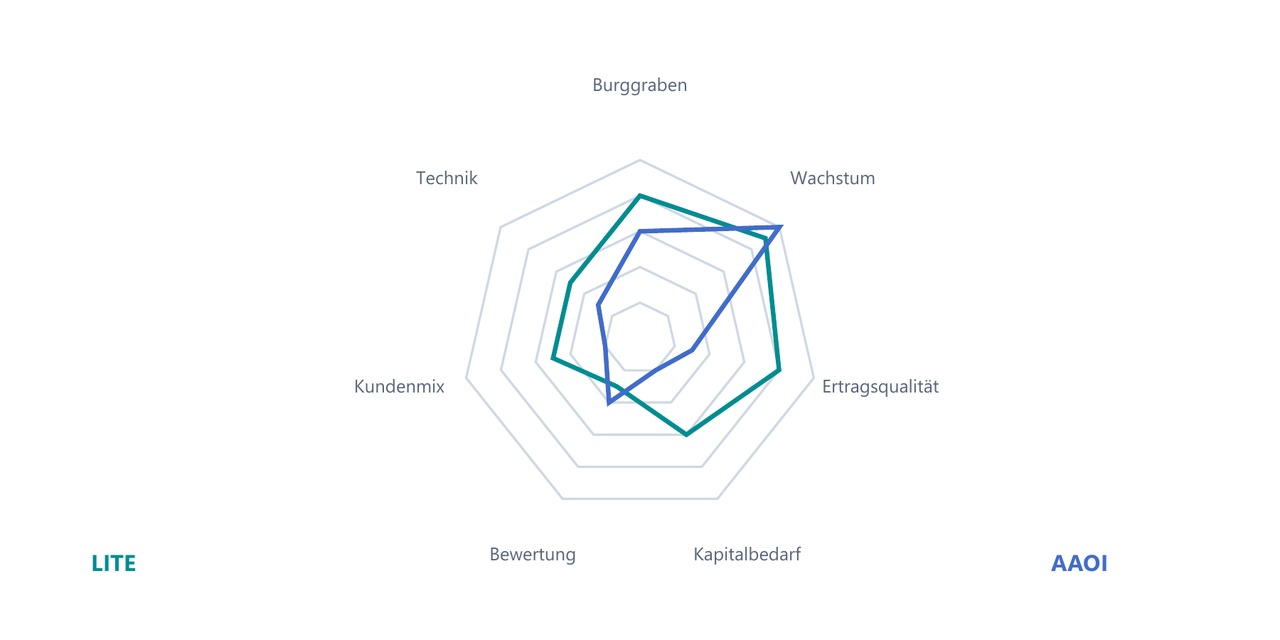
Lumentum $LITE (-5,35 %) and Applied Optoelectronics $AAOI (-6,71 %) both supply optical components for faster connections. Both are benefiting from the expansion of AI.
Nevertheless, they differ significantly in how much of that is already trickling down to shareholders today.
If you have a request for a comparison, feel free to write it in the comments—just one condition: both companies should be from the same sector and, ideally, be competitors :)
Quick note: As of October 16, 2026. Common price basis (U.S. close on October 15): Lumentum $869.54, AAOI $83.73. General comparison independent of any personal portfolio strategy. All scenarios are based on my own assumptions; these are not guaranteed price targets.
How the Companies Came to Be
Lumentum was formed in 2015 through a spin-off from JDS Uniphase. Over the years, other specialists joined the company, including Oclaro, NeoPhotonics, and Cloud Light. Today, its product portfolio includes laser chips, optical components, modules, and optical switches. This gives the company multiple opportunities to profit from the expansion of data communications.
AAOI was founded in Houston as early as 1997 and has been listed on the Nasdaq since 2013. The company produces optical transmitter and receiver modules and manufactures its own lasers. It also supplies cable network operators through its CATV business. In the last quarter, approximately 42 percent of revenue came from this segment. AAOI is therefore more than just an AI play, even though the market is currently paying particular attention to high-speed data center modules.
What I Like Better About Lumentum
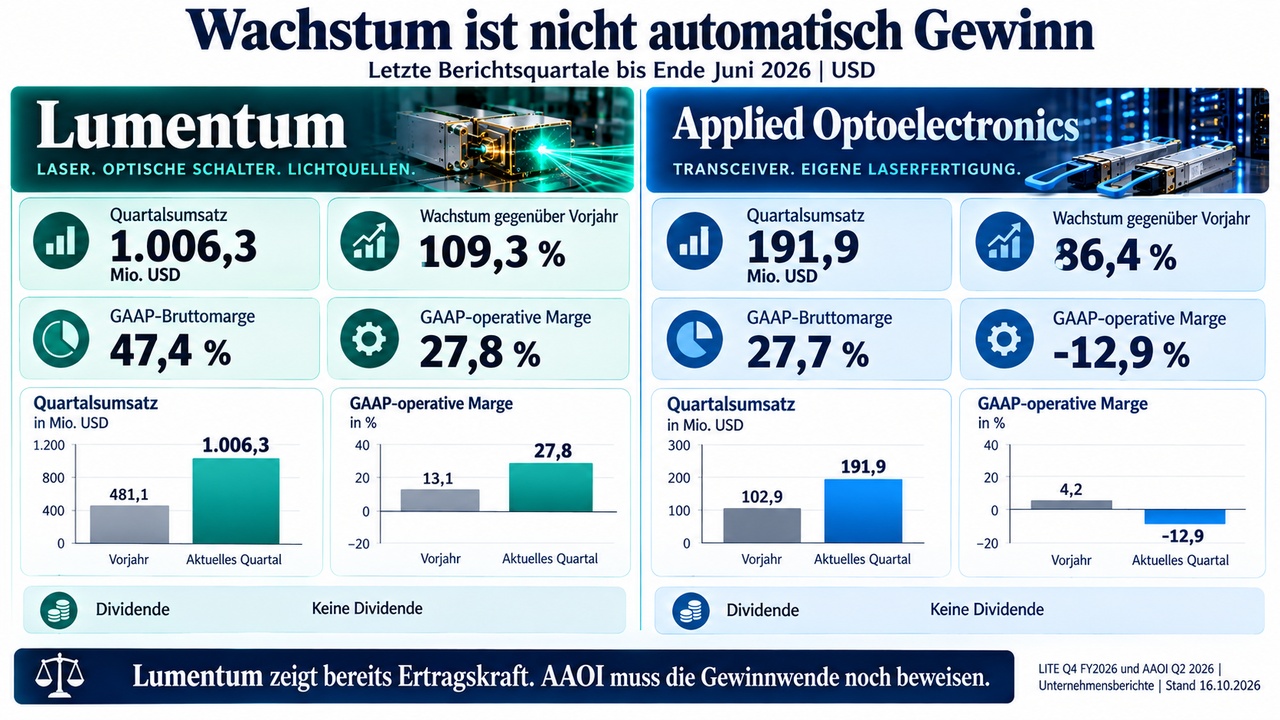
Lumentum has already demonstrated that high demand translates into strong operating profits. With quarterly revenue exceeding $1 billion, the GAAP operating margin stood at 27.8 percent. AAOI is also growing strongly but is still posting operating losses.
For me, that’s the most important difference: With Lumentum, I don’t have to pin my hopes as much on a turnaround in profitability that has yet to materialize.
Added to this is the broader technical portfolio. If the design of a data center changes, Lumentum can remain involved through specialized lasers, external light sources, or optical switches, for example.
AAOI also has an advantage with its own laser production. However, its financial success currently depends more heavily on ramping up new transceiver capacity quickly and with reasonable margins.
Lumentum’s massive reported annual loss warrants an explanation.
It was primarily caused by a non-cash charge resulting from the conversion of convertible bonds. This was not a billion-dollar outflow from day-to-day operations.
The transaction is nonetheless relevant to shareholders because it alters the capital structure and dilutes equity. Simply dismissing it as a “one-time item—no big deal” would be too convenient for me.
What’s particularly exciting about AAOI
is that AAOI is starting from a significantly smaller base.
If the expansion for 800G and 1.6T modules succeeds, the company can grow at a higher rate than its larger competitor. In-house lasers can further improve costs and delivery capabilities.
In a best-case scenario, this would provide significant revenue and margin leverage. That’s where AAOI could very well come out on top in this head-to-head competition.
I wouldn’t, therefore, label AAOI as a bad company.
The question is how much of the future capacity will be used profitably and how many additional shares will be issued by then. After all, capacity listed on a presentation slide doesn’t pay the bills.
Especially with an expansion like this, one must distinguish between revenue growth and earnings per share growth.
Where Lumentum still doesn’t convince me
The company is good, but the market has known that for a long time. A market capitalization of nearly $79 billion contrasts with about $300 million in free cash flow from the last fiscal year.
Of course, this cash flow is expected to grow significantly. Nevertheless, the gap shows just how much of the future is already being priced in today. Even a good company can disappoint on the stock market if it delivers only “very good” results rather than “sensational” ones.
Added to this are new factories, bottlenecks, and a growing share of large customers.
The largest disclosed end customer most recently accounted for 26.6 percent of annual revenue, compared to 15.4 percent in the previous year. Long-term capacity utilization forecasts are positive. However, they are no substitute for addressing the question of how binding orders actually are and what prices will ultimately be achieved.
What makes me significantly more cautious about AAOI
The expansion is initially a cash drain. In the first half of the year, operating cash outflow totaled around $74 million.
Together with plant and equipment, advance payments for equipment, and land purchases—according to this broad definition of investment—approximately $707 million was spent. Part of this is intended to generate revenue later on. For now, however, it represents a real financing need.
The capital increase completed on October 5 raised a net total of approximately $588 million and improves the company’s financial flexibility. At the same time, about 5.7 million new shares were issued.
Both of the following are true: The financing situation has improved, and the existing shareholders’ stake has decreased. Whether another capital raise will be necessary depends primarily on the actual expansion costs and future cash inflows.
A completed program is no guarantee that another one will never follow.
The customer base is particularly important to me.
Three customers accounted for a combined 92 percent of revenue. In addition, approximately 67 percent of receivables were attributable to Digicomm, a distributor in the cable network business. This isn’t automatically a payment issue, but it is a significant concentration. A distributor can serve many end customers and still remain a single major payer for the manufacturer.
AI helps both, but the technology may change
Both companies benefit from the fact that data centers need to process more data. The risk isn’t so much that AI will replace the laser. What’s more intriguing is whether new architectures will shift the value chain.
As optical connections move closer to the chips, the requirements for traditional pluggable modules will change.
At Lumentum, , I like that lasers and external light sources can still be used even in new architectures.
AAOI also has opportunities through its laser manufacturing, but it must first translate this into lucrative products on a larger scale. Lumentum’s recent demonstration with Astera Labs and Corning is interesting. However, a demonstration does not yet equate to mass-production business with a steady profit contribution.
I wouldn’t factor in an allegedly certain tailwind from an immediate ban on Chinese transceivers for any stock. There are political initiatives and reports about potential FCC rules.
However, the reviewed official Senate bill pertains to specific procurements and includes long transition periods. I do not view this as a guaranteed source of additional revenue.
What I expect for the coming years
For Lumentum, in my base case scenario, I expect continued strong growth and a healthy operating margin, but also high capital expenditures and increased competition down the road.
The company has the potential to grow significantly larger. I simply don’t expect today’s scarcity-driven prices and exceptional growth rates to last forever.
With AAOI, I see the potential for a bigger leap, but also a wider range of possible outcomes. In the best-case scenario, new capacity comes online smoothly, 1.6T gains traction, and higher revenue translates into higher earnings per share. In the worst-case scenario, new facilities come online too late, capacity utilization lags behind, or additional capital requirements dilute returns for existing shareholders. Here, the path to profit is at least as important as the potential target.
My conservative cash flow model currently yields, in the base case, around $365 for Lumentum and $44 for AAOI.
For both companies, this is below the current market price.
That doesn’t mean the market has to fall to those levels tomorrow. It means that a great deal of growth is already priced in, and my conservative scenario does not offer a clear margin of safety.
The range is wide: In the bear case, my model puts Lumentum at about $96.
The extreme AAOI stress case comes in at less than one dollar, because expansion costs, combined with too-low future margins, would virtually erode the entire shareholder value.
This is not a prediction of insolvency. In the bull case, the figures come to approximately $1,170 and $169, respectively.
This scenario assumes exceptionally successful expansion and high future margins. Such possibilities are appealing, but I wouldn’t present them as the standard outcome.
A potential entry point does not constitute an obligation to buy
On the chart, Lumentum is relatively stronger. The price is still above the long-term daily moving average but has broken below the shorter-term trend line.
AAOI is trading below both the 50-day and 200-day moving averages.
For both, I don’t see a confirmed bottom at the moment. A red chart doesn’t turn green just because the stock was more expensive last week.
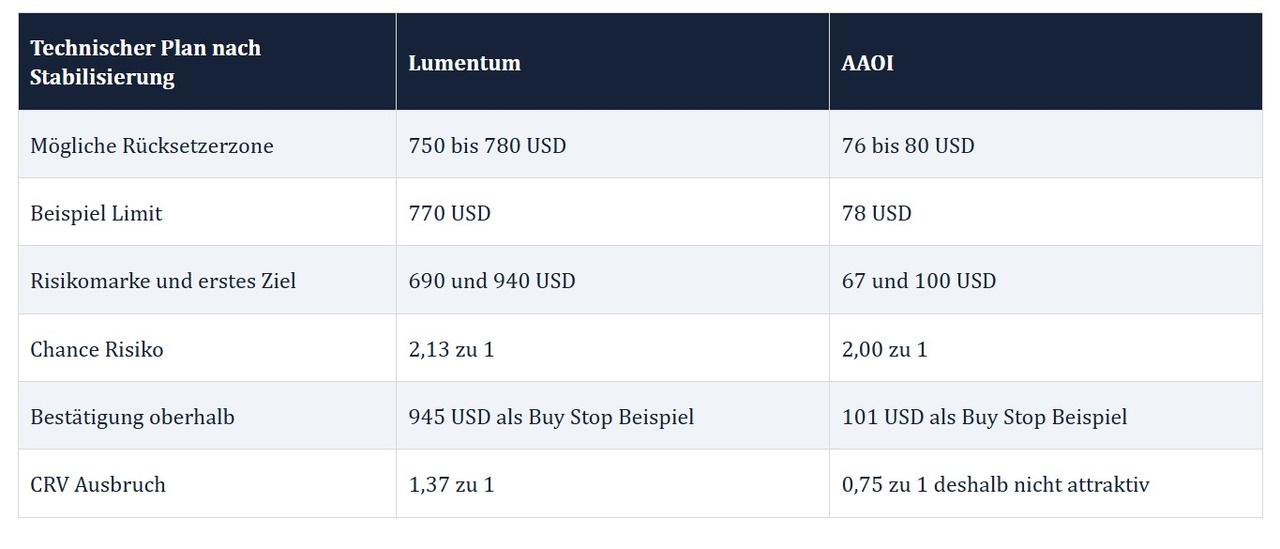
These levels are trading plans in case of stabilization; they are not a call to place blind orders immediately. In a pullback trade, I would assess the first target zones to determine whether to reduce my position or let the recovery continue. For a long-term investment, I would additionally require a reasonable valuation and stronger operational evidence.
A technical stop may be executed significantly worse in the event of a price gap.
A normal buy stop does not wait for a confirmed closing price.
Anyone who wants this confirmation will have to reassess the situation afterward. Limit orders and breakout orders are alternative approaches; an entry OCO order is only an option if the broker supports this order type. The upcoming earnings report on November 5, in particular, could lead to significant price swings.
My conclusion on this showdown
If I were to choose, independently of any portfolio strategy, I’d have to choose one of the two companies , it would be Lumentum.
Its operational profitability, broader product portfolio, and stronger cash flow base convince me more.
If AAOI successfully expands, it could offer greater upside potential.
However, this requires putting up with significantly more uncertainty regarding margins, financing, and customer dependence.
For an entry today, my verdict on both is: wait a little longer.
Lumentum remains my preferred stock to watch.
With AAOI, before making a long-term purchase, I’d first like to see not only new factories and new shares being added, but also a sustainable increase in free cash flow per share.
The AI boom is interesting enough on its own. I don’t need to chase every valuation associated with it.
The strongest counterargument to my caution is a prolonged shortage leading to much higher future profits.
In that case, the market could be right, and my conservative estimate might be too low. That’s exactly why I’m looking forward to both companies’ next earnings reports on November 5. Solid new evidence would change my assessment; another high analyst target alone wouldn’t be enough.
What do you think: would you rather go with Lumentum’s already proven earnings power or the bigger catch-up bet on AAOI?
Feel free to share your arguments in the comments, along with two other stocks for an upcoming showdown.
Ideally, they should be from the same sector and have comparable business models.
Constructive counterarguments are expressly welcome.
Greetings from Denmark
Raketentoni
Sources:
S1 Lumentum Q4 and FY2026 Earnings Report, August 11
S2 Lumentum FY2026 Annual Report, including Form 10-K
S3 AAOI Q2 2026 Results and GAAP-to-Non-GAAP Reconciliation
S4 AAOI Form 10-Q as of June 30, 2026
S5 AAOI 2025 Annual Report (Form 10-K)
S6 AAOI Completion of Capital Increase, October 5
S7 NVIDIA Strategic Partnership with Lumentum, March 2
S8 Lumentum, Astera Labs, and Corning OCP Demonstration, October 12
S9 U.S. Senate Bill S 5548 Introduced, September 24
S10 Lumentum Stock Price and Valuation Data
S11 AAOI Stock Price and Valuation Data
S15 Lumentum Investor Relations Calendar
S16 AAOI Investor Relations Calendar
S17 AAOI Company History
and, of course, all the others :)
+ 3

Right now, though, I wouldn't jump into either one. I don't think we're done with the setbacks yet.

Since none of the candidates received an absolute majority, the winner will be decided in a runoff election on October 25, 2026.
Focus Online:
The situation heading into the runoff: Reports indicate that Flávio Bolsonaro, following his strong showing in the first round, enters the runoff as the slight favorite. Bolsonaro’s camp interprets the result as a clear vote for political change and a rejection of the Workers’ Party’s (PT) policies.
Crime as a central campaign issue: The focus is on domestic security. While Flávio Bolsonaro, following El Salvador’s example, advocates a hardline approach, mass arrests, and a massive expansion of prison capacity, Lula is pursuing a strategy focused on dismantling money laundering and the financial networks of organized crime.
Stern / t-online / ntv:
The role of the Bolsonaro clan: German observers highlight how the Bolsonaro family was able to consolidate its political power base despite the legal ban and the imprisonment of patriarch Jair Bolsonaro. Flávio Bolsonaro stepped in as the political heir and rallied the conservative, evangelical, and agrarian electorate solidly behind him.
Polarization and Wear and Tear: Reports describe a highly polarized “election thriller” driven largely by mutual rejection and accusations of corruption and legal feuds.
Manager Magazin / Wirtschaftsfokus:
Market Reactions and Investor Concerns: From an economic perspective, the neck-and-neck race is viewed as a source of uncertainty for emerging-market investors, the real exchange rate, and the benchmark indices on the São Paulo Stock Exchange.
Economic Policy Contrasts: Lula’s platform (greater government investment, expansion of social programs, and a focus on climate protection and the rainforest) stands in contrast to Bolsonaro’s economically liberal agenda, which promises privatization, the elimination of ministries, and strict budgetary discipline.
Brazil has voted
The ETF follows suit.
Impact on the Stock Market
Experience shows that the reaction of the financial markets (particularly the benchmark Ibovespa index) and the local currency (the real) to Brazilian elections depends on several key factors:
Composition of the National Congress: For investors and bond markets, the congressional election is often just as crucial as the presidency. A fragmented parliament or a strong counterweight in Congress (such as the conservative centrist parties of the so-called Centrão) is often perceived by the markets as a check that makes it more difficult to pursue more radical economic policies unilaterally.
Fiscal policy and budget discipline: The biggest source of uncertainty for investors is Brazil’s national debt and compliance with budget rules. Signs of spending discipline and tax reforms usually lead to relief in the markets and a stronger real, while fears of expansive spending cause risk premiums to rise.
Monetary policy and interest rate trends: Since the Brazilian central bank (Banco Central do Brasil) responds to inflation and currency risks with high interest rates, the stock markets are particularly pricing in how the election results will affect future monetary policy and, consequently, the borrowing and investment costs for Brazilian companies.
Sectoral Reactions: State-affiliated companies (such as $PETR3 (+4,41 %) or $BBAS14 do Brasil) generally react most strongly to changes in government, while commodity- and export-oriented companies (e.g., mining and agriculture) are more heavily influenced by global demand and exchange rates
.


On the one hand, Lula’s party has been in power for about 16 of the last 20 years and, while it has improved social indicators, it has done so at the cost of enormous spending and tax increases. The result is a record number of families in debt, as well as companies that are insolvent or undergoing restructuring.
On the other hand, there’s Bolsonaro’s party, which only recently attempted a coup.

Well, that's it for now
I've closed my position in $NU (-1,88 %) I’ve closed my position for now. If it heads back toward 10–12, I’ll gladly jump back in. A short holding period, but a decent profit.

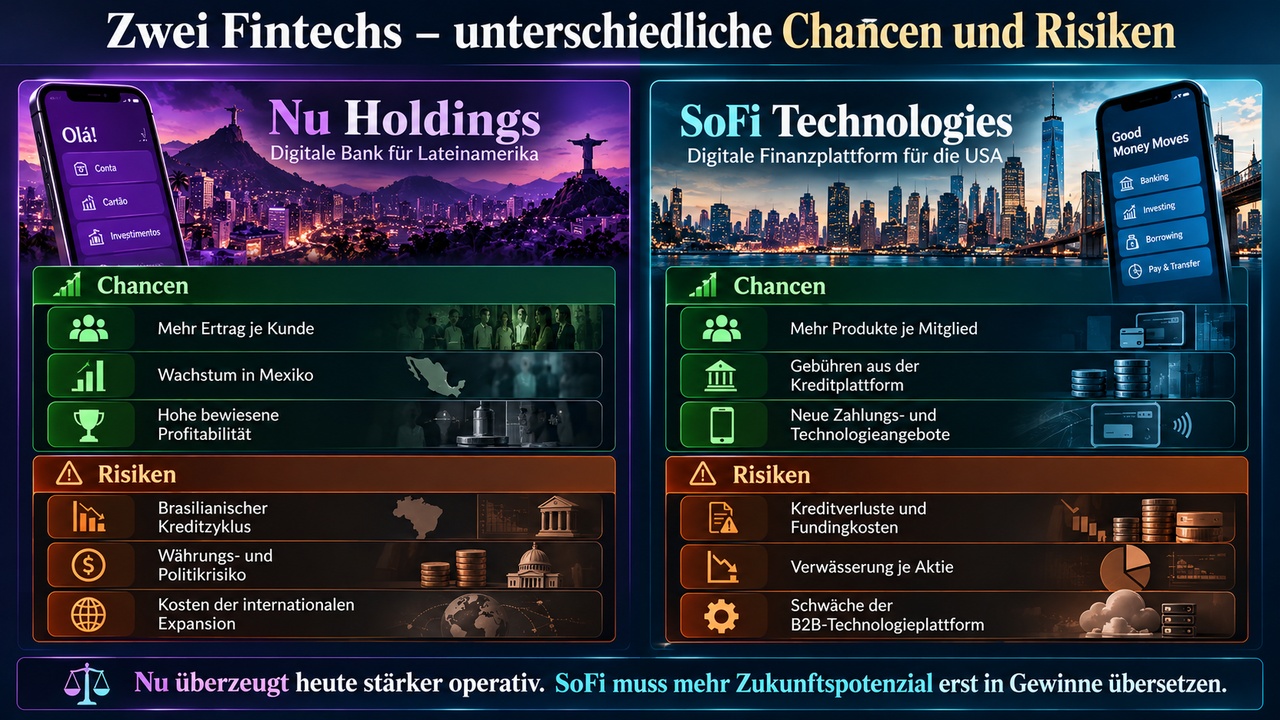
Part 2 of the series: FinTechs Without Branches—Stocks with Potential? Nu vs. SoFi
Following PepsiCo $PEP (+1,38 %) versus McDonald’s $MCD (+0,02 %) , our comparison series continues today—this time with two fintech companies:
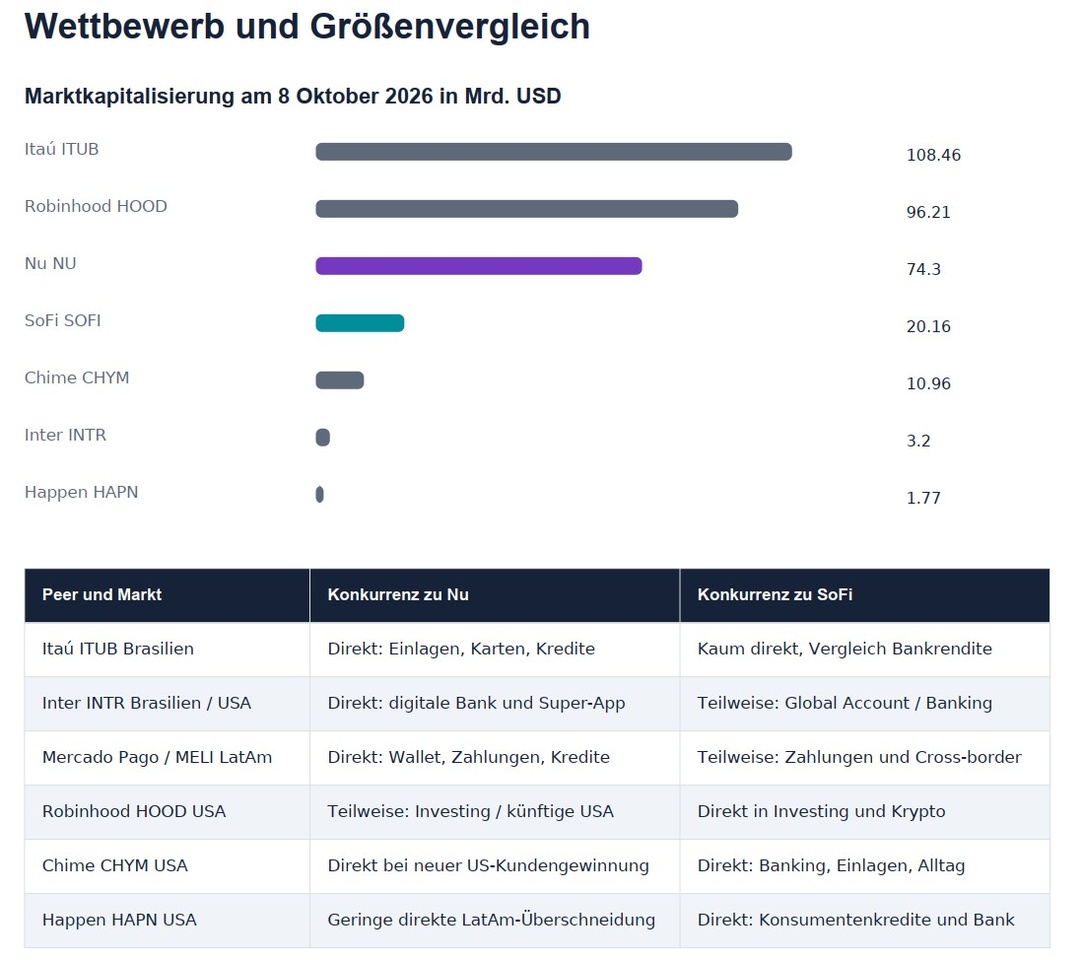
Nu Holdings $NU (-1,88 %) and SoFi Technologies $SOFI (-1,83 %) .
Since we’re also invested in U.S. stocks, we’ll take a closer look at these two U.S.-listed companies.
Nubank was founded in Brazil in 2013 with the goal of making banking simpler and more affordable. SoFi was founded in 2011 in the Stanford University community and started out offering student loans.
Today, both companies offer a much wider range of financial services.
We’ll compare which stock performs better in terms of quality, valuation, opportunities, and risks.
Do you have any requests for future comparisons?
Feel free to suggest two stocks in the comments.
The only requirement: They should be from the same sector and, ideally, be direct competitors.
First things first: if I had to decide today, my choice would be Nu Holdings. Why?
Its established profitability, large active customer base, and
scale in Latin America are more compelling.
SoFi offers interesting U.S. banking, lending platform, and
payment options, but has earned significantly less on its capital so far. A nearly identical stock price does not imply comparable enterprise value.
Nu Holdings and the Quality of Its Earnings
How a large customer base becomes a profitable bank
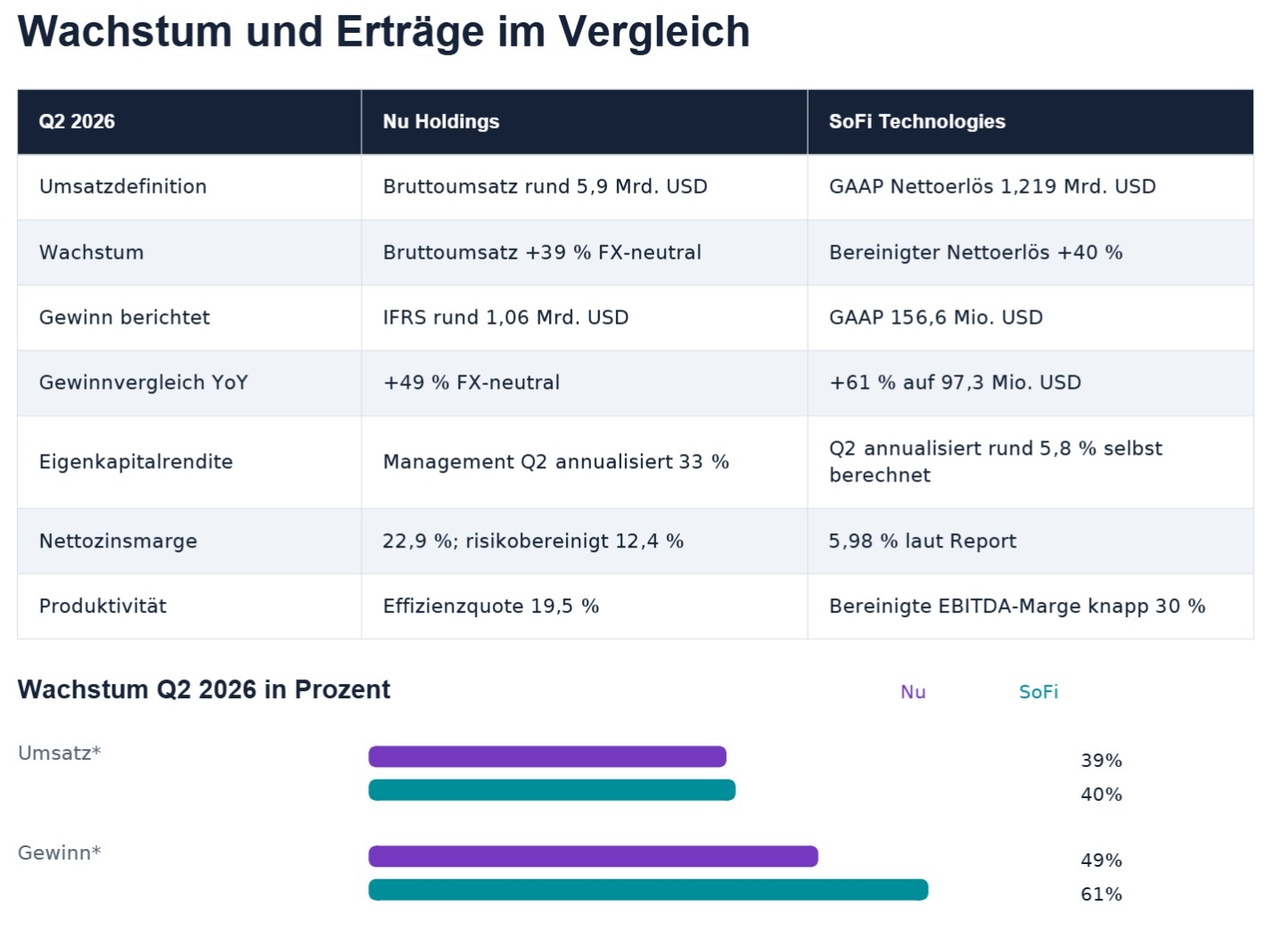
Nu posted a profit of approximately $1.06 billion in the second quarter. This figure is particularly impressive because it comes with a return on equity (ROE) of 33% and an efficiency ratio of 19.5% . ROE, or return on equity, measures profit relative to equity invested.
The efficiency ratio here describes expenses relative to the revenue base. Together, these metrics show how much revenue remains after operating expenses.
The company’s financial strength stems from low customer service costs and deeper customer relationships. A customer who consolidates their income, payment transactions, and multiple products with the same bank generates additional revenue and provides more information for credit decisions.
New offerings can then be sold within an existing relationship. Therefore, what matters is not just the number of customers, but whether activity, revenue per customer, and credit quality are all increasing together.
It is precisely this combination that makes Nu the top performer in this comparison.
The company does not need to base its appeal solely on future U.S. business. Its current core markets already provide a substantial profit base.
For valuation purposes, however, this also means that part of this advantage is already reflected in the high premium over book value. Strong financial results do not allow for an arbitrary entry price.
High returns also carry credit risk
The risk-adjusted net interest margin reached 12.4%. Put simply, it represents net interest income after accounting for credit costs. At the same time, the ratio of loans more than 90 days past due rose to 6.9%. Earlier stages of delinquency showed a more favorable trend. The figures therefore indicate neither a green light nor a confirmed credit default.
More unsecured loans can generate higher interest income and profits, but they also increase sensitivity to weaker income. At a growing bank, defaults on new loans often appear less serious at first because new loans do not reveal their losses until later.
That is why loan cohorts are important:
Loans from the same origination period are monitored over time, rather than simply comparing the average of the entire growing portfolio.
I would only consider the high margin sustainable if more mature loan cohorts also remain stable.
The counter-scenario to today’s quality assessment is a credit cycle in which higher losses erode part of the interest yield. Mexico and the U.S. offer additional opportunities, but should not mask this risk.
In our assessment, U.S. expansion is an option, not a necessary justification for the company’s overall value.
SoFi and the Path to Higher Returns on Capital
Strong growth alone is not yet enough for the quality premium
SoFi reported $156.6 million in GAAP net income and an adjusted EBITDA margin of just under 30%. Among other things, EBITDA excludes certain expenses from the operating picture; for a bank, it replaces neither shareholder returns nor return on equity. My Q2 ROE, calculated from quarterly net income and average shareholders’ equity, Q2 ROE, calculated based on quarterly profit and average equity, is approximately 5.8% on an annualized basis.
The long-term profitability target has thus not yet been achieved.
The Group is expanding several offerings simultaneously. In the long term, this can increase customer loyalty and revenue per member. In the short term, however, this incurs development, sales, and start-up costs.
The unchanged EBITDA forecast despite a higher revenue outlook shows that not every additional dollar of revenue immediately benefits shareholders. Furthermore, a higher absolute profit may grow at a slower rate due to a larger number of shares outstanding.
In my view, SoFi deserves a growth valuation, but not yet an unconditional quality premium.
A stronger case for buying will emerge if additional products actually deliver more recurring earnings per share. This comparison is therefore not a bet on whether SoFi can grow. The crucial question ishow profitable this growth will be for existing shareholders.
The lending platform and technology must each prove their worth separately
The Loan Platform business generated approximately $143 million in adjusted net revenue in Q2. It facilitates loans for partners and generates fees without having to permanently carry every brokered loan on its own balance sheet.
This is a sensible approach to achieving growth with less capital tied up.
The technology platform, on the other hand, generated only $84.5 million in revenue and shrank by 23% year-over-year.
Less balance-sheet exposure does not mean independence from the credit cycle. Partners must still be willing to purchase or finance loans. If loss assumptions worsen or yield requirements rise, their demand may decline.
Different metrics apply to the technology platform: customer retention, new contracts,
revenue growth, and margins. A new card partnership could improve this trend, but it alone does not prove a successful recovery for the entire segment.
The positive counterexample is: SoFi increases profitable multi-use, wins new B2B customers, and boosts its return on equity over several years.
Then today’s book value premium may prove to be a bargain.
If the yield remains low or the number of shares grows too quickly, the seemingly low book value multiple is of little help. That’s why I would place greater weight on the earnings confirmation more weight than a mere decline in the stock price.
For banks, deposits are a source of funding and loans are operating assets. The generic negative FCF figures in the reports are therefore not suitable as direct indicators of insolvency or cash burn.
Even the “Net Debt / EBITDA” ratio would misinterpret the bank’s balance sheet in this context. The key factors are capital ratios, deposit stability, maturities, realized loan losses, and liquid assets.
The reported figure “Nu Loan-to-Deposit 35%” applies to Mexico, not to the group. 39.4 / 45.3 calculates to approximately 87% for the entire published loan portfolio. Due to differing portfolio and balance sheet definitions, this is also not automatically an identical regulatory ratio.
Why Nu Leads Operationally
Nu operates a digital bank under the Nubank brand in Brazil, Mexico, and Colombia. The bank generates revenue from loans, cards, deposits, and fees. Its strengths lie in low operating costs and the ever-increasing proportion of customers who use Nu as their primary bank. This generates data and facilitates the marketing of additional products.
In the second quarter, the return on equity was 33 percent, according to the company. The efficiency ratio was 19.5 percent. This is a very strong foundation. Gross revenue rose 39 percent and profit 49 percent, both on a currency-adjusted basis. Mexico is expanding the growth potential, while the expansion into the U.S. still entails start-up costs and execution risks.
What Makes SoFi Interesting
SoFi combines U.S. banking, lending, investments, and financial technology. Its banking license enables deposit-based financing, while the loan platform business generates additional fees through loans to partners. Cross-selling is working: 51 percent of new products were opened by existing members.
Growth is strong: adjusted net revenue up 40 percent, members up 35 percent, products up 42 percent. GAAP profit totaled $156.6 million. However, the self-calculated annualized Q2 return on equity is only 5.8 percent. That is precisely where the difference lies compared to Nu. The B2B technology platform also shrank by 23 percent year-over-year and achieved a contribution margin of only 14 percent.
Opportunities, Risks, and Latest News
With Nu , I need to keep a close eye on credit quality. The proportion of loans more than 90 days past due rose to 6.9 percent in Q2. The company attributes part of this to seasonal factors and portfolio mix. However, this explanation does not replace ongoing monitoring of loan vintages. Added to this are Brazil’s economic policies and exchange rates, which affect U.S. dollar earnings.
SoFi stands to benefit more from a recovery in earnings but also faces greater uncertainty. The proportion of additional shares has grown significantly. It is not enough for revenue and absolute profit to rise; what matters is what remains per share. Both banks must comply with capital regulations and maintain stable deposit levels.
SoFi announced a stablecoin settlement with Mastercard as well as an Orbi card partnership in Mexico on October 8. This is strategically interesting. However, the reported annual settlement volume of more than $25 billion represents payment volume, not additional revenue. In my view, new payment offerings only make a significant contribution to valuation once they generate verifiable profits.
Nu’s price surge in early October was also part of a broad rally in Brazil following the first round of the presidential election. Ahead of the runoff election on October 25, I would not consider a political optimism premium a given.
Valuation and Entry Point
Nu is cheaper relative to expected profits.
SoFi is cheaper relative to book value.
Both statements can be true at the same time:
Nu is already generating much higher returns on its capital, while SoFi must first significantly increase its returns. I do not automatically treat the negative standard free cash flow reported in financial statements as cash burn for banks. Loan growth and deposit movements significantly affect this metric.
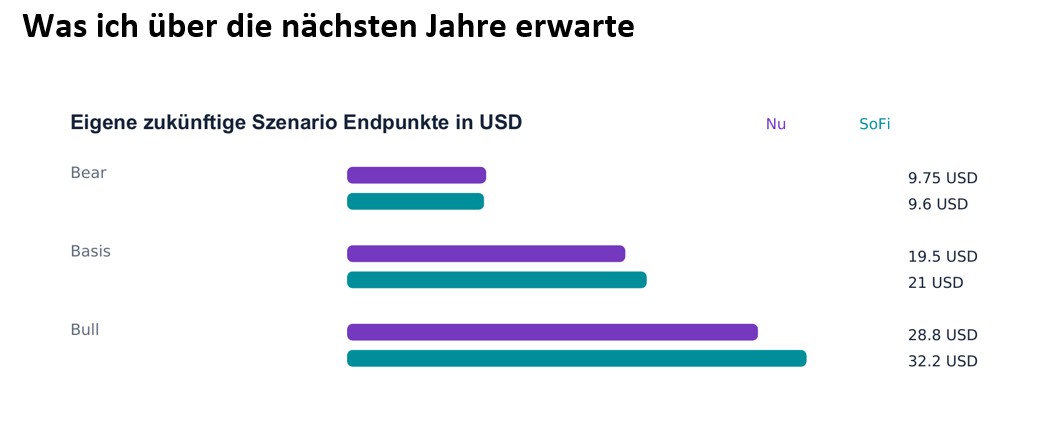
My bank earnings value model uses book values and discounted surplus earnings. In the conservative base case, this currently yields approximately $14.90 for Nu and $13.60 for SoFi. Both stock prices are thus trading above the conservative estimate. Technical buy zones do not guarantee bargain prices.
In a favorable scenario, SoFi could realize its higher upside potential. For that to happen, its return on equity, earnings per share, and Tech Solutions must show convincing improvement.
With Nu $NU (-1,88 %) , a significant portion of its operational strength is already evident. Nu therefore remains my long-term favorite. However, following the rapid rise, I would take a staggered approach and prefer to wait for a pullback.
SoFi $SOFI (-1,83 %) is an interesting stock to watch for me, but not an automatic buy solely because of the price drop. The Q3 earnings on October 27 are particularly important. According to calendars, Nu is expected to report on November 12; this date has not yet been officially confirmed in my research.
Sources:
Nu Q2 2026 Results
SoFi Q2 2026 SEC Earnings Report
Nu SEC Clarification on Monzo, September 30
Nu US Launch and Nu Global, September 10
SoFi Mastercard Settlement, September 22
SoFi Tech Solutions Orbi, October 8
SoFi Q3 Date Officially Confirmed
Nu Share Buyback of Up to $1 Billion
Nu Stock Prices and Key Figures
SoFi Stock Prices and Key Figures
Reuters Brazil Election Rally, October 5
and, of course, all the others :)
+ 4


Podcast Episode 167: "Buy High. Sell Low."
Subscribe to the podcast so you don’t miss the year-end rally.
00:00:00 Crime Pays
00:07:17 JPMorgan Money Market Fund, 5% interest p.a.
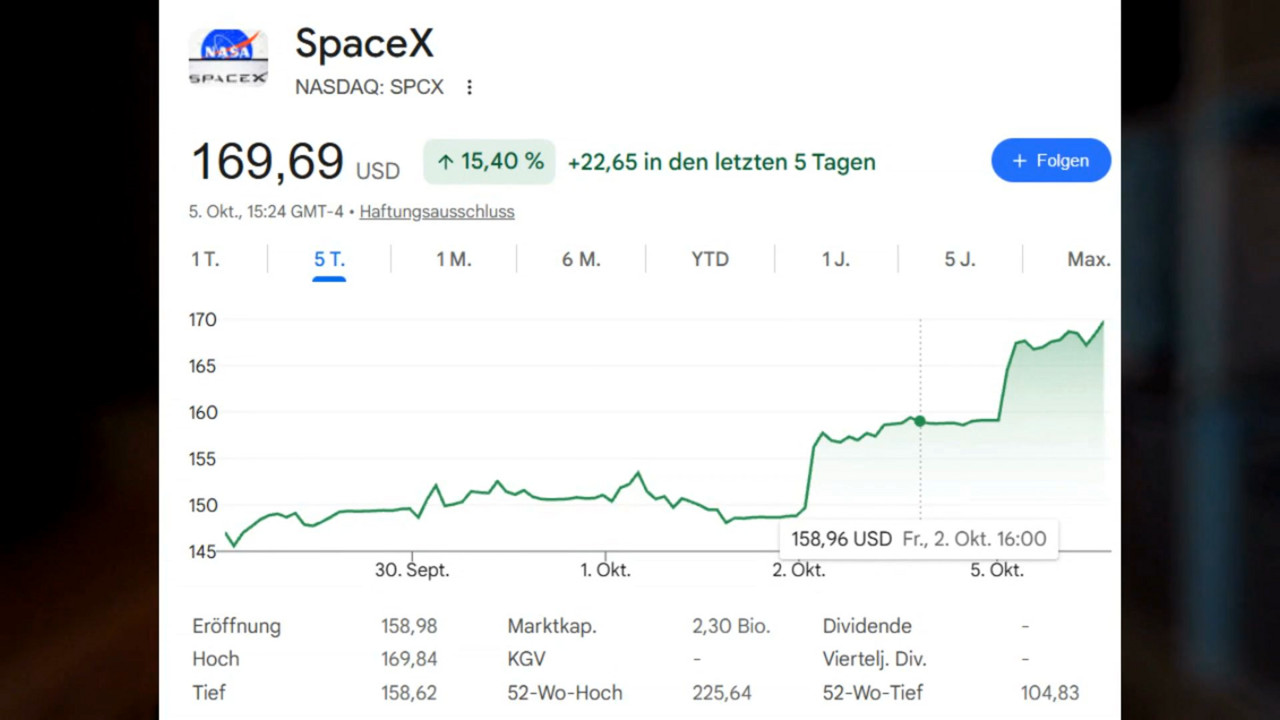
00:10:54 SpaceX
00:18:00 Market Environment
00:34:00 Micron
00:50:30 Nike
01:00:00 Brazil ETF, Nu Holdings
01:27:45 Novo Nordisk
01:56:00 McDonald’s
Spotify
https://open.spotify.com/episode/6CMFiN9KKsX5EWIct1dgnJ?si=BXqto32nSeSrdUJg6qEoUw
YouTube
https://openyoutu.be/3TehNLK2NZg
Apple Podcasts
$NVO (+3,05 %)
$MU (-1,97 %)
$NU (-1,88 %)
$MCD (+0,02 %)
$SPCX (-4,17 %)
What's going on NOW?
$NU (-1,88 %) runs faster than a Moroccan shell game operator.

Nu Holdings Denies Plans to Acquire Monzo – Stock Rises 6% in After-Hours Trading
Investing.com - Nu Holdings Ltd. shares rose 6% in after-hours trading on Wednesday after the company denied reports of a possible acquisition of the British fintech company Monzo.
In a statement addressing recent media speculation about a potential transaction, the Brazilian digital bank said that while it has “great respect for Monzo,” it is not seeking to acquire the UK-based challenger bank.
As part of its normal business operations, Nu regularly evaluates opportunities that could support its own growth and long-term goals, including partnerships, investments, and acquisitions, the company said.
The company remains focused on its strategic priorities: strengthening its position in Brazil, scaling its business in Mexico and Colombia, and expanding its presence in the United States and globally through Nu Global.
Nu’s capital allocation framework remains unchanged, with investment decisions continuing to be based on strategic fit, expected returns relative to the company’s cost of capital, long-term value creation per share, and the management and financial resources required to execute its priorities.
My personal opinion: We won’t see $10 again—I told you, if they go through with the acquisition, the price will drop @jkb83
Good thing I got out at just under $13 on the day the rumors broke and got back in today at 3:50 p.m. at $12.17 :)
Robinhood
Why I $HOOD (-3,29 %) see the greatest opportunities in the fintech sector. In my view, $NU (-1,88 %) can’t keep up, in my view.
With the approval of trading in tokenized stocks in the U.S., the market—which has been more of a niche until now—is gaining significant momentum. Overall, tokenized assets could reach a volume of $16 trillion by 2030, according to forecasts by market researchers at the Consulting Group.
Trading around the clock, in any denomination, and at breathtaking speeds. These dreams of many investors are already a reality—specifically when they trade tokenized stocks on the blockchain. While stablecoin tokens have already established themselves and have a total value of over $300 billion, tokenized stocks currently total only about $3 billion.
Rapid Growth
But since Robinhood began offering its customers the ability to trade tokenized stocks, trading volume and turnover have been growing rapidly. And now, trading in stock tokens has finally been approved in the U.S., which should significantly accelerate growth even further. In fact, in the week of September 14–20, approximately 208 million trades were executed on the blockchain, surpassing the 189 million trades on the New York Stock Exchange (NYSE) during the same period.
Robinhood Is a Major Player
One of the biggest winners of stock tokenization is undoubtedly Robinhood. Even before the U.S. approval of stock tokens, the U.S. brokerage was earning up to $8 million a day from token trading in over 120 countries. This could become one of Robinhood’s most important business segments and drive the stock to new record highs.

Titres populaires
Meilleurs créateurs cette semaine