≈ 15% of the equity portion of the total portfolio
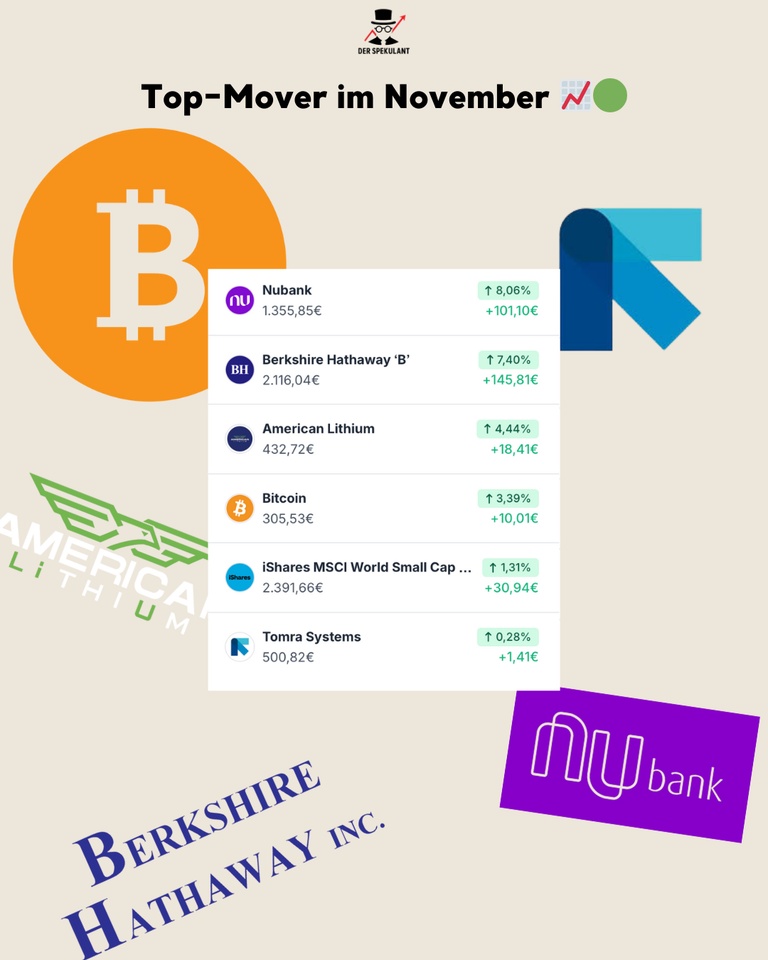
iShares MSCI World Small Cap ETF
Price
Discussion sur WSML
Postes
105🇺🇸 Inflation: Today vs. 1970s
$CSPX (-1,14 %)
$SPY (-1,26 %)
$CSNDX (-1,63 %)
$IWDA (-1,03 %)
$ISAC (-1,03 %)
$WSML (-1,32 %)
found an interesting comparison, I wonder if that's the case ? 🧐🤔
I don't think so, what do you think?
Otherwise it could get pretty uncomfortable 😬
Shifting into ACWI or small caps as an addition?
Hello,
In my securities account I have in addition to my $ISAC (-1,03 %) a small cap ETF $WSML (-1,32 %) in my portfolio.
As I am now reviewing my investments again, I am faced with the decision to sell the small cap position.
In the end, it has yielded less than I thought or than the ACWI.
So that I don't just have one year for comparison, I have also compared the performance again using the FF ETF comparison and the ACWI is clearly outperforming the small caps.
My current plan is probably a complete reallocation of the SC into the ACWI.
Are there any big small cap enthusiasts among you? Who can tell me why I should perhaps keep the small caps ETF after all🤓
Presentation and considerations for 2025
Dear community,
I have been a member of getquin for almost 2 months now and I am thrilled with how lively the discussions and contributions are. Thanks to everyone who takes the time to research certain topics and share their knowledge.
I would like to take the opportunity to briefly introduce my portfolio and share my thoughts for 2025.
I have been managing my own investments for 10 years now. I started with ETFs and got into cryptos in 2017 (and got out again after the FTX bankruptcy and the Terra Luna crash). And for a few years now I've also been trading shares and now also real assets (I'm currently testing Timeless). Over the years, I have been able to expand my portfolio.
Due to my family responsibilities, my monthly fixed savings rate is currently €500. I also park monthly surpluses in my call money account and invest them when I see an opportunity. I need a certain amount of cash as we are still renovating and therefore simply need some cash...
My goal is to have at least €500,000 in 10 years so that I can pay off the existing loans on our house. So I would need to generate an annual return of 15%...
Over time, I've built up quite a mix of shares. My credo so far has been not to invest more than €1000 per share (although there have been exceptions) and a stop-loss at 20% below the purchase price. I haven't decided when the best time to sell is and I still don't know which strategy is best for me. I would therefore describe myself more as a hodler...
Now to my plans for 2025.
- I will change the fixed value per share of €1000 and increase it to €5000.
- The stop loss remains in place.
- Keep savings rates at €500 for the time being.
- Reduce the number of shares
- Focus on growth
What could a savings plan look like that I would continue for the next few years?
One point that bothers me is the high proportion of US equities in the global ETFs (cluster risk) - even though this is where most returns have been made historically...
Hence my consideration:
- Save in an ETF with a lower or no USA share (I currently have the following in my portfolio $GERD (-1,1 %) where the USA share is only 50% - unfortunately quite expensive with TER 0.5%; or a new start with a $EXUS (-0,61 %) ) (share: 40%)
- Saving $MEUD (+0,15 %) (20 %), $FLXI (-0,55 %) (20%), $WSML (-1,32 %) (20%)
- S&P500 or MSCI USA via the 2xSPYTIPS of @Epi (via single payments)
- In addition $BTC (+0,68 %) Savings plan of 40€ / week from existing USDC holdings (LTC sales from December) Note: Crypto portfolio cannot be fully mapped in Getquin as the EARN Binance Wallet is not displayed.
What do you think? Does that make sense?
As a next step, am I considering divesting from stocks?
From $OBDC (+0 %) I would probably divest myself, possibly also $CSCO (-0,55 %) . Can you think of any other shares or ETFs that would make sense to sell due to low growth prospects? I would then invest the free money in 3xGtaaa and shares like $ASML (-0,72 %) , $NVDA (-3,63 %) ...
Overall, I'm still not sure whether my strategy is quite right. Do you have any ideas, suggestions or comments? I would be grateful for any advice.
Thank you and best regards
🚀 My ETF Strategy on Degiro: How I’m Building Long-Term Wealth 🔥
Let’s be real—financial freedom isn’t about hitting some magic number and calling it quits. It’s about building a portfolio that pays you, grows for you, and gives you options. I don’t invest to retire and sit on a beach (okay, maybe for a bit 🏝️), I invest so that money stops being a limitation in my life.
I use #degiro as my main brokerage, and over time, I’ve built an ETF portfolio that aligns with growth, income, and resilience. No chasing meme stocks, no panic selling—just consistent, strategic investing. Let me break it down. 👇
1️⃣ The Core: Stability & Global Exposure 🌍
The foundation of my portfolio is broad diversification. I don’t try to outguess the market—I own it.
✅ $VEMT (+0,46 %)– Vanguard Emerging Markets Government Bonds → A bond ETF? Yep! It provides a solid yield and balances out volatility from equities.
✅ $IHYU (+0,28 %) – $ High Yield Bond ETF → I want income, and this ETF helps generate cash flow without relying solely on stocks.
✅ $WEBG (-0,9 %)
– Prime All Country ETF → A global equity powerhouse. If the world economy grows, I grow with it. Simple.
The goal here? Consistency, lower risk, and a smooth ride even when markets get shaky.
2️⃣ Growth Plays: Betting on the Future 🚀
While the core of my portfolio is diversified, I also target high-growth sectors to capture innovation and long-term expansion.
🔹 $QYLE (-1,07 %)
– Global X NASDAQ 100 Covered Call ETF → Tech exposure with an options overlay? That’s a win-win. I get the growth of tech stocks AND extra income.
🔹 $WSML (-1,32 %)
– MSCI World Small Cap ETF → Small caps can be volatile, but they often outperform in the long run. This gives me exposure to future market leaders before they blow up.
I’m not trying to find the next Tesla—I’m betting on a basket of companies that will define the future.
3️⃣ Passive Income: Money That Works for Me 💸
I don’t just invest for capital appreciation—I want cash flow too. That’s where my dividend-focused holdings come in.
💰 $HPRO (-0,34 %)
– FTSE EPRA Nareit Global → Real estate exposure without the hassle of managing properties. It provides solid, steady income.
💰 $QQQY
– IncomeShares Nasdaq
💰 $SPYY
– IncomeShares S&P 500
The dream? My portfolio generating enough passive income to cover my expenses. That’s when you stop trading time for money.
4️⃣ The Wild Card: Emerging Markets 🌎
I believe in global diversification, and that means looking beyond just the U.S. and Europe.
🌏 $DEMD (-0,35 %)
– Emerging Markets Equity Income → I want to be positioned where the next economic growth boom happens. Emerging markets are risky, but over time, they have massive upside potential.
It’s a long-term bet, but one I’m willing to take.
5️⃣ How I Maximize Returns: Options & Leverage 🔥
Now here’s where I take things to the next level. I don’t just hold ETFs—I make them work harder for me.
📌 Selling cash-secured puts → I generate extra income by selling puts on ETFs I already want to own. It’s a smart way to get paid to wait for a better entry point.
📌 The ‘Buy, Borrow, Die’ strategy → Instead of selling assets and paying taxes, I plan to borrow against my investments, keeping my capital compounding while accessing liquidity tax-free.
These strategies separate those who just invest from those who build wealth strategically.
Final Thoughts: Investing is a Marathon, Not a Sprint 🏆
I don’t check my portfolio daily. I don’t freak out when markets drop. I trust the process, the long-term game, and my ability to stay consistent.
At the end of the day, financial independence isn’t about a number—it’s about having the freedom to make choices based on what YOU want, not what your paycheck dictates.
🔥 What’s your investing strategy? Do you use options, dividend ETFs, or emerging markets in your portfolio? Let’s talk! Drop a comment below! 🚀💰 #FIRE
#Investing
#ETFs
#FinancialFreedom
What’s your current job in 🇨🇭?
And if you take out profits, you don’t have to pay taxes? At least till 50k right?
🙌🏼
Presentation of portfolio logic - feedback welcome!
Hello dear community,
Recently my portfolio and its logic was presented in an article by Business Insider and analyzed by Konrad Kleinfeld from SPDR. There was some exciting feedback, but of course I would also like to activate your swarm intelligence and get your feedback 🙂
First of all: Although I am pursuing a core-satellite strategy, the "satellite" does not aim to outperform, but is simply for fun and offers room for investments that do not fit into the logic of the core. The satellite consists largely of ETFs (e.g. in commodities, real estate, private equity, REITs, etc.), but only accounts for <10% of the overall portfolio and is not included here.
My goal is broad diversification that goes beyond a pure market capitalization-based index as well as long-term returns.
In doing so, I rely on a rule-based approach and diversify along factors based on the selection criteria of the indices. As I deliberately do not want to make any sector or regional bets in the "core", but instead focus purely on the selection criteria of the indices, the relatively significant dividend block serves to reduce the US lump, as high-dividend companies are more frequently found in Europe.
Since the portfolio is quite granular, the portfolio overview function would be very confusing, so I hope it is easy to understand in text form:
1. MSCI World Block (40%):
$SPPW (-0,53 %) MSCI World (10%)
$XDEM (-1,03 %) MSCI World Momentum (10%)
$XDEQ (-1,09 %) MSCI World Quality (10%)
$XDEV (-0,68 %) MSCI World Value (5%)
$WSML (-1,32 %) MSCI World Small Cap (5%)
Momentum, Quality and Size in the sense of the "normal", market-capitalized MSCI World are weighted slightly higher, as they have historically performed better and should logically perform better in a long-term positive market environment.
2. emerging markets block (20%):
$SPYM (+0,38 %) MSCI Emerging Markets (6.67%)
$SPYX (-0,24 %) MSCI Emerging Markets Small Cap (6.67%)
$5MVL (+0,04 %) MSCI Emerging Markets Value (6.67%)
⚠ There are currently no ETFs on the MSCI EM Quality and MSCI EM Momentum indices that are available in UCITS form and tradable in Europe. Therefore, the logic of the EM block does not yet exactly reflect the structure of the World block. As soon as these ETFs are available, the block will be adjusted accordingly. Consequently, the "normal" MSCI EM as well as the value factor and small caps are currently equally weighted here.
3rd Dividend block (30%):
$VHYL (-0,58 %) FTSE All-World High Dividend Yield (5%)
$TDIV (-0,63 %) Developed Markets Dividend Leaders (10%)
$ISPA (-0,51 %) Global Select Dividend 100 (10%)
$ZPRG (-0,17 %) S&P Global Dividend Aristocrats (5%)
As mentioned, this block serves 1) to reduce the US lump, is also distributing and thus provides cash flow, which 2) is used for rebalancing at the end of the year (so I don't have to spend any additional capital on this, which has a psychological effect for me) and 3) the monthly distributions motivate me to continue investing intensively. In addition, 4) the tax-free allowance is utilized without having to actively sell shares in the other "blocks". The top 10 holdings of the individual ETFs differ greatly here despite the common denominator of "high yield". However, the financial sector is a large lump. The weighting here is derived from the high yield and diversification in the sense of complementing the other "blocks" (i.e. little tech and little US).
4. hedge bonds (10%):
$IBCI (+0,36 %) Euro Inflation Linked Government Bond (10%)
My equity allocation is (roughly) based on the rule "120 minus age", so 10% is currently left for bonds. The purpose of a bond block in the portfolio is stabilization and further diversification. With shares, I give a company capital, i.e. I become a stakeholder in the company. Corporate bonds have the same logic, because here I am also giving capital to companies. That's why I opted for government bonds in the eurozone. TIPS have performed comparatively well here in the past and the logic of inflation-linked interest rates also appeals to me.
📈 Additional considerations:
1. i deliberately do without the "Low / Min Volatility" factor, as i assume a rising market in the long term and would like to participate more in the positive phases instead of reducing the vola.
2) I don't see overlaps between ETFs as a problem, but rather as a deliberate overweighting of companies that fulfill several criteria at the same time. Of course, many companies currently overlap in the classic MSCI World and the Quality and Momentum variants. However, the selection criteria are different and as soon as a company no longer meets the quality criteria, for example, it automatically drops out of the index and the weighting is reduced without me having to actively do anything about it.
3) I have actively decided not to invest in a multi-factor ETF because I want to have transparent control over the allocation of the individual factors and many of the factor ETFs available combine the selection criteria underlying the individual factors in such a way that the corresponding product would have performed well in the past, which of course represents a hindsight bias and does not necessarily correlate with future performance.
💡 To those of you who have read this far:
First of all, thank you for your time! The portfolio is intended to dynamically reflect a section of the market that could develop positively in a diversified manner based on the different selection criteria of the indices, without taking bets on specific sectors or regions. What do you think of the allocation and the strategy? Do you see any room for improvement or things you would do differently?
Thanks for reading, showing interest and thinking along. 😊
Does iShares MSCI World Small Cap make sense as a supplement?
As a core investment, the $IWDA (-1,03 %) makes perfect sense, no question. Now opinions are divided on other (niche) ETFs and there are some emotional discussions XD ... What about the $WSML (-1,32 %) ETF? Does it make sense as a supplement to savings or not? Keyword: Is it better to look for small up-and-coming companies yourself and invest in a targeted manner (time expenditure/benefits)?
I do it myself. Small cap has had phases of outperformance, then again not. And unfortunately nobody knows the future.
Of course you can also search yourself, but with small companies the probability of failure can increase dramatically.
Streamlining the portfolio - what would you do?
Dear Community,
Yesterday you were able to help me quickly and effectively. I sold the tiny positions $MATIC (+2,46 %) with a considerable loss and $ETH (+1,82 %) with a small profit and set up a weekly savings plan on $BTC (+0,68 %) set up a weekly savings plan.
In order to simplify and streamline the portfolio even further, I now have the following question for you...
To help you understand my portfolio better, here is a brief explanation:
The main portfolio (currently approx. 150k) is a core-satellite portfolio with 56% $IWDA (-1,03 %) , 20% $GGRP (-0,99 %) , 12% $WSML (-1,32 %) and 12% $XMME (+0,28 %) .
With just under 20k is still the $CSPX (-1,14 %) in the portfolio.
I have also been holding a separate div growth portfolio (currently approx. 34k) with these stocks for some time:
$MMM (-2,37 %) approx. 1500€
$MSFT (-1,57 %) approx. 1400€
$ABT (+1,63 %) approx. 3300€
$JNJ (+2,12 %) approx. 2800€
$PEP (+3,26 %) approx. 2700€
$PG (+2,23 %) approx. 3300€
$TDIV (-0,63 %) approx. 3900€
$WQDS (-1,06 %) approx. 3850€
$FGEQ (-1,25 %) approx. 3800€
$VWRL (-0,91 %) approx. 3750€
$FUSD (-1,38 %) approx. 3750€
I save the ETF fraction constantly, nothing should or will change.
I'm just wondering how I should structure the ratio of individual stocks from now on. Should I increase all individual stocks to 5000€ per position or all stocks except Microsoft to 6k? Any other suggestions or ideas? If I simply leave the individual stocks untouched, the money would go into the div ETFs in tranches.
Total TER at 0.22 (which is quite acceptable for me) - and the overlaps are known and also okay for me 😄
Once again, thank you from the bottom of my heart and have a nice rest of Sunday 😎
Best regards
EvD
You could also merge your world ETF's into one?
Im not a fan of MMM to be honest. Low ROI. Might be good to ditch it and funnel the money into one of the dividend ETF's instead.
Maybe that could be a start?
Smart Beta ETF
Part 5 - Size... does matter?! (Small/mid-Cap & Growth ETF)
The series continues Friends,
Reading time: 8-10 minutes
Disclaimer: No investment advice or recommendation, this article is for information purposes only. Before you decide on an ETF, take a closer look at it in terms of positions, sampling, regions, etc. I can't describe everything here as it would go beyond the scope of this article
Part 1 (Definition, Categories & Z-Score and Quality Factor): https://getqu.in/RCSY4a/
Part 2 (Value ETF): https://getqu.in/Nfnhqb/
Part 3 (Low Volatility ETF): https://getqu.in/Ub7KpG/
Part 4 (Momentum ETF): https://getqu.in/CNMgGw/
What are Growth and Small Cap ETF?
Growth ETFs place a special focus on the growth of the company. This growth is usually represented by an increase in earnings per share, price/earnings ratio and sales per share over time. Growth ETFs generally take into account both past and expected future values. In other words, unlike the value premium, the focus is not on stocks that are as undervalued as possible, but on those that are showing strong increases in their profits or sales.
Small cap shares are defined by their market capitalization. This is determined by multiplying the number of shares in a company by the share price. Depending on the resulting value, the shares are classified as small, mid or large cap. These limits change from time to time (even the best-known small-cap index, the Russel 2000, sometimes contains stocks with a market capitalization of around USD 10 billion), but the following general rule still applies:
- Small cap: < USD 2 billion
- Mid Cap: 2- 10 billion USD
- Large Cap: > 10 billion USD
- Mega Cap: > 200 billion USD
Relative classifications are also frequently used due to the rapidly aging boundaries. The Vanguard Mega Cap ETF, for example, is based on the CRSP US Mega Cap Index, which is based on the top 70% of companies with the highest market capitalization in the USA. Growth and small-cap ETFs often have a similar stock selection, as it is easier for smaller companies to show strong growth. For example, if Amazon wants to achieve 10% growth in sales per year, it would have to grow by around USD 60 billion each year (double SAP's total annual sales).
Why invest in small-cap or growth?
I'm going to take the liberty of making an excursion into portfolio theory here, a bit of a number crunching, but it's worth it for the sake of understanding.
The original capital asset pricing model (CAPM) was developed in the 1960s and serves, among other things, to reflect a risk-adjusted expected return on the portfolio.
The expected portfolio return is calculated as follows: Rp = Rf + Beta x (Rm ./. Rf)
Where: Rp = return on portfolio/security, Rf (risk-free interest rate), beta (beta factor of the portfolio/security) and Rm = expected market return
Beta simplified (portfolio volatility divided by overall market volatility), or can be found on equity analysis websites (yahoofinance,..)
Risk-free interest rate = usually government bonds (e.g. 10-year federal bond) or can be obtained from auditors (https://www.dhpg.de/de/newsroom/blog/basiszinssatz)
Example:
Expected return of MunichRe
Beta 5j = 0.85 (less volatile than the overall market)
Risk-free interest rate = 2.5
Expected market return = 7%
Rp = 2.5 % + 0.85x(7%-2.5%)
Rp = 6.33 %
MunichRe's expected return is therefore - as it is less volatile - 6.33% p.a.
In fact, MunichRe's past return over the last 5 years was approx. 13.5% p.a.
This represents a risk-adjusted outperformance (alpha) of almost 7%.
... or to put it another way, the CAPM is perhaps not really suitable for deriving a return expectation here, as only one single factor is included as a risk premium: beta.
The deviation of the market return is established in the CAPM only via the beta and thus via the volatility as the only risk criterion, the so-called > systemic risk <. Dies ist bewusst der Fall, da die – durch Studien gestützte – Annahme getroffen wurde, dass > unsystemic risks < would be diversified away in portfolios, so that only the systemic risk would remain in the overall context. However, the CAPM was often not suitable for explaining market movements, which is why it was developed further.
The Fama-French model / birth of smart beta investing
Eugene Fama and Kenneth French - two names that send a shiver down the spine of every business economist - also recognized the insufficient validity of the CAPM model in explaining returns and extended the model by 2 factors, which made it possible to explain significantly more price movements (90% of the previous 70%). The extension was based on 2 observations:
- Size-Premium: smaller companies tend to achieve higher returns than large companies
- Value premium: companies with a low price-to-book/earnings ratio tend to generate higher returns than companies with a high kbv/kgv.
The CAPM has thus been extended: Rp = Rf + Beta x (Rm ./. Rf) + smb +hml
Smb = small minus big (market capitalization / size premium)
Hml = high minus low (kbv/kgv / value premium)
In addition to the volatility premium, size and value premiums are also integrated in the model. In the MunichRe example, for example, a value premium would have brought the expected return closer to the actual realized return.
There are always discussions as to whether there are other - significant - premiums such as a liquidity premium, e.g. for private equity, with which a higher return is to be priced in as the money is not available.
Working out these "premiums" is the basis of many smart beta investing approaches (quality, dividend & value = value premium, growth and small-cap = size premium, low volatility = volatility/risk premium).
Why should we now invest in small-cap and growth?
Because there is a size premium - historically observed & proven by studies - that allows us to potentially outperform the market. Since growth often goes hand in hand with size, this also applies here, even if a purely growth-based approach has historically not been able to achieve any consistent excess returns, but has repeatedly done so in certain market phases.
Historical size premium
There are various studies on the size premium by the major investment houses:
- VanEck, for example, has highlighted a long-term outperformance of small-caps compared to the world index or even compared to emerging markets. Interesting paper here: https://www.vaneck.com.au/globalassets/home.au/home/vaneck_whitepaper_global-smallcaps_fv3.pdf
- MSCI also confirms this with an observed outperformance of the MSCI World Small Cap Index of 2.69% p.a. compared to the MSCI World Index since 1998. They also see an outperformance especially after reviews. Over an investment period of 15 years, small caps have outperformed large caps in around 9 out of 10 cases, as measured by the respective MSCI indices. (https://www.msci.com/www/blog-posts/small-caps-have-been-a-big/03951176075):
- A very long study since 1900 shows that the size premium often comes in waves. The following chart for the US market shows an outperformance of the size premium with an upward arrow, underperformance with a downward arrow (https://www.finanztrends.de/russell-2000-vergleich-mit-dem-sp-500-fuer-sie-zusammengefasst/):
Recent performance of the size premium:
As can be seen in the last chart, the size premium has underperformed larger companies in the recent past. As we all know, the current high valuations are primarily driven by the large tech companies. These are the Magnificient 7 for the US market/world, 1/3 of the DAX performance this year has been driven only by SAP. (https://www.quoniam.com/artikel/comeback-small-caps/)
There are many reasons for the underperformance: Interest rate policy, short interest of smaller companies, market power of the big players, quality factor, etc.
Small caps are currently trading on historically favorable price/earnings ratios (https://www.quoniam.com/artikel/comeback-small-caps/, https://e-fundresearch.com/newscenter/193-dpam/artikel/52817-bewertungsdifferenz-zu-large-caps-chance-auf-doppeltes-alpha-bei-europas-small-caps, https://www.dasinvestment.com/usa-aktien-entwicklung-large-mid-small-caps/)
Conclusion:
Historically, small-caps have outperformed (partly due to increased growth prospects). In recent years (since the 2000s), however, they have underperformed, resulting in historically favorable valuations. If one believes in the validity of the size premium, there are favorable entry opportunities here.
Which ETFs are available?
There are significantly fewer ETFs for growth and the investment volumes here are still very low (around 1 billion total volume). For small caps, the selection is significantly larger and the investment volume in the ETFs is more than 10 times as high.
👉Size-ETFs:
- $WSML (-1,32 %) (World | TER 0.35 % | Tracking Difference 0.06 % | EUR 5 bn invested volume | 3Y underperformance vs. MSCI World - 20 %pt | 5Y underperformance vs. MSCI World - 37 %pt)
o Index methodology: 15% of the lowest market cap
- $ZPRR (US | TER 0.30 % | TD -0.12% | EUR 5 bn invested | 3Y underperformance vs. S&P 500 -28 % | 5Y underperformance -58 %pt | 10Y underperformance - 180 %pt)
o Index methodology: 2000 smallest listed US companies
- $XXSC (-0,06 %) (Europe | 0.30 % | TD n.a. | EUR 2 bn inv. vol. | 3Y underperformance vs. Eurostoxx 600 -22 %pt | 5Y underperformance - 21 %pt | 10Y outperformance + 14 %pt)
o Index methodology: 15% of the lowest market cap in Europe
👉Growth-ETFs:
- $IE0005E8B9S4 (-1,29 %) (US | TER 0.19 % | TD n.a. | EUR 0.8 bn invested vol. | 3Y outperformance vs. S&P 500 + 12%pt | 5Y outperformance + 54%pt | 10Y underperformance - 50%pt)
o Index Methodology: First, the 1000 largest US companies by market capitalization are selected from the Russell 3000 Index to form the Russell 1000 Index. They are then weighted according to growth criteria:
(1) Price-to-book ratio (P/B): Companies with lower P/B ratios are favored.
(2) Medium-term earnings growth forecast: Based forecasts for 2-year earnings growth. Higher growth forecasts lead to a higher probability of inclusion.
(3) Sales growth per shareCalculated on the basis of historical 5-year sales growth. Stronger sales growth increases the chances of inclusion in the index.
- $IQQG (-0,4 %) (Europe | TER 0.40 % | TD -0.09% | EUR 0.3 bn invested volume | 3Y underperformance vs. Eurostoxx 600 -4%pt |5Y outperformance +8%pt |10Y outperformance +20%pt)
o Index methodology: Index is based on the STOXX Europe Total Market Index (TMI). Stocks are analyzed based on six factors to determine their growth characteristics: (1) Forecast P/E ratio, (2) Trailing P/E ratio, (3) Price-to-book ratio, (4) Forecast earnings growth, (5) Historical earnings growth, (6) Dividend yield. Based on these values, a growth score is determined for each share and the 40 best are included in the index. The weighting is also based on the growth score (maximum 15%).
- $EL4C (+0,05 %) (Europe | TER 0.65 % | TD n.A. | EUR 0.2 bn invested vol. | 3Y underperformance vs. Eurostoxx 600 -44 % | 5Y underperformance - 30 % | 10Y outperformance +8%)
o Index MethodologySimilar to $IQQG, except that only 20 companies are selected and each of these is included in the index in roughly equal proportions (5% each).
Conclusion:
What remains?
From a historical perspective, there is a size premium that is derived from the greater growth potential of smaller companies, among other things. However, this size premium has tended to develop in waves and there is currently an underperformance compared to large companies. So for those who believe that smaller companies can continue to outperform with a size premium in the future, there are favorable entry opportunities. There is a wide selection of small-cap ETFs for World, US, Europe, but also other countries that I have not shown here (e.g. UK & Japan), there is also a small-cap ETF for emerging markets, but I personally would not invest here, as in addition to the size risk, an additional country/political risk would be too much of a good thing for me.
If you want more growth as a pure play (and therefore not implicitly in the size premium), you can take a look at the growth ETF. I find the $IE0005E8B9S4 particularly exciting, as it also focuses on large companies with strong growth.
Let me know what your thoughts are? Do you take the size/growth effect into account, and if so, how do you reflect this in your portfolio?
Titres populaires
Meilleurs créateurs cette semaine