
$XPEV (+3,82 %)
$BIDU (-4,66 %)
$XIACY (+0 %)
$JD. (-2,17 %)
$DIS (+0,27 %)
$KLAR (-0,88 %)
$NVDA (-3,22 %)
$TCEHY (-0,22 %)
$08X (-5,2 %)
$TGT (-0,34 %)
$LOW (-1,55 %)
$PANW (-2,66 %)
$BABA (-3,51 %)
$LNVGY (-7,88 %)
$PDD (-0,84 %)
$WMT (+0,62 %)
$INTU (+0,86 %)
$GPS (-6,19 %)

Alibaba ADR
Stock
Stock
Ticker: BABA
BABA
Price
Debate sobre BABA
Puestos
3312D·
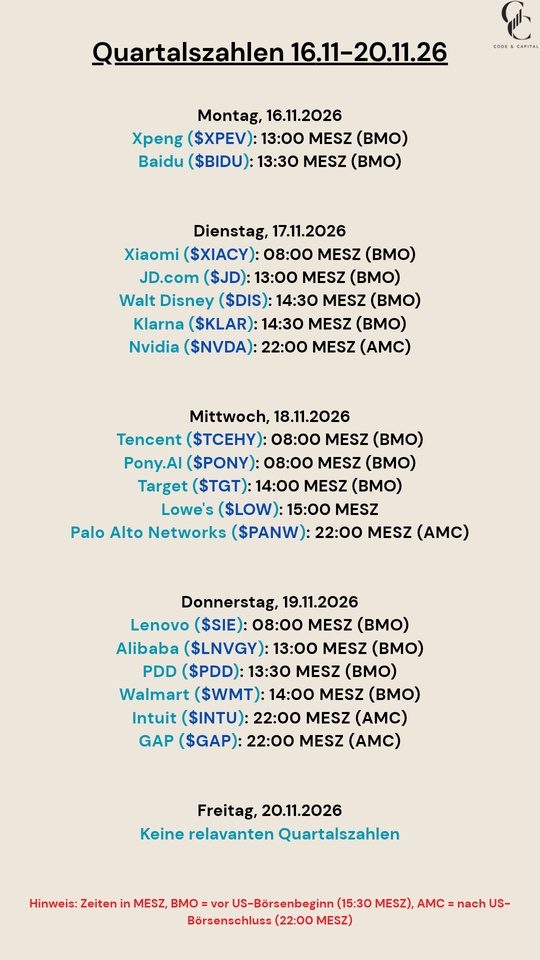
Quarterly Results: Nov. 16–20, 2026
66

1Lun·
On the Path to Financial Freedom - September Update 📊
September has come to a close, marking yet another somewhat mixed month. Basically, it was another rollercoaster ride that ended on a “downward” note. Unfortunately, this has also caused the overall YTD performance to slip slightly into negative territory. But we still have a few months left to turn things around... 😉
Early last month, I also decided to make my portfolio a bit less risky and to restructure my entire asset allocation. My medium-term goal is to completely phase out fixed-term deposits, leave 50,000 euros in a money market account, and reallocate two-thirds of the portfolio to an All World ETF. I’ve at least made some (too) small progress in this direction...
Portfolio at a glance:
👉🏻 September:
Starting balance: 1,477,964 euros + 70 in cash
End: 1,444,708 euros + 600 in cash
Deposit: 48,500 euros
Loss: -81,226 euros (-5.50%)
As is the case every month, the performance of my portfolio currently depends largely on the performance of gold and silver mining stocks—and thus directly on the performance of commodity prices. Due to sharply rising bond yields, the price of oil, and expectations of rising interest rates, these stocks have once again come under pressure. However, my fundamental expectation of rising gold and silver prices in the long term due to the global debt crisis remains unchanged, so I don’t want to dwell on this point any further right now...
I think the progress on my portfolio restructuring is more interesting. Although I was able to add nearly 50,000 euros to the portfolio from a maturing time deposit, I’ve made only very limited progress on my medium-term plan. 🐌
Current progress toward goals:
👉🏻 Money market account -> 50,000 euros: 40 euros
👉🏻 All-World ETF -> 1,000,000 euros: 9,200 euros
So where did the money go? I invested just under 10,000 euros in $VWRL (-1,32 %) . I actually wanted to leave the rest in the money market account (which is currently paying 3% interest, after all). That worked out fine for two weeks, but then I had to jump back into individual stocks.
The main additions to my portfolio were Vonovia ($VNA (-0,4 %) ) and, to a lesser extent, McDonald’s ($MCD (+1,26 %) ) and Alibaba ($BABA (-3,51 %) ). And with that, the money was (unfortunately) gone again... 😅
I see a lot of potential in Vonovia in particular, especially if you’re willing to hold onto it for a while. Right now, of course, the political situation in Berlin is taking center stage, but I still have some residual faith in the German rule of law. In fact, an expropriation at market value would actually be a stroke of luck for Vonovia, and I firmly believe that if expropriation is allowed at all, it will happen at or around the current market value.
McDonald’s and Alibaba are more long-term investments and also my first positions in these stocks. It’ll all work out... 😉
So much for my mixed bag of a September! Let’s see how October plays out. With Nike ($NKE (+1,48 %) ) and Accenture ($ACN (-0,94 %) ), two of my holdings are reporting their quarterly results today. Let’s hope for a successful start to the month! 👍🏼
➡️🆓: On my way toward 4 million in total assets, I’m now 45.5% of the way there.
Here’s to successful stock market trades! 😊
35Puestos
1.440.467,03 €
17,72 %
3333
22 Comentarios
Epi@Epi
1Lun
•
1010
•Ver todas las 22 respuestas adicionales
2Lun·
📊 My Portfolio Update: August 2026
In July, Tempus AI was my biggest loser, down 25 percent. In August, it was my biggest winner, up 42 percent. I didn’t buy or sell anything in either month.
August had two sides to it. At the beginning of the month, mild inflation data was released, and the S&P 500 hit an all-time high of 7,816 points on August 13. After that, sentiment in the bond markets shifted. The 30-year U.S. Treasury yield rose to its highest level in nearly twenty years, and U.S. gross debt exceeded forty trillion dollars. At the end of the month, Nvidia reported quarterly revenue of 96.2 billion, an increase of 106 percent. The very next day, Fed Chair Warsh signaled a pause in Jackson Hole, and the market priced in an interest rate hike in September.
Following the chip sell-off in July, this was a significantly calmer month for my portfolio:
📊 Monthly performance: +3.15%
📊 Portfolio value: ~€45,506
📊 Max. performance (Jan. 6, 2022): +40.28%
📊 YTD performance: ~+11.88%
Performance & Comparison 🚀
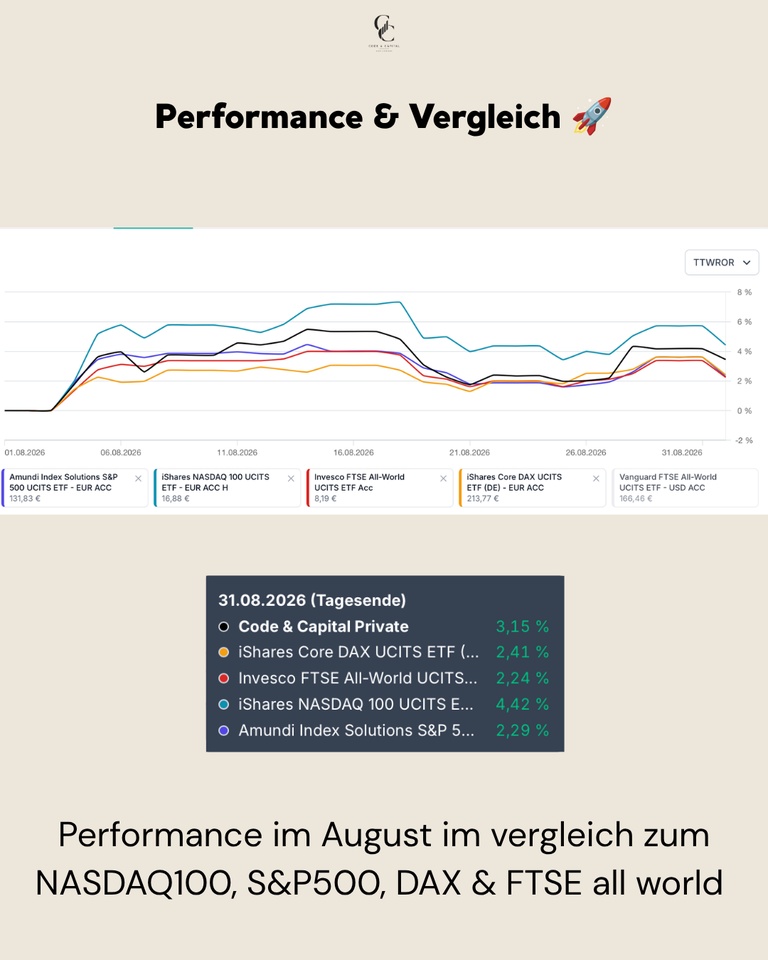
August was a positive month for all major indices, led by the Nasdaq. My portfolio outperformed the DAX, S&P, and FTSE, but lagged behind the Nasdaq.
Performance Comparison (August 1–31, 2026, end of day):
My portfolio: +3.15%
NASDAQ 100: +4.42%
DAX: +2.41%
S&P 500: +2.29%
FTSE All-World: +2.24%
Purchases, Sales & Allocation 💶
None. In July, I reduced my cash position and invested in BE Semiconductor$BESI (-4,59 %) , Solaria $SLR (-6,07 %) and Hermès $RMS (-0,43 %) . I didn’t make any changes in August.
Top Movers in August 🟢
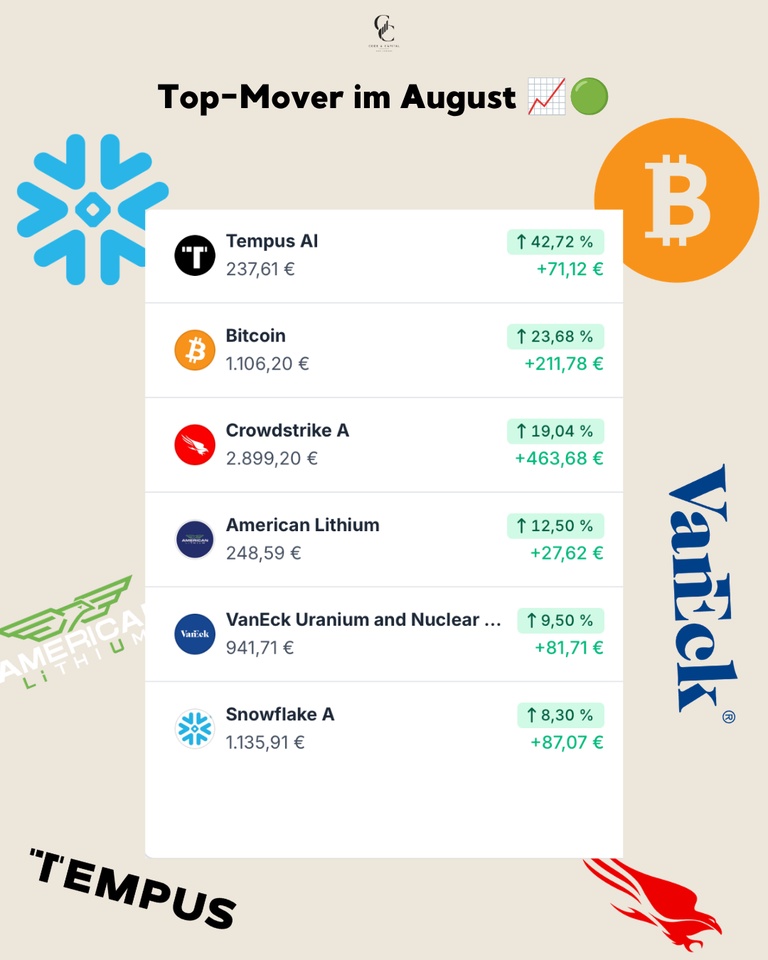
Tempus AI $TEM (-3,78 %) posted the strongest gain at +42.72% (+71.12 €), marking a strong rebound following the July slump. Bitcoin $BTC (-0,77 %) rose by +23.68% (+€211.78). CrowdStrike $CRWD (-2,63 %) rose by +19.04% (+€463.68), making it the biggest euro gain in the portfolio; cybersecurity performed well in August regardless of the chip cycle. American Lithium gained +12.50% (+€27.62), while the VanEck Uranium and Nuclear ETF $NUKL (-2,85 %) rose by +9.50% (+81.71 €). Snowflake $SNOW (-3,04 %) rounded out the list with a gain of +8.30% (+€87.07).
August’s Worst Performers 🔴
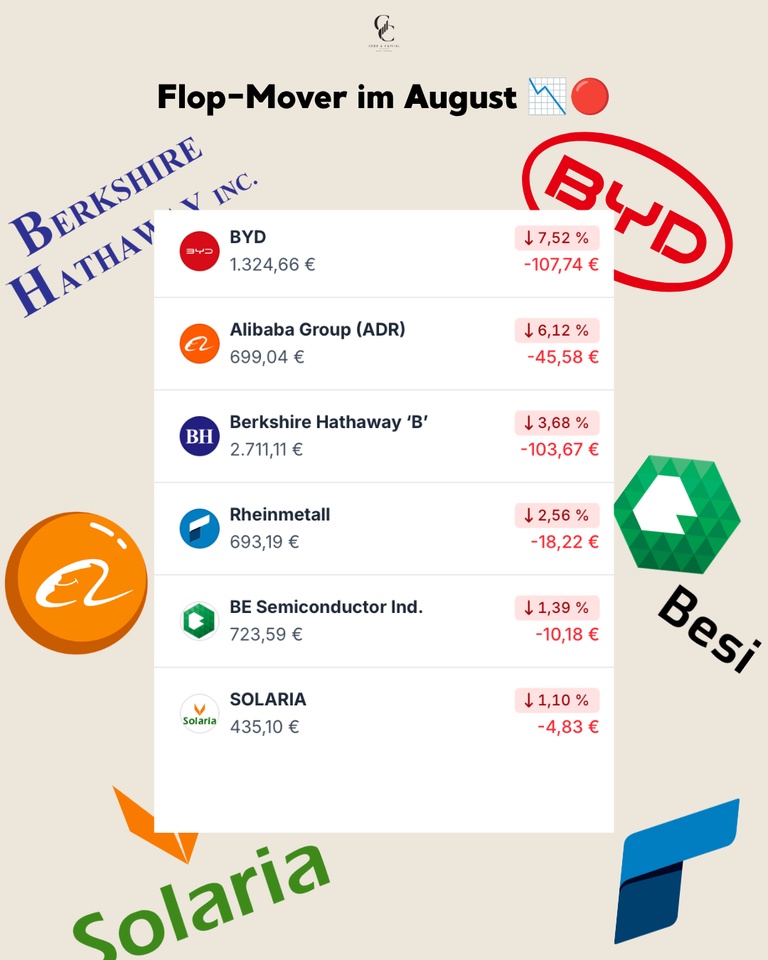
The losses were significantly smaller than in the previous month. BYD $1211 (-1,9 %) fell -7.52% (-€107.74), taking a breather after a 27 percent gain in July. Alibaba $BABA (-3,51 %) followed with a -6.12% drop (-€45.58); here, too, the China rally from July ran out of steam. Berkshire Hathaway $BRK.B (-0,02 %) fell -3.68% (-103.67 €), and Rheinmetall $RHM (-0,04 %) -2.56% (-€18.22). BE Semiconductor $BESI (-4,59 %) fell by only -1.39% (-€10.18) and has stabilized following the slump in July. Solaria $SLR (-6,07 %) closed down 1.10% (-€4.83).
Conclusion 💡
July was a month in which a lot happened. August was the month in which much of that reversed. Tempus AI $TEM (-3,78 %) went from the biggest loser to the biggest winner, while BYD $1211 (-1,9 %) and Alibaba $BABA (-3,51 %) the other way around. Anyone who had sold in a panic in July would have been on the wrong side of the market in August.
❓ Question for the Community
Did the market fluctuations in August make you get cold feet, or did you hold onto your positions? And what was your best buy?
👇 Share your thoughts in the comments!
➡️ Every month, I post a portfolio update here, along with research from my quantitative model in between.
🗞️ Newsletter: codeandcapitalquant.beehiiv.com
📈 Wikifolio: https://www.wikifolio.com/de/de/w/wf0gquant6

+ 1
1111

2Lun·
Deep Value or Value Trap? Qifu Technology
As the market prepares for Qifu Technology’s Q2 2026 earnings release today, after-market. For swing traders and long-term investors alike, $QFIN represents one of the most polarized setups in the China "Credit-Tech" space.
Fundamentals:
Qifu Technology has successfully transitioned from a traditional lender to a capital-light, AI-driven platform. By matching borrowers with institutional financial partners rather than using its own balance sheet for every loan, the company has insulated itself from significant credit risk while maintaining high margins.
AI Moat: Qifu isn't just a finance company; it’s a tech powerhouse. Its integration of advanced AI models (including Deepseek) into its ChatBI and risk assessment engines has streamlined operations. This "Credit-Tech" infrastructure is difficult for smaller competitors to replicate, creating a sticky ecosystem for both consumers and institutional banks.
Absurd Valuation: Currently trading at a P/E ratio of approximately 1.8x to 2.1x, the market is pricing $QFIN as if its earnings are destined to vanish. Yet, the company maintains a Net Margin above 27% and a ROE of over 20%.
Shareholder Yield: With a Dividend Yield hovering around 13.5% and an aggressive share buyback program, management is sending a clear signal: they believe the stock is drastically undervalued.
Risks: "China Discount"
The primary headwind isn't operational; it’s geopolitical and regulatory. The "Variable Interest Entity" (VIE) structure and the unpredictability of Beijing’s stance on consumer credit keep institutional investors cautious. Furthermore, the broader slowdown in the Chinese real estate sector could eventually weigh on consumer sentiment, though Qifu’s focus on prime, salaried borrowers provides a buffer.
Technical Analysis: My view
After a significant retreat from its 52-week highs, $QFIN is testing critical support levels.
Resistance: A breakout above $13.14 is needed to confirm a trend reversal.
Support: The $10.70 - $11.00. A breach below this could lead to further capitulation.
Earnings Catalyst: In Q1 2026, Qifu crushed estimates by $0.54 per share. A similar "beat and raise" today could be the spark needed for a massive relief rally toward analyst price targets, which sit as high as $23 to $31.
$QFIN is a high-conviction play for those who believe the fundamentals will eventually outweigh the geopolitical noise. You are buying a highly profitable, AI-integrated fintech leader at a "distressed" multiple.
What about you? With the stock down significantly from its peaks, are you taking the opportunity to buy the dip before the earnings call today, or are you waiting for the dust to settle?
𝗧𝗵𝗶𝘀 𝗶𝘀 𝘁𝗵𝗲 𝗽𝗲𝗿𝗳𝗲𝗰𝘁 𝘁𝗶𝗺𝗲 𝘁𝗼 𝗰𝗼𝗽𝘆 𝗺𝗲 𝗼𝗻 𝗲𝗧𝗼𝗿𝗼—𝗱𝗼𝗻’𝘁 𝗺𝗶𝘀𝘀 𝘁𝗵𝗶𝘀 𝗼𝗽𝗽𝗼𝗿𝘁𝘂𝗻𝗶𝘁𝘆 𝘁𝗼 𝗴𝗿𝗼𝘄 𝗮𝗹𝗼𝗻𝗴𝘀𝗶𝗱𝗲 𝗺𝘆 𝘀𝘁𝗿𝗮𝘁𝗲𝗴𝘆. https://www.etoro.com/people/bediefor
$BABA (-3,51 %)
$2618 (+0 %)
$PDD (-0,84 %) $V $PYPL (+0,06 %)
$XLF
😎 𝗗𝗶𝘀𝗰𝗹𝗮𝗶𝗺𝗲𝗿: This is my personal opinion and is for informational purposes only. You should not interpret this information as financial or investment advice
3 Comentarios

Pinduoduo ARD opinion?
••


3Lun·
The Week Ahead
Monday, August 17, 2026
1:50 a.m.: Japan – Gross Domestic Product (GDP) Q2, preliminary estimate
4:00 a.m.: China – Industrial Production & Retail Sales for July
2:30 p.m.: U.S. – NY Empire State Manufacturing Index for August
4:00 p.m.: U.S. – NAHB Housing Market Index for August
Tuesday, August 18, 2026
2:30 p.m.: U.S. – Building Permits and Housing Starts for July
3:15 p.m.: U.S. – Industrial Production for July
Wednesday, August 19, 2026
11:00 a.m.: Eurozone – Consumer Prices (Inflation, final data for July) 🌶
8:00 p.m.: U.S. – FOMC Minutes from the Federal Reserve (Fed Minutes) 🌶
Thursday, August 20, 2026
8:00 a.m.: Germany – Producer Prices for July
2:30 p.m.: U.S. – Initial Unemployment Claims
2:30 p.m.: U.S. – Philadelphia Fed Index for August
4:00 p.m.: U.S. – CB Leading Indicator for July
Friday, August 21, 2026
10:00 a.m.: Eurozone – Purchasing Managers’ Index 🌶
3:45 p.m.: U.S. – S&P Global Purchasing Managers’ Index
$HD (-0,19 %)
$9888 (-3,44 %)
$KLAR (-0,88 %)
$ADI (-3,5 %)
$TGT (-0,34 %)
$TJX (-1,24 %)
$EL (-2,53 %)
$9898 (-0,9 %)
$COTY (+3,27 %)
$BULL (-5,21 %)
$WMT (+0,62 %)
$BABA (-3,51 %)
$DE (-4,22 %)
$9999 (+0,93 %)
$NTES (+0 %)


3Lun·
📊 My Portfolio Update: July 2026
July was a month of contrasts. The Nasdaq slipped into its second correction of 2026, triggered by a sharp sell-off in semiconductor stocks—memory chip manufacturers and chip equipment suppliers saw losses, in some cases in the double digits, and even strong quarterly results were no longer enough to prop up share prices. The DAX, on the other hand, hit new record highs during the same period, driven by software stocks and a rebound at Rheinmetall. At the same time, a significant amount of capital rotated out of AI and chip stocks and into Chinese tech and electric vehicle stocks, which staged a strong comeback after months of decline.
My portfolio benefited from this rotation and is back in the black:
📊 Monthly performance: +1.02%
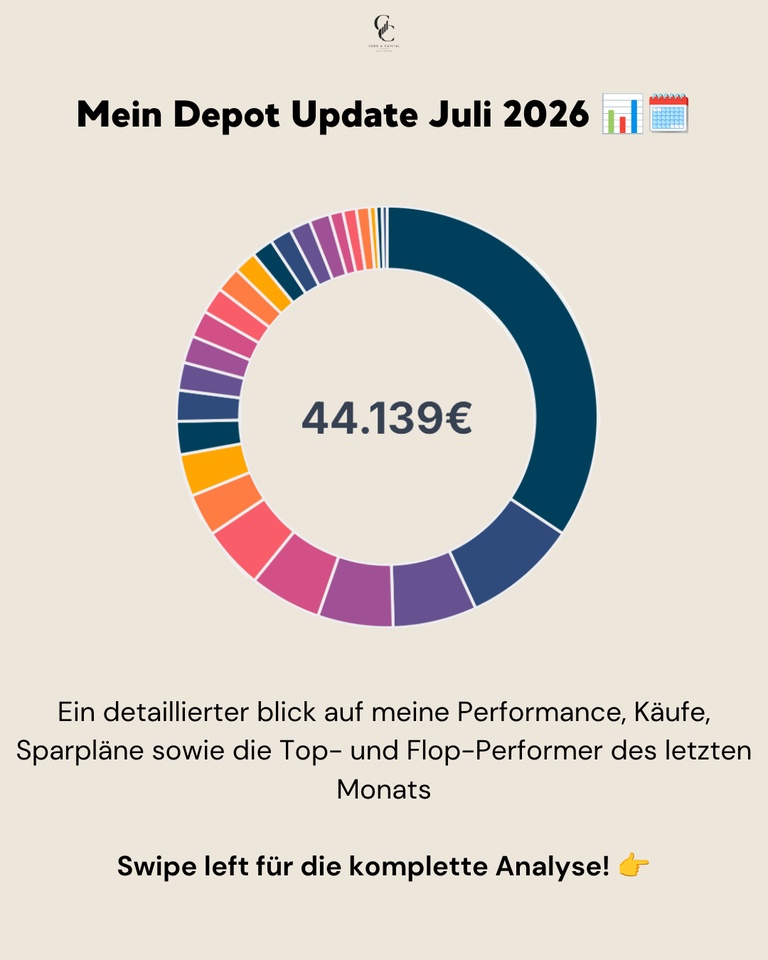
📊 Portfolio value: ~€44,139
📊 Peak performance (Jan. 6, 2022): +43%
📊 YTD performance: ~+14.09%
Performance & Comparison 🚀
July demonstrated how differently the indices could perform depending on their composition. While the Nasdaq suffered from the chip sell-off, the DAX benefited from its lower concentration of semiconductor stocks and the Rheinmetall recovery. My portfolio tracked the DAX more closely than the Nasdaq and ended the month in positive territory.
Performance Comparison (July 1–July 31, 2026, end of day):
My portfolio: +1.02%
DAX: +2.57%
S&P 500: -1.25%
FTSE All-World: -1.47%
NASDAQ 100: -6.97%
Purchases, Sales & Allocation 💶
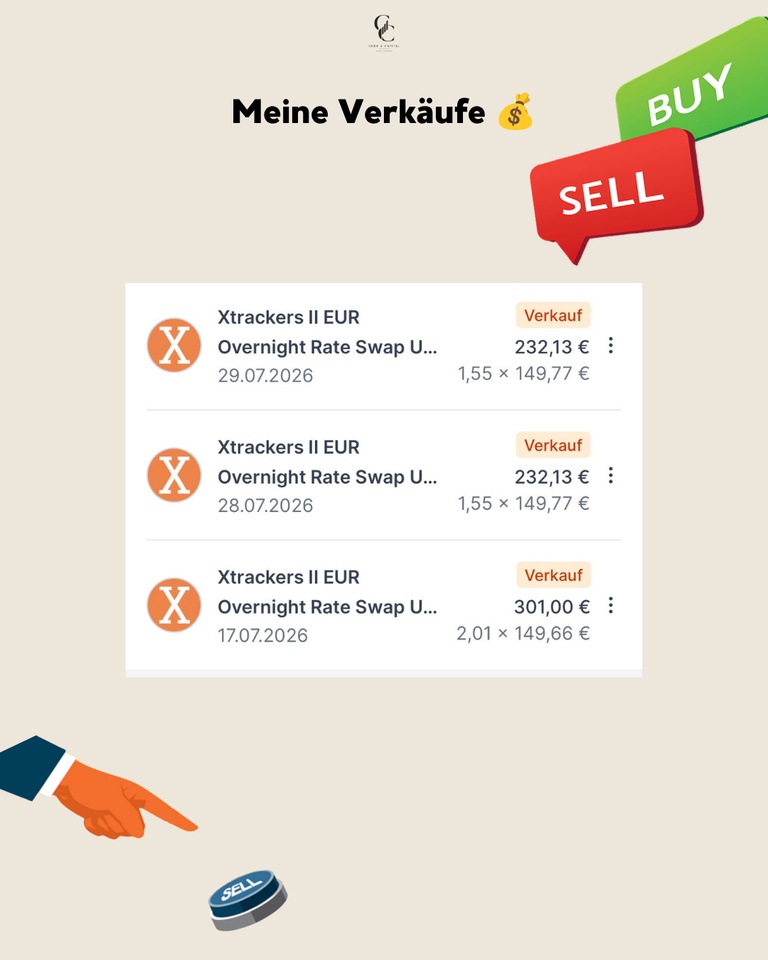
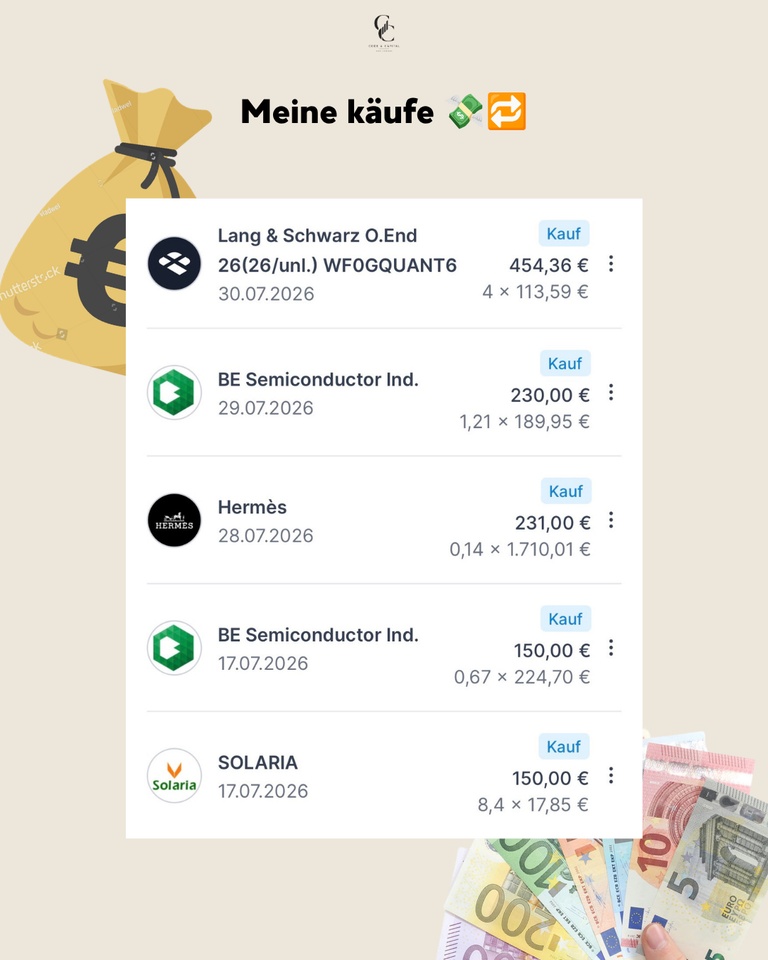
In July, I reduced my cash position. The Xtrackers II EUR Overnight Rate Swap ETF, which I had been using to park liquidity, was sold in three tranches: €301.00 on July 17, and €232.13 each on July 28 and July 29—totaling approximately €765. The freed-up funds were immediately allocated to three positions: BE Semiconductor Ind. $BESI (-4,59 %) I increased my position in two steps: €150.00 on July 17 and €230.00 on July 29. For Solaria $SLR (-6,07 %) , I added another €150.00 on July 17, and for Hermès $RMS (-0,43 %) on July 28. In doing so, I deliberately reallocated cash into stocks rather than injecting new capital.
Additionally, on July 30, I invested €454.36 in my own Wikifolio certificate $DE000LS9V052 (-3,97 %) —a private position separate from the rest of my portfolio.
Top Movers in July 🟢
The month clearly belonged to stocks that benefited from the rotation out of U.S. tech.
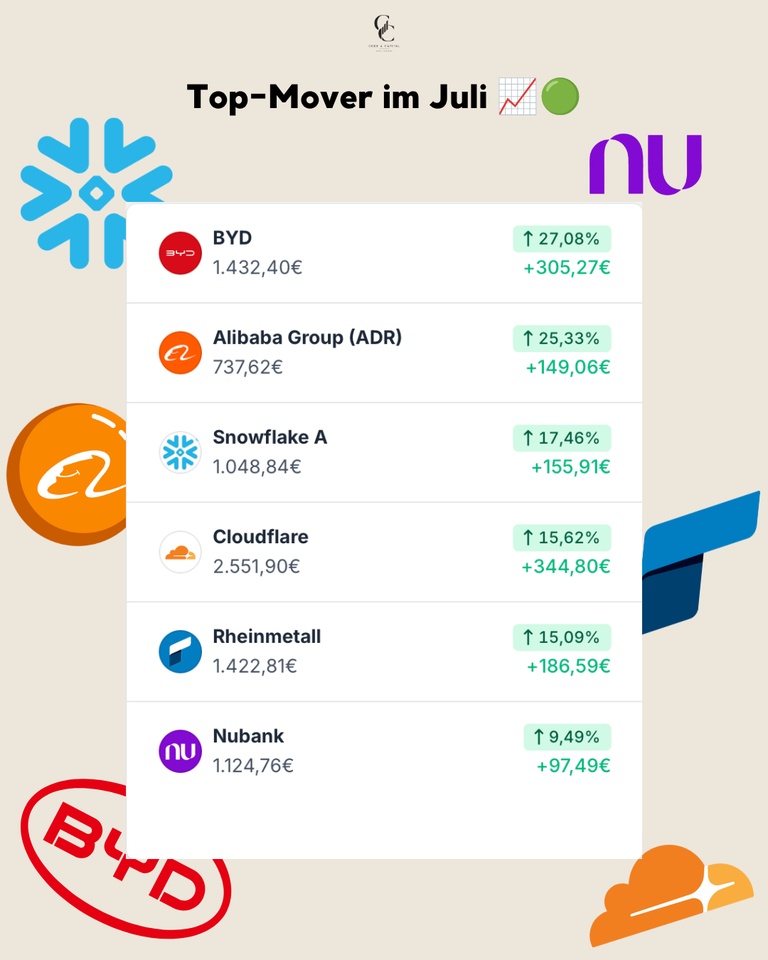
BYD posted the strongest gain at +27.08% (+€305.27). The stock received a double boost: capital flowed from AI and chip stocks into Chinese electric vehicle stocks, and BYD also reported $1211 (-1,9 %) reported a nearly 22% jump in sales for July and more than a doubling of overseas deliveries. Alibaba $BABA (-3,51 %) followed suit with a gain of +25.33% (+€149.06)—part of the same China-led rally that also swept up Tencent and Xiaomi. Snowflake $SNOW (-3,04 %) rose by +17.46% (+€155.91) and Cloudflare $NET (-4,29 %) by +15.62% (+344.80 €), the largest euro gain in the portfolio—both software stocks fared significantly better than hardware and chips in the rotation. Rheinmetall $RHM (-0,04 %) rebounded by +15.09% (+€186.59) from its 52-week low following the frigate shock in June, supported by full order books and rising defense budgets in Europe. Nubank $NU (-3,45 %) rounded out the list with a gain of +9.49% (+€97.49)—here, too, the rotation away from U.S. tech toward other regions played a role.
July’s Big Losers 🔴
On the other hand, the list consisted almost exclusively of stocks that were directly or indirectly hit by the chip sell-off.
Tempus AI $TEM (-3,78 %) suffered the biggest loss at -25.08% (-€55.74)—AI-related stocks came under particular pressure during the broad sell-off. IREN $IREN (-7,34 %) fell by -20.39% (-€179.15) and has remained weak since the price slump in early summer, still weighed down by the combination of Bitcoin weakness and skepticism regarding its transition to an AI cloud provider. BE Semiconductor Ind. $BESI (-4,59 %) fell by -18.77% (-€169.56), directly impacted by the global sell-off among chip equipment manufacturers. TSMC $TSM (-5,69 %) lost -15.04% (-€80.55)—despite a strong quarter, the stock was swept up in the general semiconductor correction. Hermès $RMS (-0,43 %) dropped -10.27% (-24.26 €), with luxury goods following the downward trend of weaker growth stocks. Solaria $SLR (-6,07 %) rounded out the list with a -9.50% (-€46.19) decline—solar and renewable energy stocks remain under pressure.
Conclusion 💡
July showed just how quickly capital flows can shift. While the chip sector underwent one of the sharpest corrections of the year, Chinese tech and electric vehicle stocks found their bottom. For my portfolio, this was a good example of why broad diversification across sectors and regions makes all the difference.
❓ Question for the Community
That was my month in numbers—how did the July chip sell-off affect you? Did you rotate into Chinese stocks, or are you holding onto your U.S. tech positions?
👇 Let us know in the comments!
➡️ Follow @codeandcapital26 for transparent portfolio updates!
🗞️ Newsletter: codeandcapitalquant.beehiiv.com
📈 Wikifolio: https://www.wikifolio.com/de/de/w/wf0gquant6
+ 2
66
10 Comentarios
3Lun
Here's to another one 😅
•
33
•
3Lun·
Alibaba new AI
🤖 $BABA (-3,51 %) up 5% after previewing its new AI model, Qwen 3.8 Max, which the company says trails only Anthropic’s Fable 5 in capability. China AI race heating up. #AI
#BABA
4Lun·
China’s slowdown is testing my biggest portfolio conviction
China is one of the clearest convictions in my portfolio.
My exposure comes through $BABA (-3,51 %) , $JD (-1,28 %) , Pictet China
and a broader Emerging Markets fund. This is not accidental diversification: I have deliberately decided to overweight a market that I believe remains undervalued and underrepresented in many portfolios.
However, having conviction does not mean ignoring uncomfortable data.
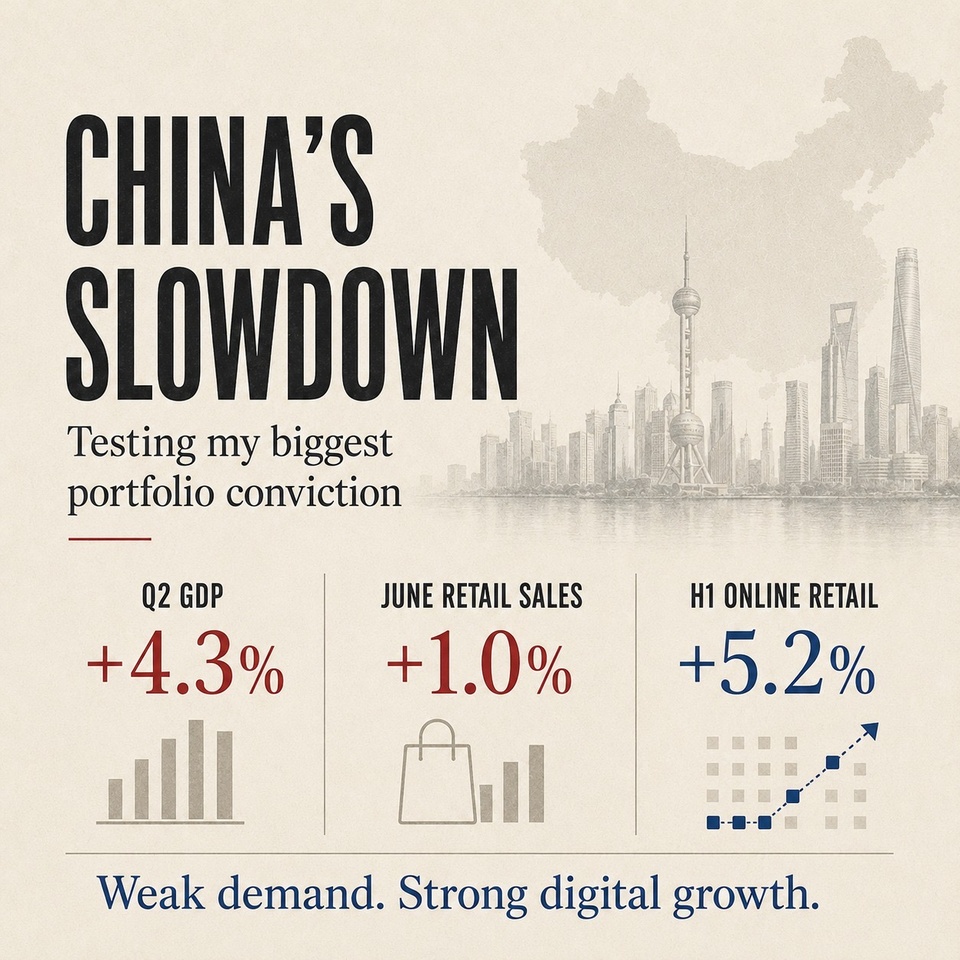
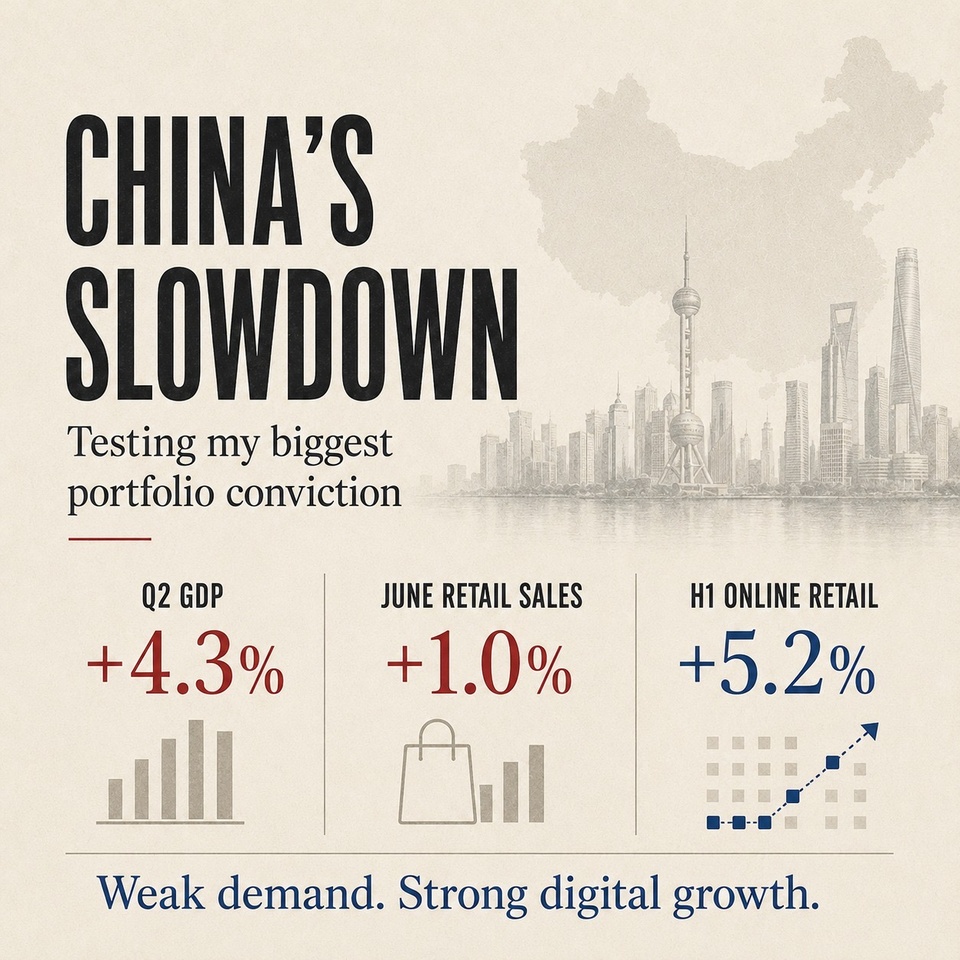
China’s economy grew by 4.3% year-on-year in the second quarter, down from 5% in the first. Retail sales increased by only 1% in June, fixed-asset investment fell by 5.7% during the first half of the year and real-estate investment declined by 18%.
Those are not numbers that support a simple “China is back” narrative.
The main weakness remains domestic demand. Chinese households are still cautious, the property crisis continues to weigh on confidence and the economy remains too dependent on industrial production and exports.
For my portfolio, this matters particularly for JD.com. Its core retail business is directly exposed to Chinese consumption. The company managed to increase JD Retail’s operating margin from 4.9% to 5.6% in the first quarter of 2026, but a business cannot rely indefinitely on efficiency improvements if the underlying consumer remains weak.
Alibaba is slightly different. Its commerce businesses face the same economic environment, but Cloud and AI provide an additional source of potential growth. As I discussed in my previous post about Qwen, Alibaba is no longer only a bet on Chinese e-commerce.
There are also some positive divergences beneath the weak headline data. Online retail sales increased by 5.2% during the first half of the year, while information, software and technology services grew by 10.7%. China’s traditional growth model is clearly struggling, but parts of its digital economy continue to expand considerably faster.
The policy response may now become the most important part of the thesis.
This week, China approved a plan to increase total retail sales from 50.1 trillion yuan in 2025 to approximately 60 trillion by 2030. The objective is clear: increase household consumption and reduce the economy’s dependence on investment, property and exports.
The difficult question is whether this will be supported by sufficiently strong measures.
Targets alone will not restore consumer confidence. China may need more direct support for household income, a stronger social safety net and a credible solution to the property crisis. Without those changes, consumers may continue saving instead of spending, regardless of how ambitious the government’s plans sound.
For now, the latest data do not make me abandon my China thesis, but they do raise the standard of evidence required to maintain it.
I will be watching whether retail sales genuinely accelerate, whether JD can continue improving its core business without destroying profitability elsewhere, whether Alibaba’s Cloud and AI growth translates into cash flow, and whether the government’s consumption plan produces concrete measures rather than only long-term targets.
Being overweight China remains one of the highest-conviction decisions in my portfolio. It is also probably the one that requires the most patience and the most frequent reassessment.
Conviction should not mean refusing to change your mind. It should mean knowing exactly what evidence would make you change it.
1111
3 Comentarios
4Lun
$JD is on track to form a very clean double bottom. $BABA also had a nice bounce lastly together with the broader Chinese market. The Hang Seng approached the 200 weeks moving average as close as ~7 % whereas the Nasdaq sits ~35% above its 200 weeks EMA. Historically on the long term chart also the US markets approach or touch the 200 weekly EMA every once in awhile. Hang Seng was in oversold territory on the weekly recently whereas the US markets sit close to overbought territory. I believe that the downside is not very big anymore on Chinese stocks. China grows faster and the only negative point is, that the velocity of growth slows down a little bit, which I think is pretty normal as the economy matures. I am bullish on china stocks in the mid- and long term :)
•
11
•4Lun·
📊 My Portfolio Update: June 2026
June was marked by a Fed shock and a rotation away from the winners of the previous months. On June 17, the Fed, under its new chair Kevin
Warsh , the Fed kept interest rates at 3.50–3.75%, the dot plot signaled a possible rate hike rather than a cut—after months of hopes for easing —a real blow to the markets. On top of that came a bombshell regarding defense stocks: The Ministry of Defense scrapped the multi-billion-euro F126 frigate program, and Rheinmetall $RHM (-0,04 %) subsequently lost over 16% —one of the stock’s worst trading days in decades. While speculative and cyclical stocks were sold off, investors fled to quality: defensive large-cap stocks and established software stocks held up significantly better.
In line with this more selective market environment, my portfolio slipped slightly into the red but held up more robustly than the DAX and Nasdaq:
📊 Monthly performance: -0.39%
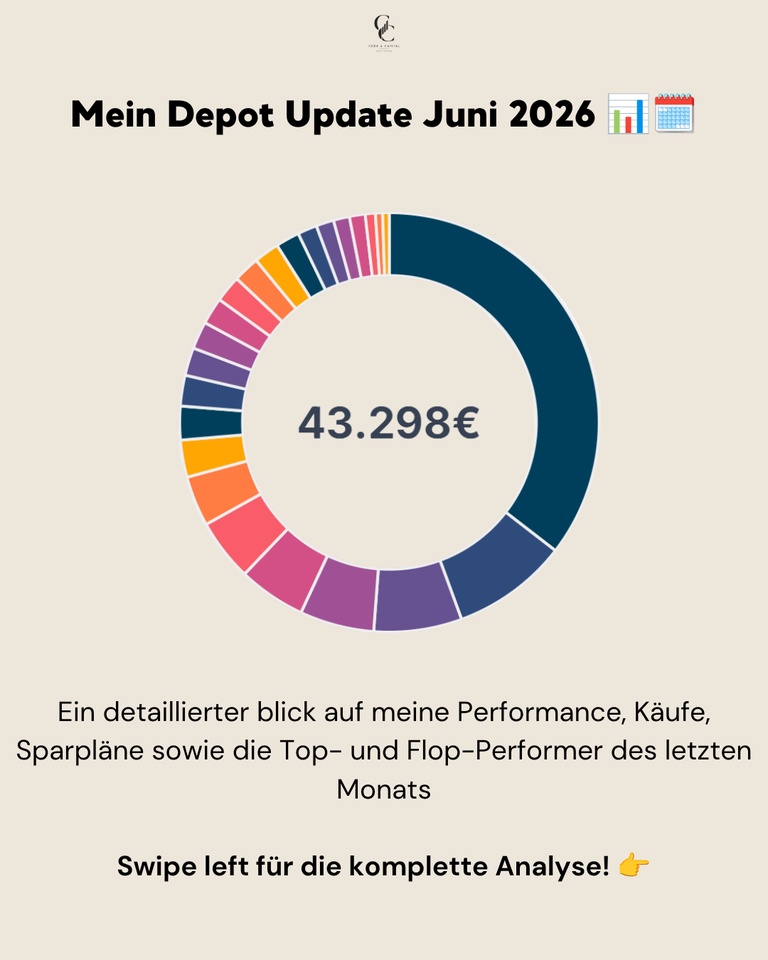
📊 Portfolio value: ~€43,298
📊 Peak performance (Jan. 6, 2022): +39.16%
📊 YTD performance: ~+7.68%
Performance & Comparison 🚀
June was a month of contrasts: While the DAX and Nasdaq suffered from the Fed shock and the rotation out of risk assets, the S&P 500 and FTSE All-World held up significantly better thanks to their broader, more defensive composition. My portfolio was in the middle of the pack at -0.39%—more stable than the DAX and Nasdaq, but weaker than the two broad U.S. and global indices.
Performance Comparison (June 1–June 30, 2026, end of day):
My portfolio: -0.39%
FTSE All-World: +1.24%
S&P 500: +0.85%
DAX: -0.53%
NASDAQ 100: -0.96%
Purchases, Sales & Allocation 💶
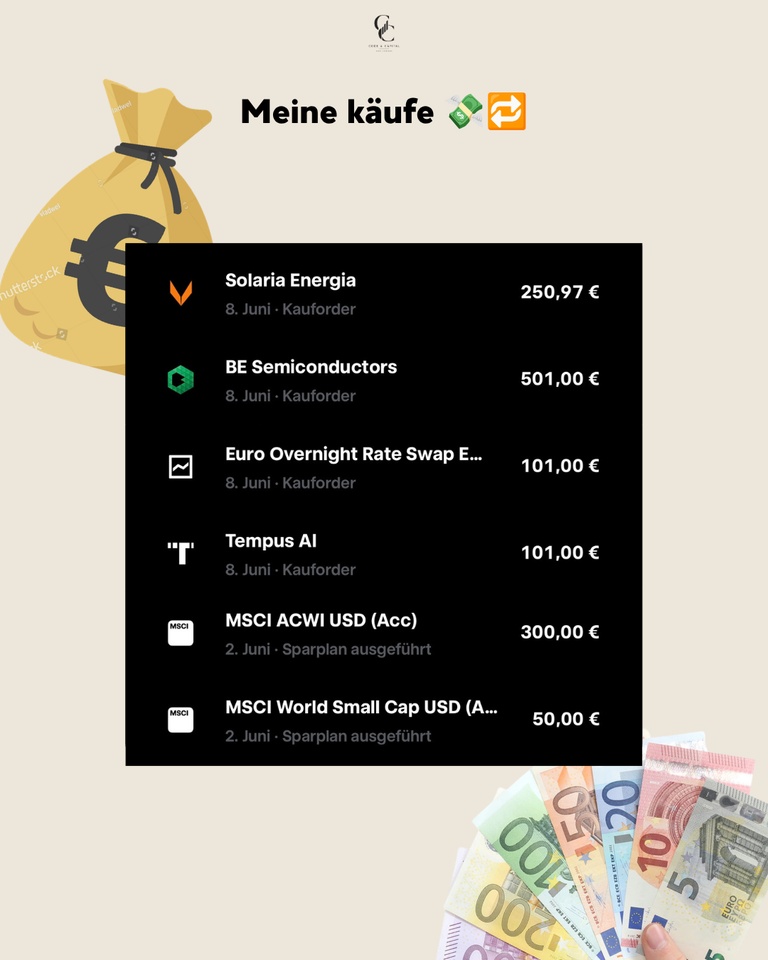
In June, €300.00 was invested in the MSCI ACWI USD (Acc) $ACWI and €50.00 into the MSCI World Small Cap $WSML via the ongoing savings plans. The following were added via buy orders: Solaria Energia $SLR (€250.97), BE Semiconductors (€501.00), a Euro Overnight Rate Swap ETF (€101.00), and Tempus AI $TEM (€101.00).
On the selling side, I took profits on two positions in which I’ve been a shareholder for a good two years: In Datadog $DDOG (-5,59 %) , I closed out the entire position after the stock had performed strongly in recent months. With Snowflake $SNOW (-3,04 %) , I sold about a quarter of the position and am holding onto the rest. Both were purely profit-taking after a strong run; there has been no fundamental change in my assessment of the companies.
Top Movers in June 🟢
Despite the generally nervous sentiment, there were a few stocks that bucked the rotation trend and benefited from the flight to quality.
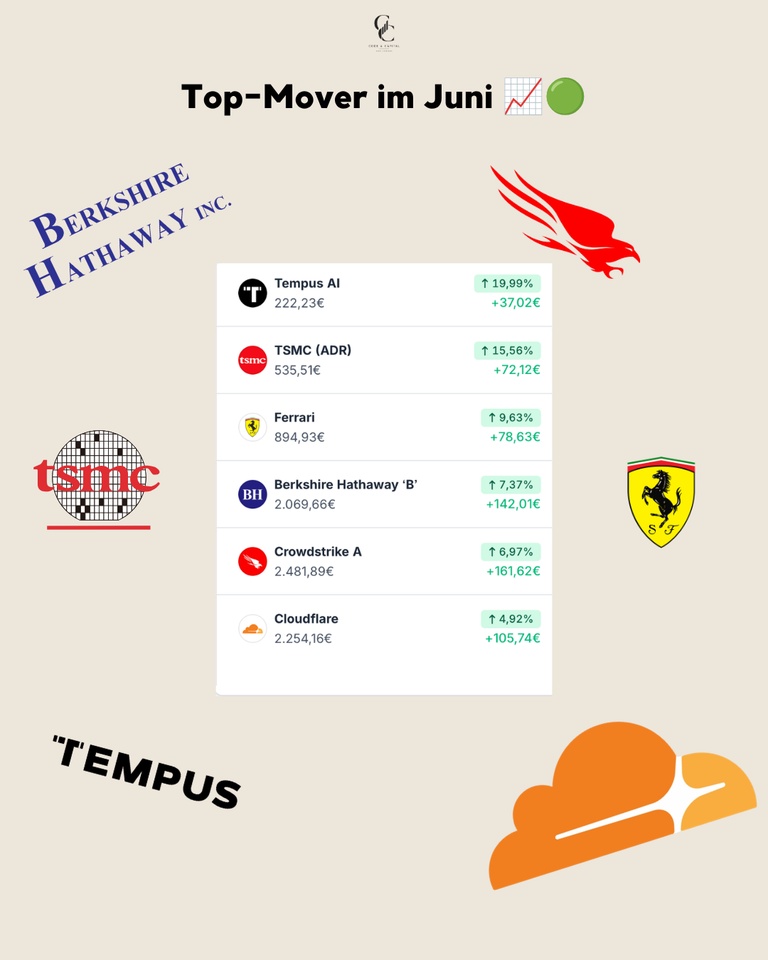
Tempus AI $TEM (-3,78 %) posted the strongest gain at +19.99% (+37.02 €)—AI diagnostics remain in demand, even as more speculative stocks were sold off. TSMC $2330 followed with a gain of +15.56% (+€72.12): Demand for chips related to AI expansion remains consistently high, regardless of the interest rate debate. Ferrari $RACE (-1,33 %) rose by +9.63% (+€78.63)—luxury goods proved resilient in the face of macroeconomic concerns. Berkshire Hathaway $BRK.B (-0,02 %) benefited significantly from the flight to defensive quality, rising +7.37% (+€142.01), while Crowdstrike $CRWD (-2,63 %) posted the largest euro gain in the portfolio with a +6.97% (+161.62 €) rise—cybersecurity remains structurally in demand. Cloudflare $NET (-4,29 %) rounded out the list of winners with a gain of +4.92% (+€105.74).
June’s Biggest Losers 🔴
The losers in June were almost exclusively the stocks that had performed the strongest in previous months or are particularly sensitive to interest rates.
IREN was hit the hardest $IREN (-7,34 %) , down -26.48% (-€316.39): Falling Bitcoin prices and ongoing disagreement among analysts regarding the company’s transition from a Bitcoin miner to an AI cloud provider weighed on the stock. Rheinmetall $RHM (-0,04 %) lost -23.36% (-€376.76) after the Ministry of Defense scrapped the F126 frigate program, which affected the entire defense sector. Alibaba $BABA (-3,51 %) fell by -21.25% (-€158.86)—Chinese tech remains under pressure due to general risk aversion toward Chinese stocks. American Lithium fell -21.21% (-€64.45), weighed down by persistently weak commodity prices and higher interest rate expectations, which particularly affect unprofitable growth stocks. BYD $1211 (-1,9 %) fell by -18.40% (-254.16 €) amid the ongoing price war in the Chinese electric vehicle market. Solaria $SLR (-6,07 %) rounded out the list of top losers with a -15.86% drop (-€63.35)—the hawkish Fed is weighing noticeably on interest-rate-sensitive solar and renewable energy stocks.
Conclusion 💡
June was a month of rotation: away from the more speculative winners of previous months, toward quality and established names. The Fed shock and the Rheinmetall slump showed how quickly sentiment can shift—a good reminder of why diversification across sectors and regions remains important.
❓ Question for the Community
That was my month in numbers—how did your portfolio fare through the Fed shock? Did you buy more Rheinmetall shares, or did you pull the plug?
👇 Let us know in the comments!
➡️ Follow @codeandcapital26 for transparent portfolio updates!
🔗 Link in bio: Wikifolio, Getquin & Parqet Portfolio
🗞️ Newsletter: codeandcapitalquant.beehiiv.com
📈 Wikifolio: https://www.wikifolio.com/de/de/w/wf0gquant6

+ 3
1414
Valores en tendencia
Principales creadores de la semana
Datos LSX · Datos fundamentales y de cierre diario de FactSet