
What are your expectations for the quarterly report?

Nokia
Stock
Stock
ISIN: FI0009000681
Ticker: NOKIA
FI0009000681
NOKIA
Price
Discussion about NOKIA
Posts
31
1Mon·
Euro AI Backbone - August Review / Portfolio Rebalancing in September 2026
Brief Review: August 2026:
Through mid-August, the Euro AI Backbone saw a recovery. In mid-August, the wikifolio’s price came under pressure. Price drivers from the semiconductor and tech hardware sectors declined, in some cases significantly.
As of August 1, the certificate’s price stood at €91.81; on August 31, it closed at €90.71, representing a loss of 1.2%.
_________________________
At the start of the new month, the regular portfolio rebalancing will take place as follows.
- The weighting of the VAT Group
$VACN (-1.9%) is reduced from 2.1% to 1.4%. - The weighting of Enel
$ENEL (+0.33%) will be reduced from 5.6% to 5.0%. - The weighting of Geberit
$GEBN (+2.8%) is being reduced from 1.3% to 0.7%. - New addition Huber+Suhner
$HUBN (-7.03%) at 2.1%.
_________________________
Background
VAT Group reduction / Fine-tuning in the semiconductor sector:
The position of the VAT Group will be reduced as part of the optimization of the semiconductor specialists (taking into account the existing position in Atlas Copco $ATCO B (-3.08%) ) in order to reduce concentration risk in vacuum technology.
Reduction in Enel:
For the major utilities, the reduction is intended to lock in profits and free up capital for highly specialized technology niches, while coverage of the core power grid holding remains stable.
Reduction in Geberit:
The weighting of Geberit is being adjusted to reflect its actual AI leverage (cooling water circuits/piping systems in data centers), ensuring that the physical data center infrastructure segment remains represented without tying up unnecessary capital.
Addition of Huber+Suhner:
In the Optical Interconnects and Passive Infrastructure segment, Huber+Suhner is a specialist in high-precision fiber-optic and connection technology within data centers. Huber+Suhner bridges the gap in optical signal transmission between AI servers, thereby complementing network equipment providers such as Nokia
$NOKIA (-1.27%) as well as cable giants such as Prysmian
$PRY (-3.75%) and NKT $NKT (-0.66%) .
P.S.: The Wikifolio will likely be granted "Investable" status later this month, and you'll be able to start investing in it at that time!
www.wikifolio.comEuro AI Backbone
66
1 Comment
Tenbagger-Capital@Tenbagger-Capital
1Mon
•
11
•
2Mon·
𝐍𝐨𝐤𝐢𝐚: 𝐀𝐈 𝐚𝐧𝐝 𝐂𝐥𝐨𝐮𝐝 𝐃𝐞𝐦𝐚𝐧𝐝 𝐃𝐫𝐢𝐯𝐞 𝐒𝐭𝐫𝐨𝐧𝐠 𝐍𝐞𝐭𝐰𝐨𝐫𝐤 𝐆𝐫𝐨𝐰𝐭𝐡, 𝐖𝐡𝐢𝐥𝐞 𝐑𝐞𝐬𝐭𝐫𝐮𝐜𝐭𝐮𝐫𝐢𝐧𝐠
📊 𝐑𝐞𝐬𝐮𝐥𝐭𝐬
• Net sales: €4.82B, up 8% YoY and 9% in constant currency
• Comparable EPS: €0.07 vs. €0.04 YoY
• Comparable operating profit: €434M, up 18%
• Comparable operating margin: 9.0%, up 70 bps
• Reported operating loss: €50M, including €390M of restructuring charges
⠀
📌 𝐊𝐞𝐲 𝐓𝐚𝐤𝐞𝐚𝐰𝐚𝐲𝐬
• Network Infrastructure sales rose 12%, led by Optical Networks growth of 20% and IP Networks growth of 16%
• AI & Cloud revenue more than doubled to €446M, up 105% in constant currency
• Mobile Infrastructure sales increased 7% in constant currency
• Gross margin expanded 70 bps to 46.0% on a comparable basis
• Free cash flow was negative €732M, primarily due to working-capital, restructuring and capex outflows
⠀
💬 𝐌𝐚𝐧𝐚𝐠𝐞𝐦𝐞𝐧𝐭 𝐂𝐨𝐦𝐦𝐞𝐧𝐭𝐚𝐫𝐲
Optical Networks continued to see significant order-intake growth from AI and cloud customers, while Nokia expanded U.S. optical manufacturing capacity to support expected demand in 2027 and 2028.
44

3Mon·
Analysis of AI Infrastructure Stocks 📈
- Global data center capacity
- Market for liquid cooling in data centers
- Cashing in on the AI gold rush
- "Old industry" as the winner
- ABB $ABBN (-2.7%)
- Cisco $CSCO (-4.82%)
- Hochtief $HOT (-3.23%)
- Nokia $NOKIA (-1.27%)
- Schneider Electric $SU (-1.66%)
- Siemens $SIE (-1.78%)
- Siemens Energy $ENR (-2.01%)
22
3Mon·
🏗️ Introduction: Euro AI Backbone Wikifolio ⚡⚙️
Dear Community,
To kick off the week, I’d like to introduce you to my “Pick-and-Shovel” wikifolio “Euro AI Backbone” (in German: Backbone). More detailed information will follow; for now, this is just a rough overview.
_________________________
Background
The market’s focus is primarily on the U.S., while Europe often plays a more subordinate role. Yet recent years in particular have made it clear just how dependent Europe is on other countries such as the U.S., Russia, and China.
By the time the “Orange Man” began his second term, it had become clear:
Europe must become more independent —not only in the field of defense but also in the field of AI.
For nearly five years, Goldman Sachs has maintained an index called “EU AI Capex,” which consists of 64 European stocks. This served as the blueprint for my wikifolio.
The wikifolio was launched on June 18, 2026. For the wikifolio to receive “Investable” status, it needs, among other things, 10 bookmarks. So I’d really appreciate it if you could click “Add to Watchlist” on the wikifolio—thanks in advance.
_________________________
The “Pick-and-Shovel” Approach
The wikifolio aims to cover as much of the value chain for operating modern artificial intelligence as possible.
The focus here is primarily on five areas:
- The Shovels: Semiconductors and machinery (e.g., lithography systems, wafer deposition, chip assembly)
- The Gas: Electricity and energy generation (e.g., wind power, hydroelectric power, solar power plants)
- Highways: Networks and cables (e.g., transformers, high-voltage undersea cables, power grid infrastructure, transmission lines)
- The brain: Automation and data center cooling (e.g., liquid cooling, power distribution cabinets, data networks, control systems)
- The Physical Foundation: Construction, emergency power, and security (e.g., construction of the facilities, emergency power generators, cybersecurity)
_________________________
Investment Universe
The portfolio includes European large-, mid-, and small-cap stocks.
Focus: Technology (semiconductor equipment), utilities (electricity, grids), and industrials (automation, specialty cables, data center construction, cybersecurity).
The Core: European market leaders with global monopolies and competitive moats.
The Tech Specialists: Profitable second-tier suppliers as yield boosters.
The foundation: Energy producers, grid operators, and construction specialists for stable cash flows and risk hedging.
Regular rebalancing, which typically takes place at the beginning of each month, prevents concentration risk. While the foundation remains unchanged, the weightings of individual securities may be adjusted. The replacement of individual stocks, the addition of new stocks, or the exclusion of individual stocks can also take place at the beginning of the month.
Initially, the portfolio consists of 37 stocks. There is no cash reserve.
The current allocation of holdings is as follows:
By sector:
- Industrial: 44%
- Utilities: 29%
- Technology: 26%
- Consumer Discretionary: 1%
By country:
- Germany: 24%
- United Kingdom: 14%
- Switzerland: 13%
- Netherlands: 12%
- France: 12%
- Spain: 10%
- Italy: 9%
- Denmark: 2%
- Finland: 2%
- Austria: 2%
Investments are made exclusively in European stocks. None ETFs, no investment certificates, no funds, no leveraged products.
_________________________
Initial Holdings
At the start, the portfolio comprises the following 37 securities, sorted by their current weighting:
Infineon $IFX (-4.1%) , ASML Holding $ASML (-1.37%) , Siemens $SIE (-1.78%) , Enel $ENEL (+0.33%) , Rolls-Royce $RR. (+1.17%) , Schneider Electric $SU (-1.66%) , Iberdrola $IBE (-0.32%) , ABB $ABBN (-2.7%) , VAT Group $VACN (-1.9%) , Siemens Energy $ENR (-2.01%) , Prysmian $PRY (-3.75%) , ASM International $ASM (-6.01%) , BE Semiconductor Industries $BESI (-4.79%) , STMicroelectronics $STM (-1.9%) , RWE $RWE (-1.55%) , E.ON $EOAN (+1.73%) , Legrand $LR (-1.18%) , National Grid $NG. (+0.69%) , Nokia $NOKIA (-1.27%) , SSE $SSE (+0.83%) , EDP Renovaveis $EDPR (-1.89%) , Hochtief $HOT (-3.23%) , Red Eléctrica de España $RED (+1.55%) , Nexans $NEX (-1.71%) , United Utilities $UUGRY (+2.64%) , Enagas $ENG (-0.03%) , Centric $CENTR (-0.77%) , Spirax-Sarco Engineering $SPX (+0.29%) , Soitex $SOI (-5.88%) , Geberit $GEBN (+2.8%) , Aixtron $AIXA (-5.32%) , Orsted $ORSTED (-1.4%) , Verbund $VER (-1.89%) , SAFRAN $SAF (+1.1%) , Thales $THALES (+4.71%) , NKT $NKT (-0.66%) , Andritz $ANDR (-3.08%)
_________________________
Holding Period
Since infrastructure development is likely to continue for several more years, the holding period is clearly geared toward the long term. Short-term trading is avoided.
_________________________
Sources of Information
The following sources of information are primarily used to identify stocks:
Companies’ quarterly reports and financial statements.
Analyst reports and industry studies from global investment banks.
Business media and financial publications.
_________________________
I’m curious to see how the portfolio will perform over the long term. Monthly updates will keep you informed.
www.wikifolio.comEuro AI Backbone
99
7 Comments
3Mon
Good luck, Mikey—I'm curious to see how the EU AI Wiki does. Just a quick side note... The Wikifolio won't be "investable" until it has successfully gone through the issuance process ;-) But it'll all work out :-)
•
44
•3Mon·
🏗️🔋Euro AI Backbone - My Bet on Europe's AI Backbone 🎲
Dear Community,
Throughout last year, I found myself repeatedly wanting to focus on the European market as well. But the same old arguments kept dissuading me: The European market doesn’t deliver; Europe doesn’t meet my desire for a growth-oriented, high-yield portfolio, etc.
I also asked myself: Which sectors and industries do I want to cover? Where do I see enough potential to justify taking the risk? To what extent do I want to align my portfolio with this strategy?
In today’s episode, Alles auf Aktien: Fiese Gewinnwarnung bei BMW und Europas KI-Unabhängigkeitsaktien , something caught my attention:
A basket from Goldman Sachs, consisting of 64 European stocks, with the wonderful name: EU AI Capex.
Performance over the past five years: 17.5 percent annualized, including dividends.
_________________________
And which industries are covered?
- Semiconductors
- Machinery
- Electricity
- Networks
- Cables
- Energy
- Automation
Unfortunately, existing ETFs such as the iShares STOXX Europe 600 Utilities UCITS ETF or the iShares STOXX Europe 600 Technology UCITS ETF do not cover all of these sectors.
"Sounds exactly like what I was looking for," I thought to myself, and used my day off today to create an index tailored to my preferences.
Goldman Sachs has listed 12 of the 64 holdings, including their percentage allocations. The remaining 52 holdings appear to be known only to institutional investors, as the index isn’t publicly available.
So I created my own “Pie” through Trading 212. More specifically, a “Pie” is a personalized investment portfolio in which I can invest in multiple stocks and ETFs according to a percentage allocation I set myself and save toward them simultaneously via a single automated savings plan—with no expense ratio and no order fees.
It would go beyond the scope of this post to write about every individual security, which is why I chose this particular one. I didn’t make these decisions entirely on my own. Gemini helped me with this. In the end, we settled on 37 securities.
_________________________
On Selecting the Holdings
Together, we gradually added European market leaders across the entire value chain. We always kept an eye on the sectors—none should be left out.
_________________________
On the Percentage Allocation
It’s important to note upfront that the “pie” will be funded with 150 euros per month going forward. Since the minimum investment amount at Trading 212 is one euro, the smallest weighting in the “pie” must be at least 0.7%:
1.00 euro / 0.70% = 142.85 euro
The percentage allocation was then based on pricing power and global scalability.
More details on this may follow in a later post.
_________________________
About the Stocks
From EU AI Cortex Basket taken over by Goldman Sachs:
- Infineon ($IFX (-4.1%)): 7.10%
- ASML ($ASML (-1.37%)): 6.80%
- Siemens ($SIE (-1.78%)): 6.00%
- Rolls-Royce ($RR. (+1.17%)): 5.40%
- Enel ($ENEL (+0.33%)): 5.40%
- Schneider Electric ($SU (-1.66%)): 5.40%
- ABB ($ABBN (-2.7%)): 5.00%
- Iberdrola ($IBE (-0.32%)): 4.90%
- Siemens Energy ($ENR (-2.01%)): 4.70%
- ASM International ($ASM (-6.01%)): 3.70%
- Prysmian ($PRY (-3.75%)): 3.60%
- BE Semiconductor ($BESI (-4.79%)): 3.20%
Supplemented by the following stocks:
- VAT Group ($VACN (-1.9%)): 4.50%
- STMicroelectronics ($STM (-1.9%)): 2.50%
- Legrand ($LR (-1.18%)): 2.00%
- RWE ($RWE (-1.55%)): 1.95%
- Nokia ($NOKIA (-1.27%)): 1.90%
- E.ON ($EOAN (+1.73%)): 1.90%
- National Grid ($NG. (+0.69%)): 1.80%
- SSE plc ($SSE (+0.83%)): 1.70%
- EDP Renováveis ($EDPR (-1.89%)): 1.60%
- Red Eléctrica ($RDEIY (+0%)): 1.50%
- Nexans ($NEX (-1.71%)): 1.50%
- Hochtief ($HOT (-3.23%)): 1.50%
- Enagás ($ENG (-0.03%)): 1.40%
- United Utilities ($UU. (+3.64%)): 1.40%
- Spirax-Sarco ($SPX (+0.29%)): 1.30%
- Centrica ($CNA (+0%)): 1.30%
- Aixtron ($AIXA (-5.32%)): 1.30%
- Orsted ($ORSTED (-1.4%)): 1.15%
- Verbund AG ($VER (-1.89%)): 1.10%
- Soitec ($SOI (-5.88%)): 1.10%
- Safran ($SAF (+1.1%)): 1.00%
- Thales ($HO (+2.13%)): 1.00%
- Geberit ($GEBN (+2.8%)): 0.90%
- NKT A/S ($NKT (-0.66%)): 0.80%
- Andritz ($ANDR (-3.08%)): 0.70%
The figures $IG (+0.97%) , $SRG (+1.76%) , $TRN (+2.09%) , $ALFA (-2.01%) , $ATCO B (-3.08%) or $AEMMY can unfortunately only be traded via CFDs on Trading 212. Therefore, these securities could not be included.
_________________________
Trading 212 Pie
The Pie now accounts for about 10% of my portfolio, and I’ll be contributing 150 euros to it each month going forward.
I am convinced that Europe will succeed in becoming more independent. However, in my opinion, a self-sufficient Europe without any dependence whatsoever is simply not possible (keyword: globalization).
_________________________
Pie Composition
By country:
- Germany: 24.35%
- France: 15.4%
- Netherlands: 13.7%
- United Kingdom: 12.9%
- Switzerland: 10.4%
- Italy: 9%
- Spain: 7.8%
- Denmark: 1.95%
- Austria: 1.8%
- Portugal: 1.6%
By sector:
- Technology: 32.3%
- Industrial & Capital Goods: 31.5%
- Utilities & Energy Infrastructure: 36.2%
By industry:
- Semiconductors & Data Center Chips: 27.8%
- Energy Equipment & Grid Technology: 25.5%
- Electricity Generators: 16.1%
- Physical Networks & Storage: 10.1%
- Cable Infrastructure: 5.9%
- Vacuum Technology & Components: 6.5%
- Network Technology & Connectivity: 1.9%
- Data Centers & Industrial Construction: 3.1%
- Cyber and Perimeter Security: 3.1%
_________________________
I’m curious to see how the pie chart will develop.
P.S.: You can find the pie chart on Trading 212 under the name Euro AI Backbone GS to copy.
1515
2 Comments
I'm investing in the $IEFM. While it doesn't cover the sectors you mentioned, it focuses on the top performers from the past 6–12 months.
•
11
•4Mon·
Update on my portfolio
Last week, I decided to reduce the size of some positions in my portfolio in order to invest more in the current AI boom.
This involved 35 $BRK.B (-0.13%) and 350 $SHEL (-0.22%) shares were sold from my portfolio.
The following additions were made:
- $SIVE (-5.36%) 1,500
- $AAOI (-6.18%) 50
- $XFAB (-2.72%) 400
- $SHT B (+1.11%) 750
I didn’t quite time the entries perfectly in some cases, but let’s see what happens over the next few months and in 2027/2028. I’m curious to see how it goes.
In addition, the following stocks are on my shortlist for future purchases:
Have a nice evening, everyone!
66
6 Comments

I think the Switch is a little too aggressive. Good luck anyway 💯
•
99
•
4Mon·
🇪🇺 Has Europe missed the AI boat?
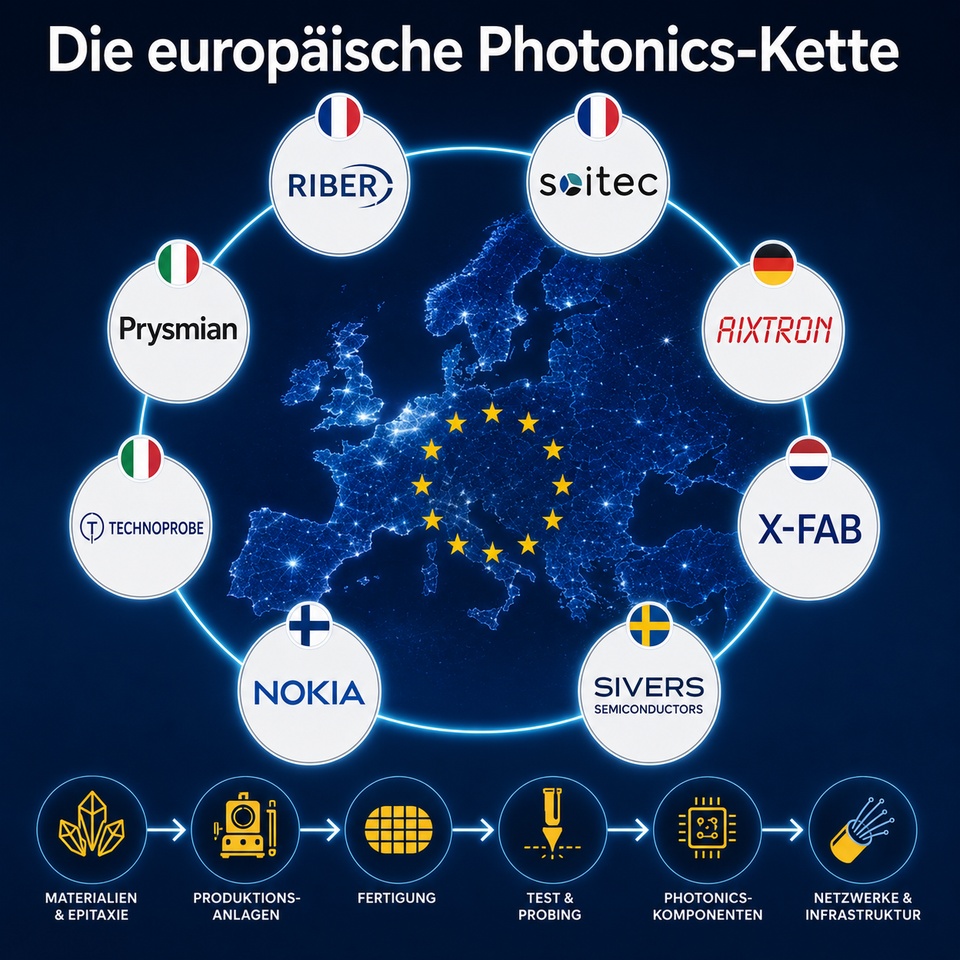
Probably not. Perhaps a European photonics cluster. When people talk about AI, it’s usually about NVIDIA, data centers, or the next language models. At the same time, something exciting has happened in Europe: In the planned Chips Act 2.0 , photonics has been explicitly named for the first time as a strategic field of the future.
This comes as no surprise. After all, modern AI systems need more than just computing power. Above all, they must process ever-larger amounts of data quickly, reliably, and energy-efficiently. This is precisely where a future infrastructure bottleneck could emerge.
What I find exciting is that (with the exception of X-Fab and Nokia) my own portfolio and, to some extent, the bottleneck wikifolios already include several European companies that together almost form a complete photonics value chain :
🇫🇷 Riber
$ALRIB (-3.2%)
MBE systems for the production of highly specialized III-V semiconductors.
🇫🇷 Soitec
$SOI (-5.88%)
Specialty substrates and wafer technologies as the foundation for photonic integration.
🇩🇪 Aixtron
$AIXA (-5.32%)
Production equipment for InP, GaN, and other photonics applications.
🇳🇱 X-Fab
$XFAB (-2.72%)
European foundry expertise for sensor technology and photonic applications.
🇸🇪 Sivers Semiconductors
$SIVE (-5.36%)
Photonics and high-frequency chips for data transmission.
🇮🇹 Technoprobe
$TPRO (-9.95%)
Probe cards and test solutions for increasingly complex semiconductor structures.
🇫🇮 Nokia
$NOKIA (-1.27%)
Optical networking technologies for the next generation of data transmission. The acquisition of Infinera makes Nokia an increasingly relevant European player in the field of optical networking.
🇮🇹 Prysmian
$PRY (-3.75%)
Fiber-optic infrastructure as the physical backbone of digital data transmission.
Taken individually, some of these companies seem rather unremarkable. Taken together, however, they tell a different story. Not that of a continent that has fallen behind. But rather the story of a potential European photonics ecosystem in the making.
Whether this will actually give rise to global champions, no one knows today. But that is exactly where I look for bottlenecks: one level below the obvious winners. Where new technologies are made possible in the first place.
⚠️ Not investment advice.
2828
15 Comments
4Mon
I’ve also been reallocating my portfolio over the last few days… and invested in $SIVE, $XFAB, and $AAOI. I also invested in a smaller, lesser-known small-cap company called $SHT B. They have a partnership with $HEN.
I also find$NOKIA very interesting… Thanks for your research! I’ll take a look at the other stocks as well. 🙂
I also find$NOKIA very interesting… Thanks for your research! I’ll take a look at the other stocks as well. 🙂
•
33
•
5Mon·
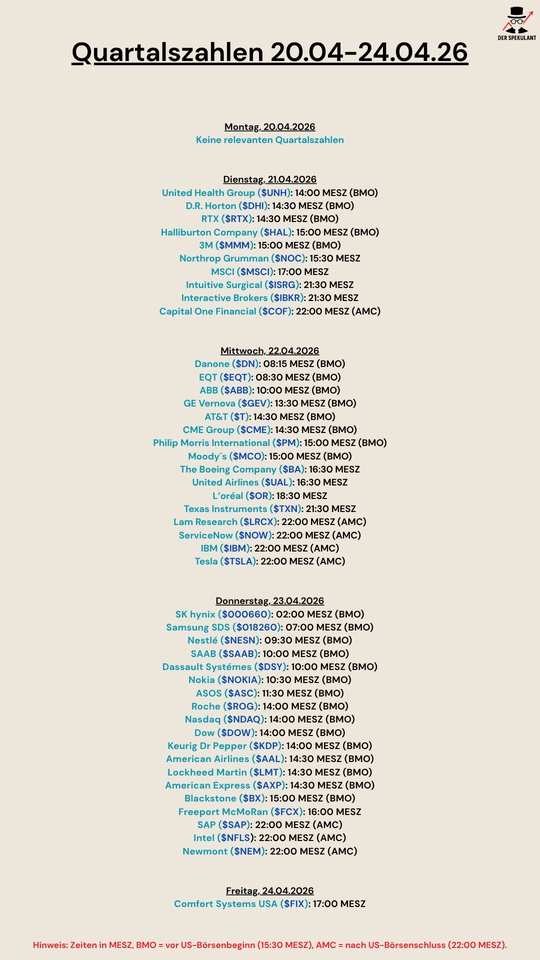
Quarterly figures 20.04-24.04.26
$UNH (+3.51%)
$DHI (+3.53%)
$RTX (-0.34%)
$HAL (-1.41%)
$MMM (+0.54%)
$NOC (+0.66%)
$MSCI (+1.47%)
$IBKR (-0.26%)
$ISRG (+1.42%)
$COF (+1.29%)
$BN (+1.83%)
$EQT (-1.26%)
$ABBN (-2.7%)
$GEV (-3.15%)
$T (+1.71%)
$CME (+1.18%)
$PM (-2.68%)
$MCO (+2.75%)
$BA (+0.81%)
$UAL (+0.56%)
$OR (+3.6%)
$TXN (-2.2%)
$LRCX (-5.06%)
$NOW (+5.24%)
$IBM (+1.55%)
$TSLA (-2.3%)
$000660
$018260
$NESN (+2.79%)
$SAAB B (+3.67%)
$DSY (+2.95%)
$NOKIA (-1.27%)
$ASC (+3.1%)
$ROG
$NDAQ (+1.03%)
$DOW (+1.17%)
$KDP (+1.46%)
$AAL (-0.05%)
$LMT (+1.3%)
$AXP (+0.82%)
$BX (+1.91%)
$FCX (-1.43%)
$SAP (+1.8%)
$INTC (-4.43%)
$NEM (+2.29%)
$FIX (-6.06%)
1212
7Mon·
Company presentation: 🚁 Ondas Holdings, Inc. - Autonomous Systems & Future of Infrastructure (Deep Dive)
Dear Community,
After $ONDS (+1%) joined our community project last Tuesday Tenbagger der Zukunft and is often used as discussion material in the community anyway, I would like to introduce the company to you below. I am gradually approaching the scope of a deep dive. :)
I look forward to your feedback!
__________________________
🏢 Short description
Ondas Holdings is a provider of autonomous drone and robotic systems (Ondas Autonomous Systems) and private wireless network solutions (Ondas Networks). The products (such as the Optimus or Iron Drone platforms) are primarily aimed at safety-critical areas, defense, rail transport and critical infrastructure. Most recently, the company has benefited massively from the global increase in demand for drone defense and autonomous surveillance systems.
_________________________
🏢 1. company data
- Founded: 2012 (as American Robotics & Ondas Networks).
- Headquarters: Waltham, Massachusetts (USA).
- Industry: Robotics / autonomous systems & wireless networks.
- Business model: Ondas provides a vertical platform for industrial drones (Ondas Autonomous Systems) and private, highly secure wireless networks (Ondas Networks) for critical infrastructure such as rail transportation and utilities.
- Employees: Approx. 150-200 (strong focus on R&D).
_________________________
📈 2. finances & company value (as of Q3 2025)
- Market capitalization: Approx. USD 5.1 bn.
- Revenue growth (YoY): +582 % (increase to USD 10.1 million in Q3).
- Explanation: The percentage increase in sales compared to the same quarter of the previous year. An indicator of extreme scaling.
- Net cash (net liquidity): USD 433.4 million (pro forma after capital increases up to USD 840.4 million).
- Explanation: Cash and cash equivalents less current liabilities. A buffer for acquisitions and operations.
- Orders on hand (backlog): USD 23.3 million.
- Explanation: The value of orders that have not yet been processed but are already fixed.
- Gross margin: 26 %.
- Explanation: Proportion of sales remaining after deduction of direct manufacturing costs (COGS).
- Operating margin (EBIT): -153 %.
- Explanation: Indicates operating profitability; shows the high level of investment in growth and development.
_________________________
📊 3. valuation ratios (Is the share expensive or cheap?)
- P/E ratio (price/earnings ratio): Negative / Not applicable.
- Explanation: Shows how many years it will take for the company to generate its market value as profit. As Ondas is still unprofitable (net loss in Q3: USD 7.5 million), there is no value here.
- P/S ratio (price/sales ratio): approx. 142.
- Explanation: puts the market capitalization (currently approx. USD 5.1 billion) in relation to annual sales (forecast for the full year 2025: at least USD 36 million). An extremely high value, which shows that the market is already pricing in massive future growth.
- EV/EBITDA & PEG ratio: Negative / Not applicable.
- Explanation: EV/EBITDA adjusts the valuation for debt/cash, the PEG ratio puts the P/E ratio in relation to earnings growth. As Ondas is still burning cash operationally, these metrics do not (yet) apply here.
_________________________
💰 4. profitability & margins (how efficient is the company?)
- Gross margin (gross margin): 26% (as at Q3 2025).
- Explanation: Shows how much of revenue is left over after deducting direct production costs (Q3: USD 2.6 million profit on USD 10.1 million revenue). Management is aiming for 50% in the long term.
- Operating margin (EBIT margin): Strongly negative (-153 % in Q3).
- Explanation: What is left after deducting all running costs? Ondas had an operating loss of USD 15.5 million in Q3. The massive growth causes high costs.
- ROIC (Return on Invested Capital) & FCF margin: Negative.
- Explanation: ROIC shows the return on invested capital, the FCF margin shows the percentage share of hard cash flow in sales. The company is in an extreme growth and investment phase and is still burning cash in its operations.
_________________________
🛡️ 5. Balance sheet quality & financial health (How secure is the company?)
- Net cash (net liquidity): Excellent. Cash balance of USD 433.4m (as of Q3 2025).
- Explanation: Does the company have more cash than debt? Yes! After further capital increases in October 2025, the pro forma cash balance was even a gigantic USD 840.4 million.
- Equity ratio & debt-to-equity (debt-to-equity ratio): Very much improved.
- Explanation: Shows the ratio of own funds to borrowed funds. Ondas raised around USD 855 million in 2025 by issuing new shares (equity) and simultaneously reducing convertible bonds. The balance sheet is now extremely solid.
- Current ratio: Extremely high.
- Explanation: Can current liabilities be covered by current assets (cash)? (Should be >1). Thanks to the massive cash injection, Ondas is completely on the safe side here.
_________________________
🚁 6. specific industry key figures (growth & order situation)
(As Ondas is not a cloud/SaaS provider, we look at industry metrics instead of "Rule of 40" or "NRR")
- Revenue growth (YoY): +582 % (Q3 2025).
- Explanation: The percentage growth compared to the same quarter last year. Sales exploded from USD 1.5 million to USD 10.1 million.
- Orders on hand (backlog): USD 23.3 million (as at Q3 2025).
- Explanation: The value of orders that have already been signed but not yet processed. A key indicator for predictable future sales (has more than doubled since the beginning of 2025).
________________________
⚔️ 7. Overview of competitors
The market for autonomous drones and security solutions is competitive. The most important competitors include:
- Skydio: A US leader in autonomous drones for inspections.
- AeroVironment $AVAV (-0.23%)
: Strong in the defense sector (switchblade drones). - Fortem Technologies: Specialized in drone defense (counter-UAS), similar to parts of the Ondas portfolio.
- Radio communications (networks): Here Ondas competes with industry giants such as Nokia
$NOKIA (-1.27%) or Ericsson $ERIC B (+9.12%) which also offer private LTE/5G networks for critical infrastructure.
_________________________
💡 8. unique selling propositions (USPs)
Why could Ondas have a "moat"?
1. Full-stack integration: While many competitors only provide the drone (hardware), Ondas offers a "Robot-as-a-Service" (RaaS) model. This includes the drone, the docking station, the analysis software package and the private wireless network.
2. FAA approvals: Ondas is one of the few companies to have received wide-ranging approvals from the US Federal Aviation Administration (FAA) for fully automated flight beyond visual line of sight (BVLOS) - a crucial regulatory advantage.
3. Focus on "mission critical": Unlike hobby drones, Ondas systems are certified for permanent use in hazardous or highly sensitive industrial environments (e.g. chemical plants, railroad tracks).
4. Frequency expertise: Through the acquisition of Sentrycs and the experience at Ondas Networks, the company has deep expertise in proprietary radio communications, making the systems more tamper-proof.
_________________________
⚙️ 9. Opportunities and risks
🟢 Opportunities:
The addressable market for automated defense systems and infrastructure monitoring is growing rapidly. With over USD 800 million in cash and cash equivalents, Ondas now has the necessary "war chest" to quickly gain market share through acquisitions (e.g. Apeiro Motion, Sentrycs) and scaling. The sales target for 2026 is already an ambitious USD 110 million.
🔴 Risks:
The current market capitalization of over USD 5 billion is in extreme contrast to the actual turnover (KUV of >140). Perfect execution for the next few years is already priced in here. In addition, the massive capital increases have led to strong dilution for existing shareholders.
_________________________
Sources:
- Company financials (Q3 2025): Official SEC filings (Form 10-Q) of Ondas Holdings Inc. and the related Earnings Call Transcript dated November 13, 2025 (via Investing.com and ir.ondas.com).
- Market data & key figures: Current share price data, market capitalization and historical trends based on TradingView and Macrotrends.
- Competitor analysis: Company portraits and stock market status (AeroVironment, Nokia, Ericsson) via Wikipedia, Simply Wall St and official investor relations pages.
- Market context & USPs: Industry analysis and competitive advantages (e.g. FAA approvals, counter-UAS focus) via , among others. Nasdaq.com.

6363
26 Comments
Thank you. I'm a big fan of the company. In my view, the acquisitions have turned them into a full-service provider that covers the entire value chain. It therefore has a much broader base and much more potential than $DRO, for example. My individual position is now at €4.85 and I also have a savings plan in place. When I entered the stock for the first time, the EK was €3.40. I then sold at just under €10. In the medium term, I see the chance of a tenbagger, i.e. prices around 50$. But there will always be many days like Friday. 10% up or down is normal on any given day.
•
1313
•Trending Securities
Top creators this week
Real-time data from LSX · Fundamentals & EOD data from FactSet