

$ABBN (-0.83%)
$GE
$RTX (-0.26%)
$HAL (-1.4%)
$MMM (-1.33%)
$NOC (-0.53%)
$MSCI (-0.71%)
$ISRG (+1.59%)
$SPCX (+1.66%)
$NFLX (-0.8%)
$DB1 (-0.47%)
$CME (+0.6%)
$T (-0.96%)
$PM (-1.51%)
$MCO (-0.81%)
$NEE (-1.83%)
$UAL (-0.47%)
$MONC (-1.56%)
$TXN (-0.06%)
$META (-0.31%)
$IBM (+2.26%)
$SAP (+1.3%)
$QS (-3.06%)
$LRCX (+2.9%)
$TSLA (+4.51%)
$RMS (+0.41%)
$NESN (+0.32%)
$BARC (-3.61%)
$ROP (+0.69%)
$DOW (+0.6%)
$SPOT (-1.59%)
$NDAQ (-0.54%)
$AAL (-1.43%)
$LMT (+0.1%)
$PG (-0.45%)
$BX (+0.67%)
$BESI (+3.67%)
$VLO (-1.45%)
$KER (-0.05%)
$OR (-0.6%)
$VRSN (+1.62%)
$WDC (+6.61%)
$BE (+3.15%)
$NEM (-0.08%)
$TOM (+1.85%)
$AXP (+1.44%)
$FIX (+2.55%)
- Markets
- Stocks
- BE Semiconductors
- Forum Discussion

BE Semiconductors
Stock
Stock
ISIN: NL0012866412
Ticker: BESI
NL0012866412
BESI
Price
Discussion about BESI
Posts
251D·
Quarterly Results: Oct. 19–23, 2026
99
1Mon·
📊 My Portfolio Update: August 2026
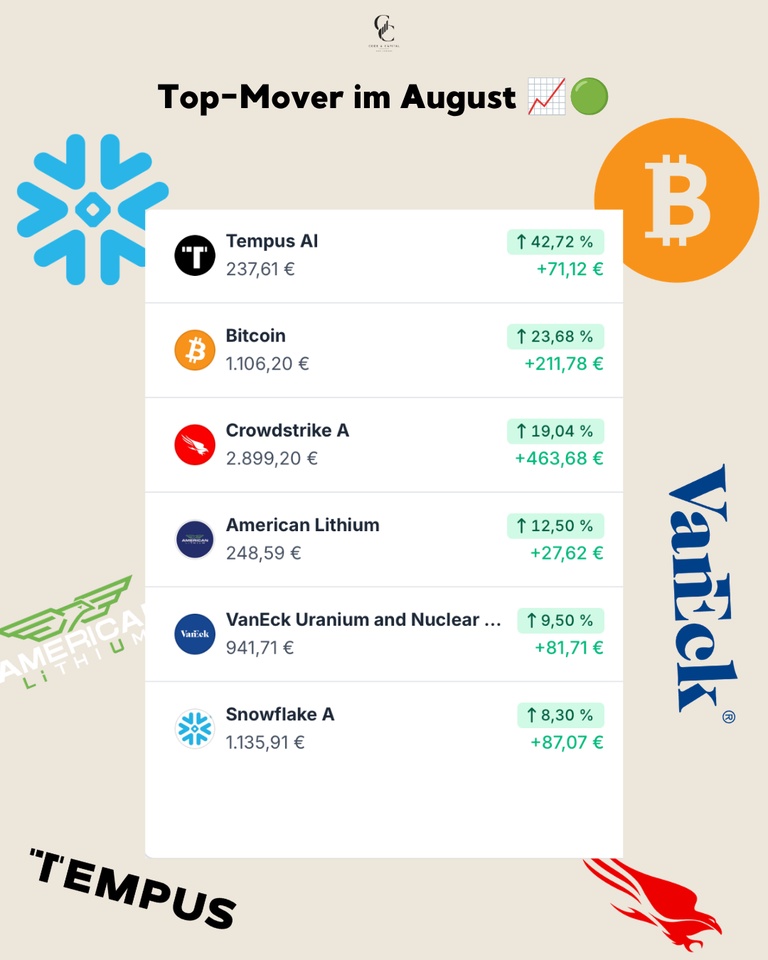
In July, Tempus AI was my biggest loser, down 25 percent. In August, it was my biggest winner, up 42 percent. I didn’t buy or sell anything in either month.
August had two sides to it. At the beginning of the month, mild inflation data was released, and the S&P 500 hit an all-time high of 7,816 points on August 13. After that, sentiment in the bond markets shifted. The 30-year U.S. Treasury yield rose to its highest level in nearly twenty years, and U.S. gross debt exceeded forty trillion dollars. At the end of the month, Nvidia reported quarterly revenue of 96.2 billion, an increase of 106 percent. The very next day, Fed Chair Warsh signaled a pause in Jackson Hole, and the market priced in an interest rate hike in September.
Following the chip sell-off in July, this was a significantly calmer month for my portfolio:
📊 Monthly performance: +3.15%
📊 Portfolio value: ~€45,506
📊 Max. performance (Jan. 6, 2022): +40.28%
📊 YTD performance: ~+11.88%
Performance & Comparison 🚀
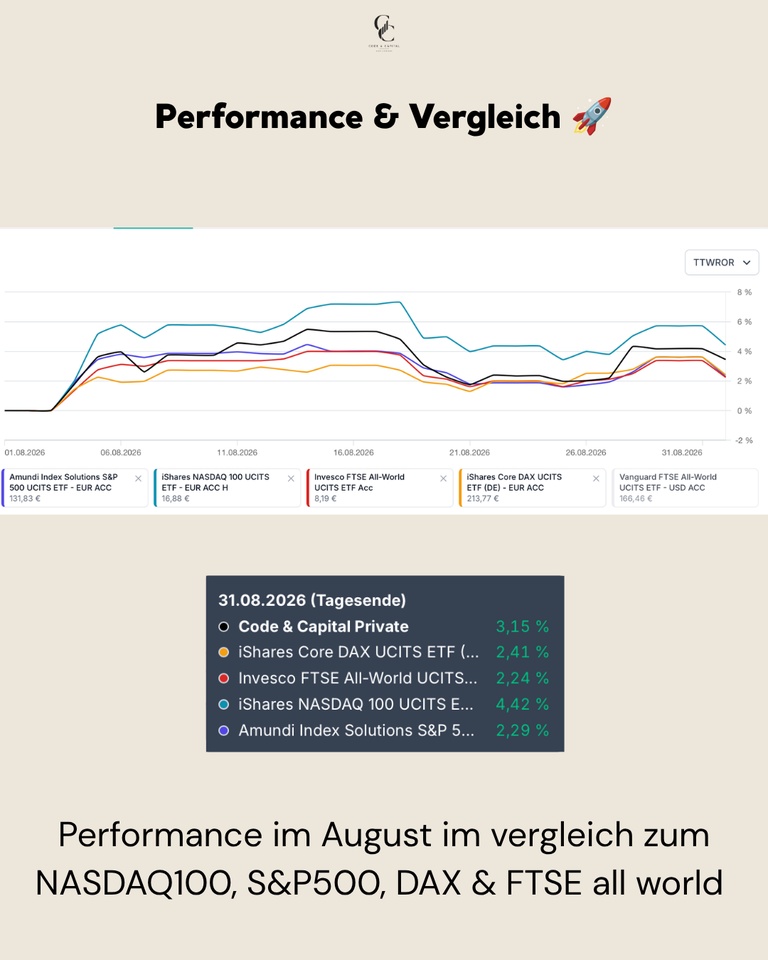
August was a positive month for all major indices, led by the Nasdaq. My portfolio outperformed the DAX, S&P, and FTSE, but lagged behind the Nasdaq.
Performance Comparison (August 1–31, 2026, end of day):
My portfolio: +3.15%
NASDAQ 100: +4.42%
DAX: +2.41%
S&P 500: +2.29%
FTSE All-World: +2.24%
Purchases, Sales & Allocation 💶
None. In July, I reduced my cash position and invested in BE Semiconductor$BESI (+3.67%) , Solaria $SLR (-5.84%) and Hermès $RMS (+0.41%) . I didn’t make any changes in August.
Top Movers in August 🟢
Tempus AI $TEM (-0.27%) posted the strongest gain at +42.72% (+71.12 €), marking a strong rebound following the July slump. Bitcoin $BTC (+0.97%) rose by +23.68% (+€211.78). CrowdStrike $CRWD (+0.62%) rose by +19.04% (+€463.68), making it the biggest euro gain in the portfolio; cybersecurity performed well in August regardless of the chip cycle. American Lithium gained +12.50% (+€27.62), while the VanEck Uranium and Nuclear ETF $NUKL (+0.09%) rose by +9.50% (+81.71 €). Snowflake $SNOW (+2.74%) rounded out the list with a gain of +8.30% (+€87.07).
August’s Worst Performers 🔴
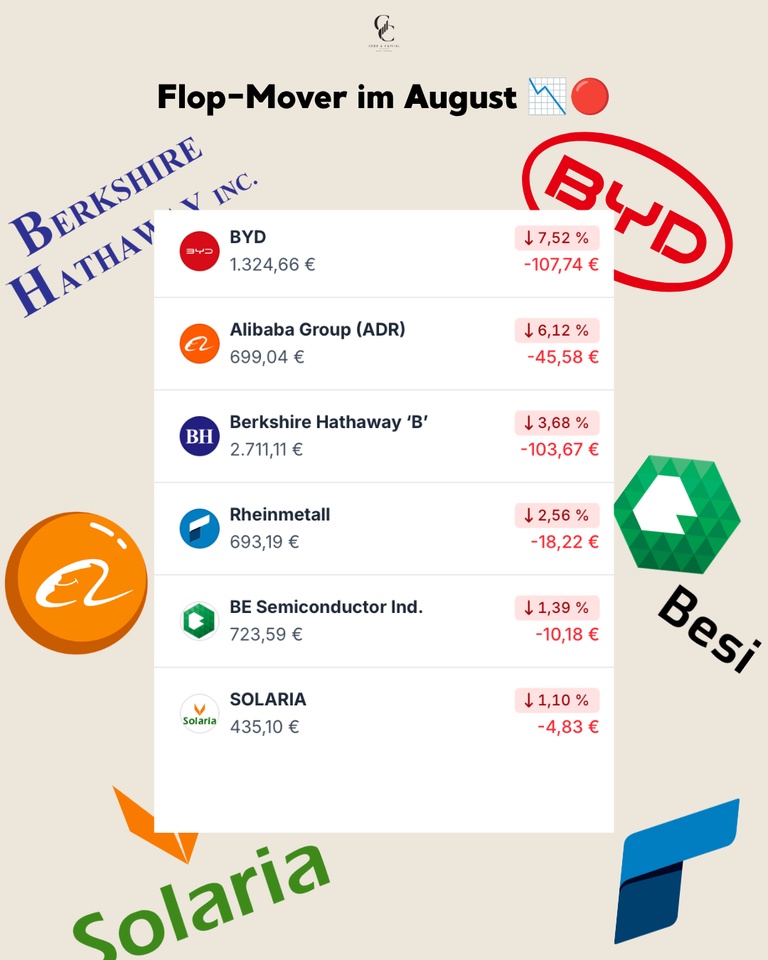
The losses were significantly smaller than in the previous month. BYD $1211 (-0.5%) fell -7.52% (-€107.74), taking a breather after a 27 percent gain in July. Alibaba $BABA (-0.41%) followed with a -6.12% drop (-€45.58); here, too, the China rally from July ran out of steam. Berkshire Hathaway $BRK.B (+0.32%) fell -3.68% (-103.67 €), and Rheinmetall $RHM (-2.83%) -2.56% (-€18.22). BE Semiconductor $BESI (+3.67%) fell by only -1.39% (-€10.18) and has stabilized following the slump in July. Solaria $SLR (-5.84%) closed down 1.10% (-€4.83).
Conclusion 💡
July was a month in which a lot happened. August was the month in which much of that reversed. Tempus AI $TEM (-0.27%) went from the biggest loser to the biggest winner, while BYD $1211 (-0.5%) and Alibaba $BABA (-0.41%) the other way around. Anyone who had sold in a panic in July would have been on the wrong side of the market in August.
❓ Question for the Community
Did the market fluctuations in August make you get cold feet, or did you hold onto your positions? And what was your best buy?
👇 Share your thoughts in the comments!
➡️ Every month, I post a portfolio update here, along with research from my quantitative model in between.
🗞️ Newsletter: codeandcapitalquant.beehiiv.com
📈 Wikifolio: https://www.wikifolio.com/de/de/w/wf0gquant6

+ 1
1111
2Mon·
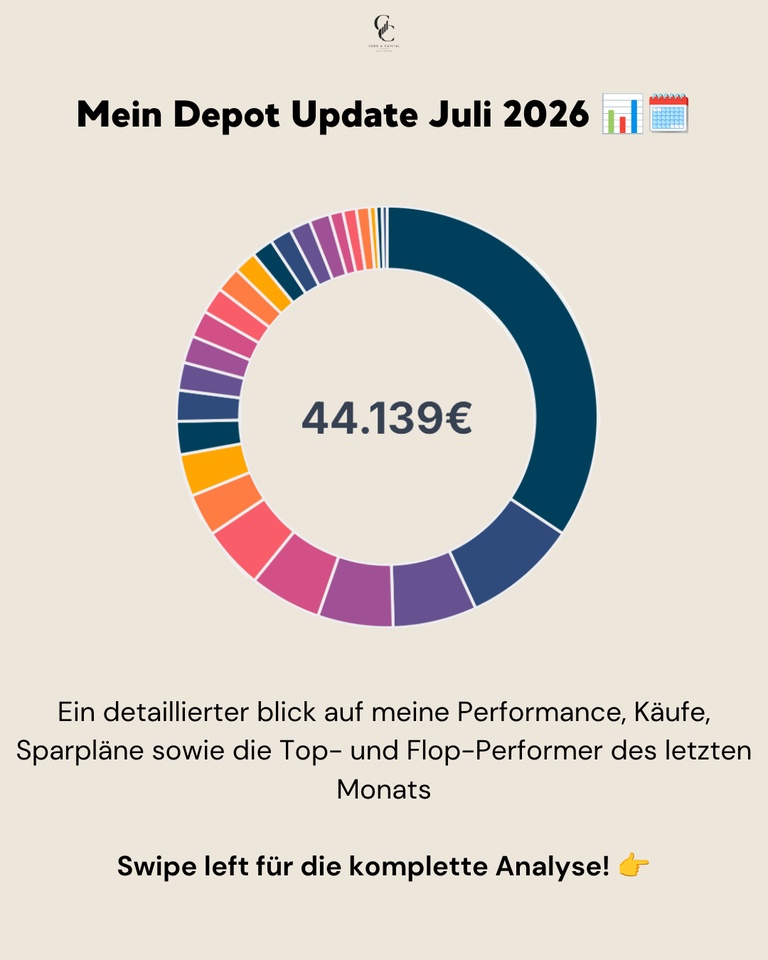
📊 My Portfolio Update: July 2026
July was a month of contrasts. The Nasdaq slipped into its second correction of 2026, triggered by a sharp sell-off in semiconductor stocks—memory chip manufacturers and chip equipment suppliers saw losses, in some cases in the double digits, and even strong quarterly results were no longer enough to prop up share prices. The DAX, on the other hand, hit new record highs during the same period, driven by software stocks and a rebound at Rheinmetall. At the same time, a significant amount of capital rotated out of AI and chip stocks and into Chinese tech and electric vehicle stocks, which staged a strong comeback after months of decline.
My portfolio benefited from this rotation and is back in the black:
📊 Monthly performance: +1.02%
📊 Portfolio value: ~€44,139
📊 Peak performance (Jan. 6, 2022): +43%
📊 YTD performance: ~+14.09%
Performance & Comparison 🚀
July demonstrated how differently the indices could perform depending on their composition. While the Nasdaq suffered from the chip sell-off, the DAX benefited from its lower concentration of semiconductor stocks and the Rheinmetall recovery. My portfolio tracked the DAX more closely than the Nasdaq and ended the month in positive territory.
Performance Comparison (July 1–July 31, 2026, end of day):
My portfolio: +1.02%
DAX: +2.57%
S&P 500: -1.25%
FTSE All-World: -1.47%
NASDAQ 100: -6.97%
Purchases, Sales & Allocation 💶
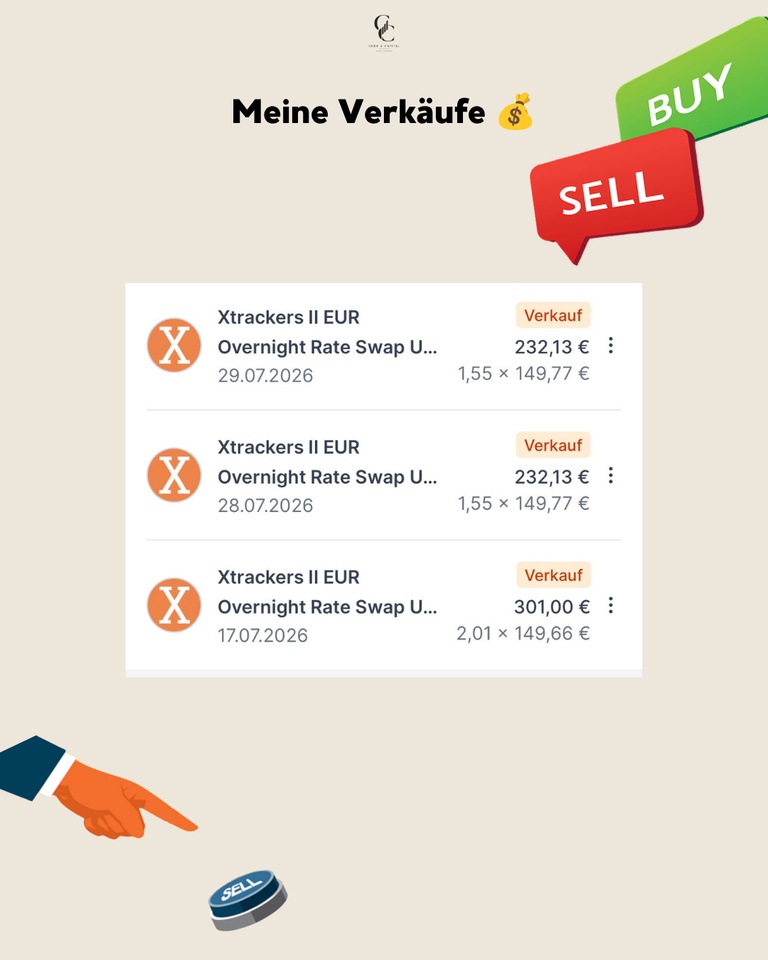
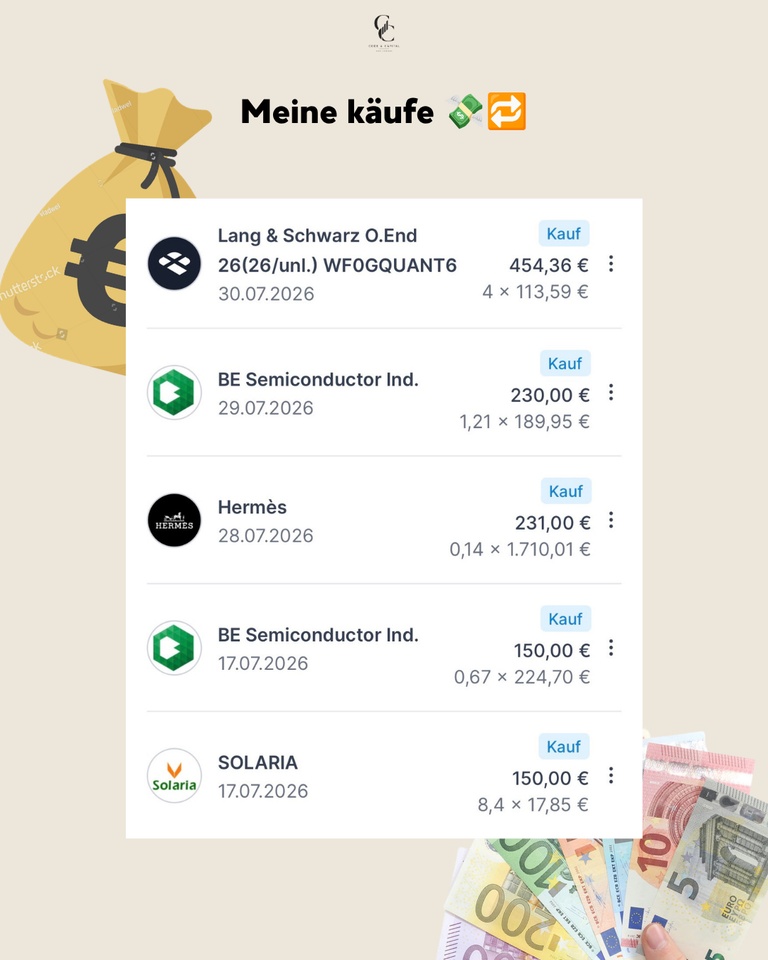
In July, I reduced my cash position. The Xtrackers II EUR Overnight Rate Swap ETF, which I had been using to park liquidity, was sold in three tranches: €301.00 on July 17, and €232.13 each on July 28 and July 29—totaling approximately €765. The freed-up funds were immediately allocated to three positions: BE Semiconductor Ind. $BESI (+3.67%) I increased my position in two steps: €150.00 on July 17 and €230.00 on July 29. For Solaria $SLR (-5.84%) , I added another €150.00 on July 17, and for Hermès $RMS (+0.41%) on July 28. In doing so, I deliberately reallocated cash into stocks rather than injecting new capital.
Additionally, on July 30, I invested €454.36 in my own Wikifolio certificate $DE000LS9V052 (+1.22%) —a private position separate from the rest of my portfolio.
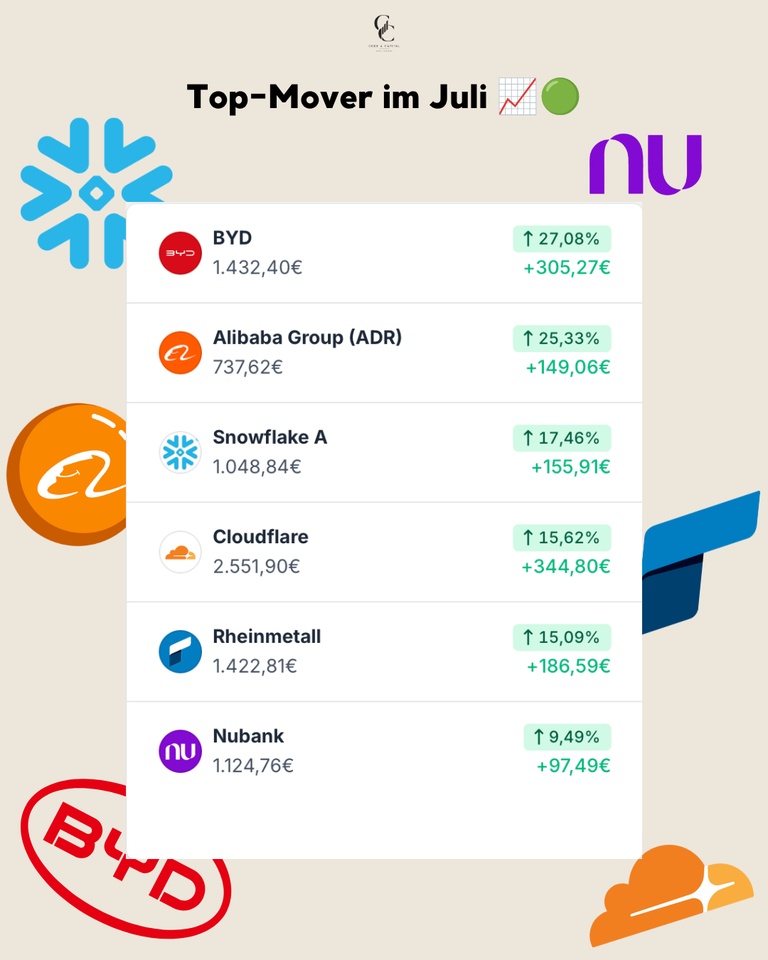
Top Movers in July 🟢
The month clearly belonged to stocks that benefited from the rotation out of U.S. tech.
BYD posted the strongest gain at +27.08% (+€305.27). The stock received a double boost: capital flowed from AI and chip stocks into Chinese electric vehicle stocks, and BYD also reported $1211 (-0.5%) reported a nearly 22% jump in sales for July and more than a doubling of overseas deliveries. Alibaba $BABA (-0.41%) followed suit with a gain of +25.33% (+€149.06)—part of the same China-led rally that also swept up Tencent and Xiaomi. Snowflake $SNOW (+2.74%) rose by +17.46% (+€155.91) and Cloudflare $NET (+1.23%) by +15.62% (+344.80 €), the largest euro gain in the portfolio—both software stocks fared significantly better than hardware and chips in the rotation. Rheinmetall $RHM (-2.83%) rebounded by +15.09% (+€186.59) from its 52-week low following the frigate shock in June, supported by full order books and rising defense budgets in Europe. Nubank $NU (-0.39%) rounded out the list with a gain of +9.49% (+€97.49)—here, too, the rotation away from U.S. tech toward other regions played a role.
July’s Big Losers 🔴
On the other hand, the list consisted almost exclusively of stocks that were directly or indirectly hit by the chip sell-off.
Tempus AI $TEM (-0.27%) suffered the biggest loss at -25.08% (-€55.74)—AI-related stocks came under particular pressure during the broad sell-off. IREN $IREN (+2.53%) fell by -20.39% (-€179.15) and has remained weak since the price slump in early summer, still weighed down by the combination of Bitcoin weakness and skepticism regarding its transition to an AI cloud provider. BE Semiconductor Ind. $BESI (+3.67%) fell by -18.77% (-€169.56), directly impacted by the global sell-off among chip equipment manufacturers. TSMC $TSM (+1.09%) lost -15.04% (-€80.55)—despite a strong quarter, the stock was swept up in the general semiconductor correction. Hermès $RMS (+0.41%) dropped -10.27% (-24.26 €), with luxury goods following the downward trend of weaker growth stocks. Solaria $SLR (-5.84%) rounded out the list with a -9.50% (-€46.19) decline—solar and renewable energy stocks remain under pressure.
Conclusion 💡
July showed just how quickly capital flows can shift. While the chip sector underwent one of the sharpest corrections of the year, Chinese tech and electric vehicle stocks found their bottom. For my portfolio, this was a good example of why broad diversification across sectors and regions makes all the difference.
❓ Question for the Community
That was my month in numbers—how did the July chip sell-off affect you? Did you rotate into Chinese stocks, or are you holding onto your U.S. tech positions?
👇 Let us know in the comments!
➡️ Follow @codeandcapital26 for transparent portfolio updates!
🗞️ Newsletter: codeandcapitalquant.beehiiv.com
📈 Wikifolio: https://www.wikifolio.com/de/de/w/wf0gquant6
+ 2
66
10 Comments
S.A.U.@SAUgut777
2Mon
•
33
•View all 9 further answers

3Mon·
🏗️ Introduction: Euro AI Backbone Wikifolio ⚡⚙️
Dear Community,
To kick off the week, I’d like to introduce you to my “Pick-and-Shovel” wikifolio “Euro AI Backbone” (in German: Backbone). More detailed information will follow; for now, this is just a rough overview.
_________________________
Background
The market’s focus is primarily on the U.S., while Europe often plays a more subordinate role. Yet recent years in particular have made it clear just how dependent Europe is on other countries such as the U.S., Russia, and China.
By the time the “Orange Man” began his second term, it had become clear:
Europe must become more independent —not only in the field of defense but also in the field of AI.
For nearly five years, Goldman Sachs has maintained an index called “EU AI Capex,” which consists of 64 European stocks. This served as the blueprint for my wikifolio.
The wikifolio was launched on June 18, 2026. For the wikifolio to receive “Investable” status, it needs, among other things, 10 bookmarks. So I’d really appreciate it if you could click “Add to Watchlist” on the wikifolio—thanks in advance.
_________________________
The “Pick-and-Shovel” Approach
The wikifolio aims to cover as much of the value chain for operating modern artificial intelligence as possible.
The focus here is primarily on five areas:
- The Shovels: Semiconductors and machinery (e.g., lithography systems, wafer deposition, chip assembly)
- The Gas: Electricity and energy generation (e.g., wind power, hydroelectric power, solar power plants)
- Highways: Networks and cables (e.g., transformers, high-voltage undersea cables, power grid infrastructure, transmission lines)
- The brain: Automation and data center cooling (e.g., liquid cooling, power distribution cabinets, data networks, control systems)
- The Physical Foundation: Construction, emergency power, and security (e.g., construction of the facilities, emergency power generators, cybersecurity)
_________________________
Investment Universe
The portfolio includes European large-, mid-, and small-cap stocks.
Focus: Technology (semiconductor equipment), utilities (electricity, grids), and industrials (automation, specialty cables, data center construction, cybersecurity).
The Core: European market leaders with global monopolies and competitive moats.
The Tech Specialists: Profitable second-tier suppliers as yield boosters.
The foundation: Energy producers, grid operators, and construction specialists for stable cash flows and risk hedging.
Regular rebalancing, which typically takes place at the beginning of each month, prevents concentration risk. While the foundation remains unchanged, the weightings of individual securities may be adjusted. The replacement of individual stocks, the addition of new stocks, or the exclusion of individual stocks can also take place at the beginning of the month.
Initially, the portfolio consists of 37 stocks. There is no cash reserve.
The current allocation of holdings is as follows:
By sector:
- Industrial: 44%
- Utilities: 29%
- Technology: 26%
- Consumer Discretionary: 1%
By country:
- Germany: 24%
- United Kingdom: 14%
- Switzerland: 13%
- Netherlands: 12%
- France: 12%
- Spain: 10%
- Italy: 9%
- Denmark: 2%
- Finland: 2%
- Austria: 2%
Investments are made exclusively in European stocks. None ETFs, no investment certificates, no funds, no leveraged products.
_________________________
Initial Holdings
At the start, the portfolio comprises the following 37 securities, sorted by their current weighting:
Infineon $IFX (+0.64%) , ASML Holding $ASML (+0.84%) , Siemens $SIE (-0.92%) , Enel $ENEL (-2.02%) , Rolls-Royce $RR. (-1.28%) , Schneider Electric $SU (-1.84%) , Iberdrola $IBE (-1.74%) , ABB $ABBN (-0.83%) , VAT Group $VACN (+2.35%) , Siemens Energy $ENR (-0.79%) , Prysmian $PRY (-0.98%) , ASM International $ASM (-0.2%) , BE Semiconductor Industries $BESI (+3.67%) , STMicroelectronics $STM (+0.25%) , RWE $RWE (-3.02%) , E.ON $EOAN (-1.67%) , Legrand $LR (-1.28%) , National Grid $NG. (-1.52%) , Nokia $NOKIA (-0.27%) , SSE $SSE (-1.8%) , EDP Renovaveis $EDPR (-2.85%) , Hochtief $HOT (+0.73%) , Red Eléctrica de España $RED (-2.36%) , Nexans $NEX (-3.01%) , United Utilities $UUGRY (-1.42%) , Enagas $ENG (-0.12%) , Centric $CENTR (+0.39%) , Spirax-Sarco Engineering $SPX (+1.14%) , Soitex $SOI (+1.15%) , Geberit $GEBN (+0.51%) , Aixtron $AIXA (+0.48%) , Orsted $ORSTED (-2.29%) , Verbund $VER (-0.87%) , SAFRAN $SAF (-0.32%) , Thales $THALES (+1.6%) , NKT $NKT (-0.86%) , Andritz $ANDR (-0.81%)
_________________________
Holding Period
Since infrastructure development is likely to continue for several more years, the holding period is clearly geared toward the long term. Short-term trading is avoided.
_________________________
Sources of Information
The following sources of information are primarily used to identify stocks:
Companies’ quarterly reports and financial statements.
Analyst reports and industry studies from global investment banks.
Business media and financial publications.
_________________________
I’m curious to see how the portfolio will perform over the long term. Monthly updates will keep you informed.
www.wikifolio.comEuro AI Backbone
99
7 Comments
3Mon
Good luck, Mikey—I'm curious to see how the EU AI Wiki does. Just a quick side note... The Wikifolio won't be "investable" until it has successfully gone through the issuance process ;-) But it'll all work out :-)
•
44
•4Mon·
🏗️🔋Euro AI Backbone - My Bet on Europe's AI Backbone 🎲
Dear Community,
Throughout last year, I found myself repeatedly wanting to focus on the European market as well. But the same old arguments kept dissuading me: The European market doesn’t deliver; Europe doesn’t meet my desire for a growth-oriented, high-yield portfolio, etc.
I also asked myself: Which sectors and industries do I want to cover? Where do I see enough potential to justify taking the risk? To what extent do I want to align my portfolio with this strategy?
In today’s episode, Alles auf Aktien: Fiese Gewinnwarnung bei BMW und Europas KI-Unabhängigkeitsaktien , something caught my attention:
A basket from Goldman Sachs, consisting of 64 European stocks, with the wonderful name: EU AI Capex.
Performance over the past five years: 17.5 percent annualized, including dividends.
_________________________
And which industries are covered?
- Semiconductors
- Machinery
- Electricity
- Networks
- Cables
- Energy
- Automation
Unfortunately, existing ETFs such as the iShares STOXX Europe 600 Utilities UCITS ETF or the iShares STOXX Europe 600 Technology UCITS ETF do not cover all of these sectors.
"Sounds exactly like what I was looking for," I thought to myself, and used my day off today to create an index tailored to my preferences.
Goldman Sachs has listed 12 of the 64 holdings, including their percentage allocations. The remaining 52 holdings appear to be known only to institutional investors, as the index isn’t publicly available.
So I created my own “Pie” through Trading 212. More specifically, a “Pie” is a personalized investment portfolio in which I can invest in multiple stocks and ETFs according to a percentage allocation I set myself and save toward them simultaneously via a single automated savings plan—with no expense ratio and no order fees.
It would go beyond the scope of this post to write about every individual security, which is why I chose this particular one. I didn’t make these decisions entirely on my own. Gemini helped me with this. In the end, we settled on 37 securities.
_________________________
On Selecting the Holdings
Together, we gradually added European market leaders across the entire value chain. We always kept an eye on the sectors—none should be left out.
_________________________
On the Percentage Allocation
It’s important to note upfront that the “pie” will be funded with 150 euros per month going forward. Since the minimum investment amount at Trading 212 is one euro, the smallest weighting in the “pie” must be at least 0.7%:
1.00 euro / 0.70% = 142.85 euro
The percentage allocation was then based on pricing power and global scalability.
More details on this may follow in a later post.
_________________________
About the Stocks
From EU AI Cortex Basket taken over by Goldman Sachs:
- Infineon ($IFX (+0.64%)): 7.10%
- ASML ($ASML (+0.84%)): 6.80%
- Siemens ($SIE (-0.92%)): 6.00%
- Rolls-Royce ($RR. (-1.28%)): 5.40%
- Enel ($ENEL (-2.02%)): 5.40%
- Schneider Electric ($SU (-1.84%)): 5.40%
- ABB ($ABBN (-0.83%)): 5.00%
- Iberdrola ($IBE (-1.74%)): 4.90%
- Siemens Energy ($ENR (-0.79%)): 4.70%
- ASM International ($ASM (-0.2%)): 3.70%
- Prysmian ($PRY (-0.98%)): 3.60%
- BE Semiconductor ($BESI (+3.67%)): 3.20%
Supplemented by the following stocks:
- VAT Group ($VACN (+2.35%)): 4.50%
- STMicroelectronics ($STM (+0.25%)): 2.50%
- Legrand ($LR (-1.28%)): 2.00%
- RWE ($RWE (-3.02%)): 1.95%
- Nokia ($NOKIA (-0.27%)): 1.90%
- E.ON ($EOAN (-1.67%)): 1.90%
- National Grid ($NG. (-1.52%)): 1.80%
- SSE plc ($SSE (-1.8%)): 1.70%
- EDP Renováveis ($EDPR (-2.85%)): 1.60%
- Red Eléctrica ($RDEIY (-2.03%)): 1.50%
- Nexans ($NEX (-3.01%)): 1.50%
- Hochtief ($HOT (+0.73%)): 1.50%
- Enagás ($ENG (-0.12%)): 1.40%
- United Utilities ($UU. (-1.27%)): 1.40%
- Spirax-Sarco ($SPX (+1.14%)): 1.30%
- Centrica ($CNA (-0.56%)): 1.30%
- Aixtron ($AIXA (+0.48%)): 1.30%
- Orsted ($ORSTED (-2.29%)): 1.15%
- Verbund AG ($VER (-0.87%)): 1.10%
- Soitec ($SOI (+1.15%)): 1.10%
- Safran ($SAF (-0.32%)): 1.00%
- Thales ($HO (-2.06%)): 1.00%
- Geberit ($GEBN (+0.51%)): 0.90%
- NKT A/S ($NKT (-0.86%)): 0.80%
- Andritz ($ANDR (-0.81%)): 0.70%
The figures $IG (+0.09%) , $SRG (+0.21%) , $TRN (-1.2%) , $ALFA (-0.47%) , $ATCO B (-2.03%) or $AEMMY can unfortunately only be traded via CFDs on Trading 212. Therefore, these securities could not be included.
_________________________
Trading 212 Pie
The Pie now accounts for about 10% of my portfolio, and I’ll be contributing 150 euros to it each month going forward.
I am convinced that Europe will succeed in becoming more independent. However, in my opinion, a self-sufficient Europe without any dependence whatsoever is simply not possible (keyword: globalization).
_________________________
Pie Composition
By country:
- Germany: 24.35%
- France: 15.4%
- Netherlands: 13.7%
- United Kingdom: 12.9%
- Switzerland: 10.4%
- Italy: 9%
- Spain: 7.8%
- Denmark: 1.95%
- Austria: 1.8%
- Portugal: 1.6%
By sector:
- Technology: 32.3%
- Industrial & Capital Goods: 31.5%
- Utilities & Energy Infrastructure: 36.2%
By industry:
- Semiconductors & Data Center Chips: 27.8%
- Energy Equipment & Grid Technology: 25.5%
- Electricity Generators: 16.1%
- Physical Networks & Storage: 10.1%
- Cable Infrastructure: 5.9%
- Vacuum Technology & Components: 6.5%
- Network Technology & Connectivity: 1.9%
- Data Centers & Industrial Construction: 3.1%
- Cyber and Perimeter Security: 3.1%
_________________________
I’m curious to see how the pie chart will develop.
P.S.: You can find the pie chart on Trading 212 under the name Euro AI Backbone GS to copy.
1515
2 Comments
I'm investing in the $IEFM. While it doesn't cover the sectors you mentioned, it focuses on the top performers from the past 6–12 months.
•
11
•
4Mon·
European AI “Independence”
According to Ifo President Clemens Fuest, Europe faces an “existential threat”: Europe uses AI but has virtually no infrastructure. About 75 percent of the world’s high-performance computing capacity for modern AI is located in the U.S., with China accounting for about 15 percent and the EU for less than five percent.
He is therefore calling for an emergency program that includes more data centers, chip factories, energy infrastructure, faster approvals, and, if necessary, special economic zones. Energy is becoming a strategic issue, as AI data centers require enormous amounts of reliable electricity.
A study by the American investment bank Goldman Sachs titled “The Post-Modern Cycle” describes a new investment supercycle: AI, data centers, electricity, chips, defense, and infrastructure. The digital world suddenly needs concrete, cables, transformers, and power plants.
Goldman has created a corresponding portfolio called EU AI Capex.
It comprises 64 components. It is Europe’s publicly traded bet on AI infrastructure. Over the past five years, the index has gained 124 percent including dividends, which translates to an annualized return of 17.5 percent. The Stoxx Europe 600 has only managed 64 percent over the same period—an annualized rate of 10.3 percent.
The largest holdings show what this is all about: Infineon
$IFX (+0.64%) has a weighting of 7.1 percent, ASML
$ASML (+0.84%) stands at 6.8 percent, Siemens $SIE (-0.92%) accounts for 6 percent, Rolls-Royce $RR. (-1.28%) , Enel $ENEL (-2.02%) and Schneider Electric
$SU (-1.84%) at 5.4 percent. ABB $ABBN (-0.83%) has a weighting of five percent, Iberdrola
$IBE (-1.74%) at 4.9 percent, Siemens Energy
$ENR (-0.79%) at 4.7 percent, ASM International
$ASM (-0.2%) at 3.7 percent, Prysmian $PRY (-0.98%) at 3.6 percent, and BE Semiconductor
$BESI (+3.67%) at 3.2 percent.
This means the index is not purely a tech index, but rather reflects Europe’s physical AI value chain: semiconductors, machinery, electricity, networks, cables, energy, and automation. ASML is Europe’s strategic crown jewel. Fuest even says that ASML is so far Europe’s only truly strategic asset in this sector, because the U.S. also depends on it.
The risk: Europe talks, but doesn’t build. Energy remains expensive, permits take a long time, regulation slows down projects—and in the end, we remain customers of American models.
The opportunity: Europe is waking up. Then digital sovereignty will trigger a capex boom, and stocks will get a new boost. Anyone who wants European AI must definitely buy European infrastructure.
Source: “Welt” (excerpt), June 17, 2026
99
3 Comments
True words—you see this problem everywhere. Here where I live in 🇩🇰, they’re planning to build a data center. It’ll create 600 jobs, and it’s far away from any residential areas—about 10 km. But once again, there are people organizing protests against it. I’m glad to live in a country governed by the rule of law, but there are our problems again… everyone wants it, but no one wants it on their own doorstep. Right now, the project is on hold again 🙄
•
33
•4Mon·
My portfolio evaluated using my own model
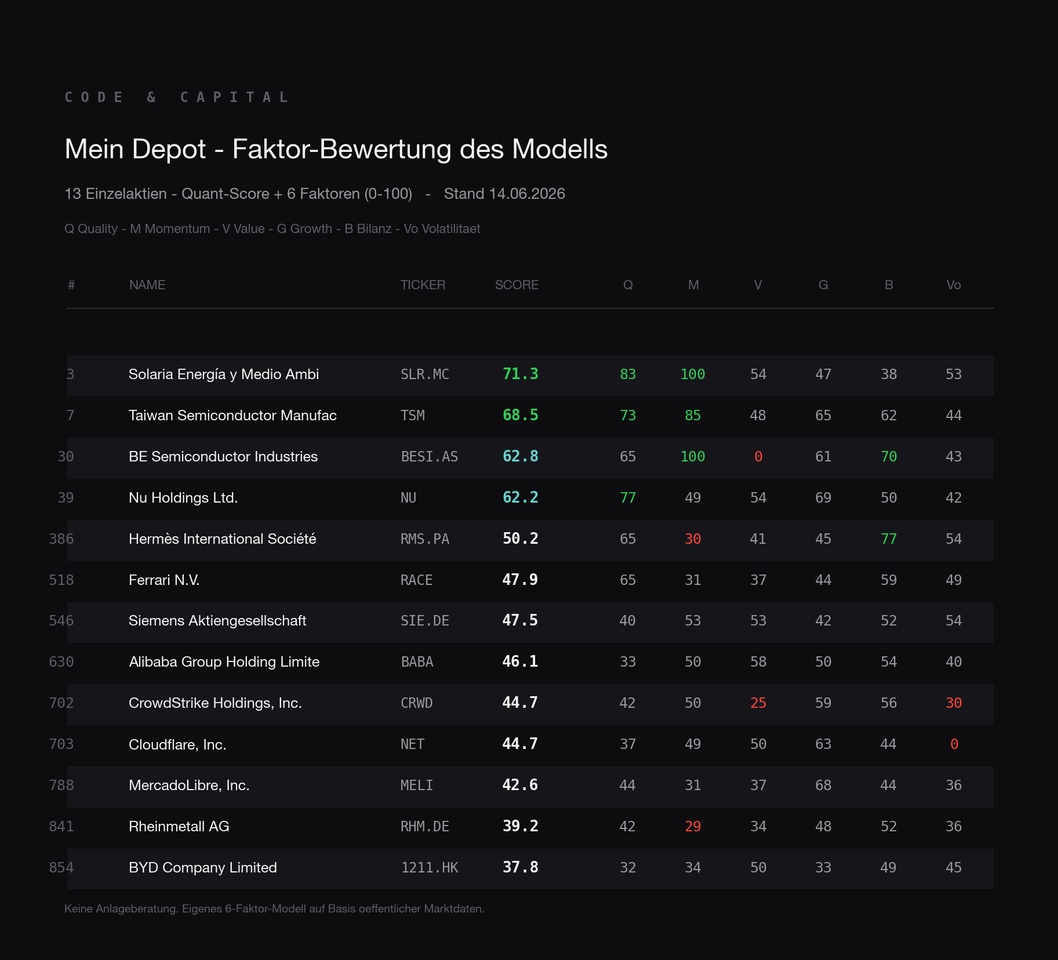
I evaluate around 1,400 stocks using a multidimensional factor model, with each dimension on a scale from 0 to 100. Recently, I’ve started applying this analysis to my own portfolio as well—so each of my positions receives the same score as every other stock in the universe. The results are revealing, especially where the model rates my stocks poorly.
Let’s start at the top:
$SLR (-5.84%) Ranked 3 out of 865, $TSM (+1.09%) at 7, $BESI (+3.67%) at 30, $NU (-0.39%) at 39. At BE Semiconductor, I find the breakdown particularly instructive: an extremely strong momentum score meets a valuation score of practically zero, with a P/E ratio of around 149. So the model doesn’t say “good stock” or “bad stock,” but describes exactly what you’re holding—a strong trend at a high price. This distinction is more important to me than a single overall score.
Now for the bottom half:
Because that’s actually the more interesting part. $RHM (-2.83%) It’s way down the list, $1211 (-0.5%) almost at the end of the universe, $MELI (+0.47%) and also deep. The reason is almost the same everywhere: The 12-month momentum has collapsed following the correction, and at the same time, valuations are high. So two factors are pulling it down at the same time. With Rheinmetall, there’s the added factor that the stock is simply no longer cheap after its strong run—the model sees this objectively, regardless of the story surrounding it.
My software stocks are a special case:
$NET (+1.23%) , $CRWD (+0.62%) and $NOW (+2.88%) . They also end up in the lower range because their high stock-based compensation weighs on quality and balance sheet metrics. This is a well-known issue with growth-oriented software companies: A large portion of employee compensation is paid in stock, which dilutes and burdens margins when factored in honestly. I tested exactly that—I built a variant that excludes the SBC burden and thus rates these stocks more leniently. The backtest yielded a worse result. So I discarded it again and am sticking with the stricter approach. I’d rather have a consistent model that measures all stocks the same way in a verifiable manner than one I tweak for individual favorites. It’s precisely this tweaking that’s the fastest way to a model that looks great in backtesting but doesn’t work in real-world trading.
Bottom line:
for me, these are two types of positions. I bought some because of their scores—Solaria and BESI, for example; the model is what led me to them in the first place. I hold the others deliberately against the score, out of my own conviction. But I want to see the number and take it seriously, rather than pretending it doesn’t exist. That’s the whole point of the exercise.
The purely systematic version—that is, strictly the top-scoring stocks, excluding my conviction-based positions—has been running as a Wikifolio (ISIN: DE000LS9V052) since March and became tradable this week.
What do you think:
Do you tend to trust your own thesis, or the system behind it?
99
2 Comments

Using a valuation model or score is one approach. That might make investing easier. But it’s not quite that simple. Emotions are hard to gauge. A great deal of stock performance is also driven by the news. And with a U.S. president who loves to make headlines, things haven’t gotten any easier.
•
1010
•
4Mon·
Netherlands 🇳🇱: Deep-tech bottlenecks
The Netherlands has a population of just 18 million. Nevertheless, in my search for technological bottlenecks, I come across companies from this small country. Not at the end of the value chain, but where it is decided whether new technologies can scale at all.
Three examples from my portfolio and my three bottleneck wikifolios:
- ASML
$ASML (+0.84%) - For me, ASML is not just a bottleneck, but one of the rare chokepoints in the technology industry. A chokepoint describes a company that is so critical that there is practically no real alternative. Without ASML's EUV lithography, many of the most advanced chips simply could not be produced. What is particularly exciting is that the high-precision mirrors used in these machines are made by ZEISS SMT (not listed on the stock exchange). They are among the most complex optical systems in the world and are themselves an almost irreplaceable component of this choke point.
- BE Semiconductor
$BESI (+3.67%) - Increasingly powerful chips must be efficiently interconnected. Advanced packaging is therefore increasingly becoming one of the key AI bottlenecks. BESI supplies the necessary bonding and connection technologies and is therefore at the heart of an area that is becoming increasingly important due to HBM, chiplets and AI accelerators.
- Nebius Group
$NBIS (+1.46%) - The most powerful chips are of little use if the necessary infrastructure is missing. Nebius is building specialized AI cloud and compute capacities, addressing a level that many investors still underestimate: the provision of computing power as a service.
The exciting thing about this is that the three companies are at completely different points in the same value chain.
ASML enables production.
BESI enables integration.
NBIS enables utilization.
Perhaps this is the real strength of the Netherlands. The country does not necessarily produce the most visible consumer products. But surprisingly often the tools and infrastructures are created there without which the next wave of technology would not even get off the ground.
⚠️ No investment advice. All three companies are in my portfolio at the time of writing.

3232
5Mon·
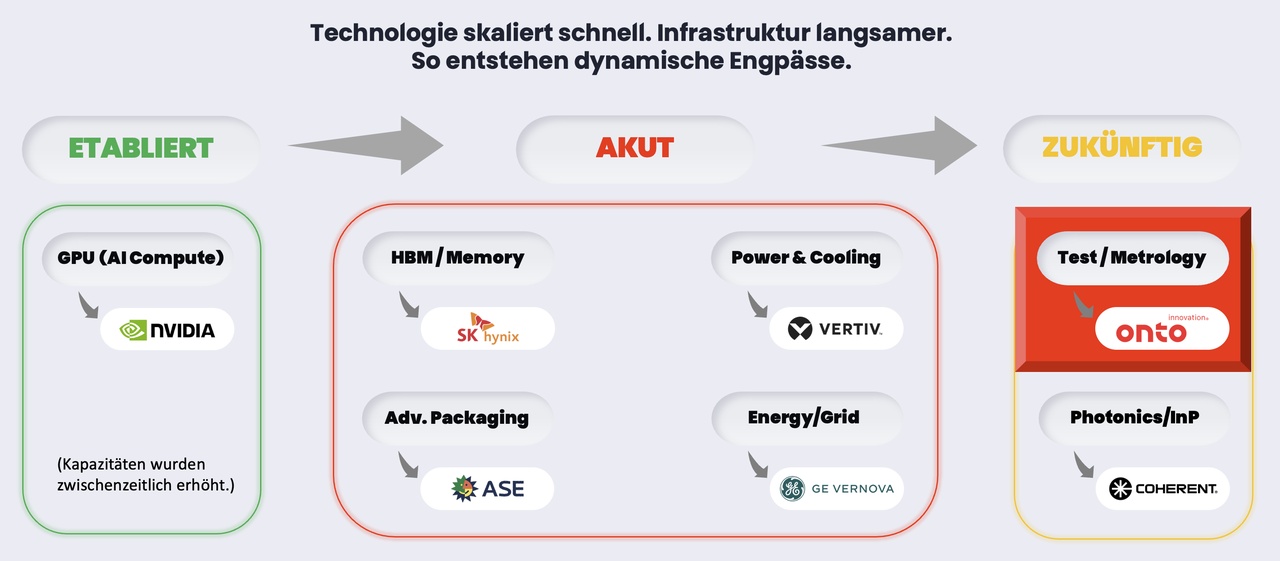
Future AI bottleneck #1: Test/Metrology 🔬
Today we are leaving the field of acute AI bottlenecks (HBM/Memory, Power & Cooling, Advanced Packaging, Energy/Grid) and take a look at future AI bottlenecks.
Here I see, among other things Test & Metrology, because modern AI systems are becoming increasingly complex. More layers, more integration, smaller structures and higher power densities. At the same time, fault tolerance is decreasing massively. Or to put it another way:
‼️ The industry is slowly moving towards "zero tolerance".
Even minimal deviations can affect yield, energy consumption or stability in the future. Precisely because of this This is precisely why the requirements for measurement, control, verification and precision along the entire production chain.
Level 1: Core Metrology (measurement & process control)
For me, this is the structural core. Put simply, it's about making the smallest deviations in modern production processes visible and controllable. Company $ONTO (+2.76%) (Onto Innovation), $CAMT (-0.26%) (Camtek) or even $FORM (+5.58%) (FormFactor) address precisely this level.
Level 2: Test & Verification (functional testing & verification)
It is checked whether complex systems function stably at all. As integration density increases, the importance of test systems also grows considerably. It is often almost impossible to correct errors later on. Companies such as $TER (+3.59%) (Teradyne) show how important Test & Verification becomes with increasing system complexity.
Level 3: Yield Engineering & Integration Control
This is where a lot of value is currently shifting within the stack. With topics such as HBM, chiplets or 3D integration, the requirements for precision, yield and thermal control are increasing massively. For me, for example $BESI (+3.67%) (BE Semiconductor) is very close to this development.
Level 4: Specialized Metrology (high-precision special metrology)
Future optical systems and new integration architectures will further increase the requirements for precision and control. Increasingly, the bottleneck no longer lies in the integration itself, but in the ability to combine highly complex components without errors and maintain stable quality. Companies such as $BESI (+3.67%) (BE Semiconductor) or $ONTO (+2.76%) (Onto Innovation) are addressing precisely this development.
The more complex modern systems become, the more critical the ability to make minimal errors visible and controllable becomes.
Emerging areas such as photonics (optical data transmission), optoelectronics (combination of electronics and lighting technology) or CPO/Co-Packaged Optics (optical components directly next to the chip) are also driving this development, as increasingly complex stacks, optical connections and integration architectures are being created.
2121
11 CommentsHello dear, thank you for your once again exciting input. Due to the brevity of your informative posts, it's always nice to read. We have just added Teradyne to our project @Dividendenopi. I myself am investing in the market leader $6857, but due to the valuation, it's not really a buy at the moment. I find ASE $ASX ASE is very exciting on the watch, and they are also moving more and more into the field of photonics. I had already presented it, the concerns were Taiwan and the China share. What would be your opinion here?
•
11
•Trending Securities
Top creators this week
Real-time data from LSX · Fundamentals & EOD data from FactSet