Smart Beta ETF
Part 4 - Momentum ETF - Follow the Trend!
Disclaimer: No investment advice or recommendation, this article is for information purposes only. Before you decide on an ETF, take a closer look at it in terms of positions, sampling, regions, etc. I can't describe everything here as it would go beyond the scope of this article
Part 1 (Definition, Categories & Z-Score and Quality Factor): https://getqu.in/RCSY4a/
Part 2 (Value ETF): https://getqu.in/Nfnhqb/
Part 3 (Low Volatility ETF): https://getqu.in/Ub7KpG/
What are Momentum ETF
Momentum ETFs are fundamentally based on the premise that trends generally continue and that a risk-adjusted excess return can be achieved by recognizing them at an early stage. To implement this strategy, the most recent price developments (6 / 12 months) are included in the weighting of the individual stocks in the index. This is usually based on a parent index, e.g. there are momentum ETFs on the MSCI World, Europe or USA. This system means that momentum ETFs contain a higher concentration of certain companies and are therefore less diversified than conventional indices. Thus the$IS3R (-0,67%) for example, contains only 350 shares, whereas the MSCI World holds 1,500 shares.
Momentum a double-edged sword
Anyone thinking, follow the trend? Of course, I'm right there with you! The following paragraph is dedicated to the fundamental duration of trends.
General stock market trends
As the adjustment of the Momentum ETF only takes place after 6/12 months, one could be of the opinion that this is too late for the ever faster moving world around us. The stock market prices in changes in the micro and macro climate immediately and crises are only short-lived, as, for example, a high interest rate policy would not be sustainable in the long term given the high debt situation of individual countries. This contrasts with an analysis by Vanguard, according to which the length of bear phases has hardly changed:
The fundamental bull and bear phases have thus hardly changed - in terms of their length - or the bull phases have even tended to become longer, which would make early momentum advantageous. But what does it look like at the micro level?
Sector trends
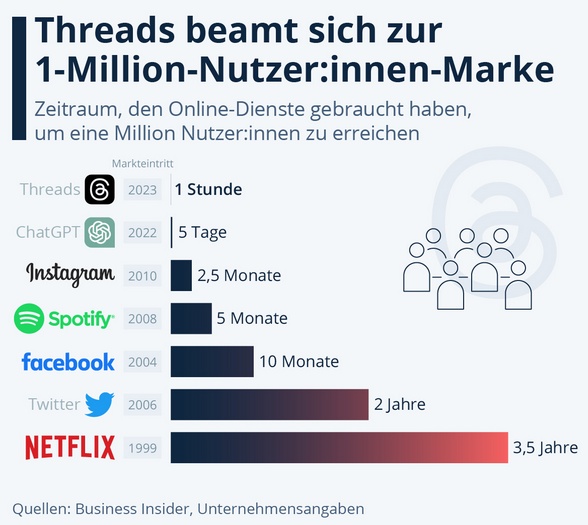
As there is little empirical data in the sector area, the analysis here is based on a few examples and therefore more anecdotal evidence. Due to increasing digitalization and global logistics chains, there is a risk that trends are priced in so quickly that the momentum ETF with its 6/12 month lag cannot react to them fast enough. The example of how long it took companies to reach one million users is often used here:
With rapid scaling, it can thus happen that the company's share price rises sharply and the momentum ETF then buys into the position at very high prices. However, as the stock market has already priced in future growth due to the rapid growth, the momentum ETF may be sold again if the share price stagnates.
This can be clearly seen in the example of NVIDIA in the iShares Edge MSCI World Momentum Factor UCITS ETF (Acc) ($IS3R (-0,67%)):
This is currently the largest position in the portfolio at > 5% (as there is also a lot of momentum), but what has it looked like over the years?
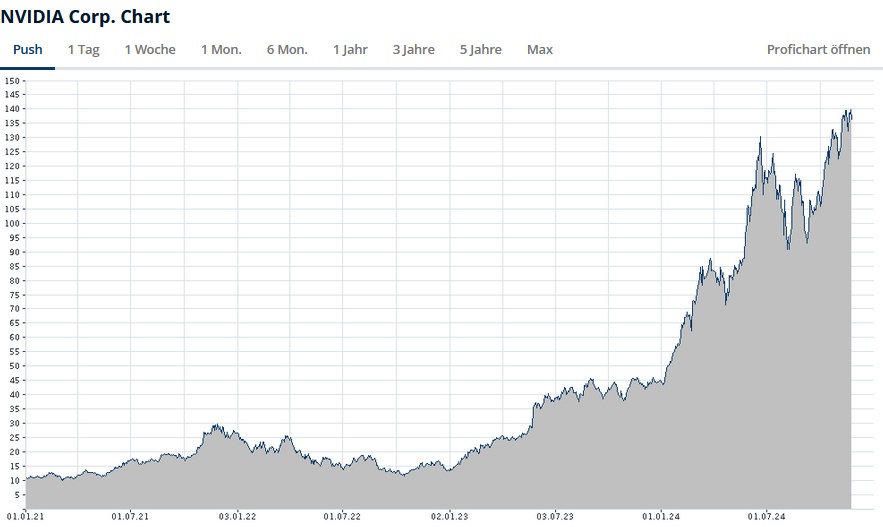
If you put the price of NVIDIA against it...
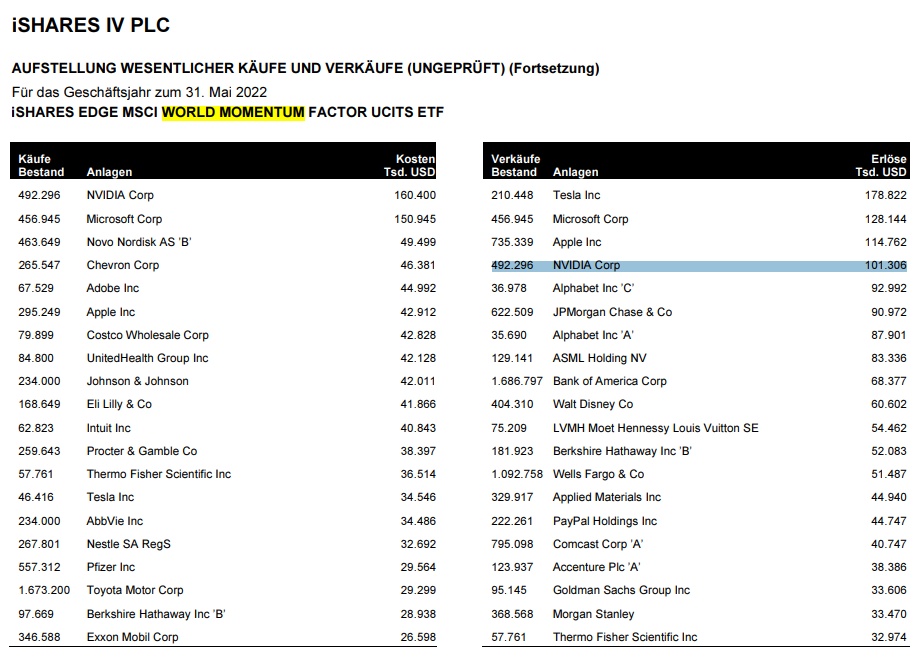
... and take a detailed look at the purchases and sales of the ETF in 2021/2022:
It is noticeable that, due to the ETF's algorithm, NVIDIA's rise in H2 2021 was recognized as a trend and thus high positions were built up. However, as the trend then turned negative, all NVIDIA shares were sold again within a year.
This shows that the strength of momentum can also be its weakness at the same time, because if a trend does not stabilize directly but there is a setback in prices, it can happen that the momentum ETF - instead of becoming cheaper - sells its holdings and then (6 to 12 months after the price has risen again) may enter again at a higher price.
It can also happen that "the wrong horse" is backed in times of crisis. Since - as the chart above from Vanguard shows - bear markets only last 1 year on average and the rebalancing of momentum ETFs only takes place every 6/12 months, a misallocation can occur. This happens, for example, when the rebalancing takes place at the end of a crisis and companies that were relatively weaker (usually interest rate-sensitive growth stocks) are sold and companies that came through the crisis relatively strong (utilities, food,...) are bought. If this happens at the end of the crisis, in the subsequent bull market you have exactly the stocks in your portfolio that were strong during the crisis but tend to be weak in the bull market.
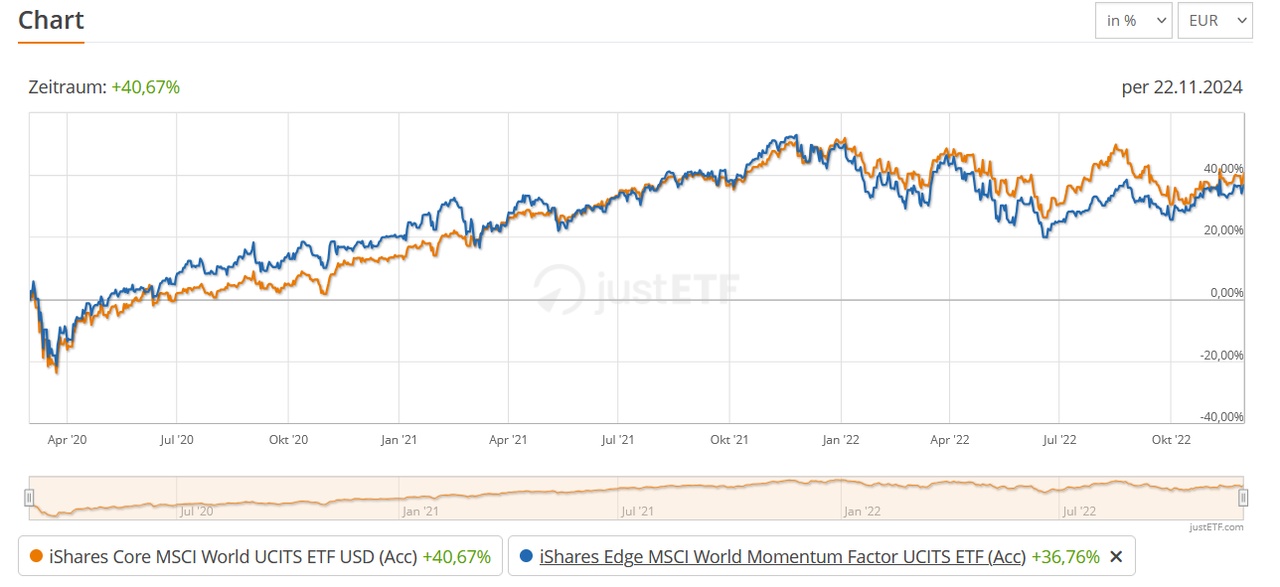
It is therefore a case of market timing, where you can be lucky or unlucky. The following chart shows momentum versus the world during the coronavirus crisis. Here, momentum has outperformed the world, which suggests that the crisis occurred during a suitable rebalancing period:
However, the Momentum Premium tends to underperform in extreme situations. The crashes in the early 2000s (tech bubble) and 2009 (Lehman) ensured that the momentum factor premium did not exceed the 1999 high in 2016. (Source: https://www.institutional-money.com/magazin/theorie-praxis/artikel/ermattendes-momentum-597)
Can I achieve an excess return by sitting in front of ETF rebalancing?
In theory yes, but in practice this will be difficult to implement. The momentum ETFs are not yet so large that this would result in large movements, and in addition, according to my research, the purchases can be spread over a period of time. In addition, there may be other smart beta ETFs that sell the same stocks according to a different logic and, last but not least, the algorithm would have to be sufficiently well replicated and the rebalancing data would have to be known.
Which are the best-known momentum ETFs?
👉ETFs:
-$IS3R (-0,67%) (World | TER 0.25 % | TD n.a. | 2.3 bn invested | 3 yr underperf. vs. world - 5,35 %, over 5 years outperf. + 4 %, 10 yrs outperf. + 62 %)
-$IUMO (-1,49%) (USA | TER 0.20 % | TD 0.03 $ | 0.5 bn invested | 3 yr underperf. vs. S&P 500 - 16,2 %, over 5 years underperf. -24 % )
-$IEFM (-0,11%) (Europe | TER 0.25 % | TD n.a. | 0.3 bn Investvl. | 3Y Underpfer. vs. Eurostoxx 600 - 0,6 %, over 5 yrs. outperf. + 17 %).
💡 Index methodology:
The ETF is based on a "parent index" such as the MSCI World.
Variables for Momentum ETF:
- 6-month price performance
- 12-month price performance
Momentum score calculation:
- Combination of 6-month and 12-month price performance
- Adjustment for local risk
- Risk-adjusted momentum values = excess return / annualized volatility
Stock selection:
- Stocks are selected based on their momentum score
- A fixed number of stocks with the highest momentum scores are included in the index
Weighting:
- Selected stocks are weighted by momentum score and market capitalization
- Maximum weightings are limited to avoid concentration risks
Rebalancing:
Conclusion:
What remains? As described at the beginning, momentum ETFs are a double-edged sword in my view, as they can potentially generate excess returns - in the case of longer-lasting trends - and longer bull markets, but they come with challenges:
- Fluctuating performance in different market phases
- Possible timing problems with semi-annual rebalancing
- Difficulties with fast sector trends
Momentum ETFs are suitable for investors who are prepared to accept higher volatility for potential excess returns. I would therefore only use them as an add-on, e.g. as part of a core-satellite strategy.
#smartbeta
#etfs
#value
#valueinvesting
#portfolio
#stockanalysis
Social media:
You can find links to my profiles on Instagram in my profile - feel free to drop by.


