I’m building a simple long-term ETF portfolio dividend
The idea is to combine growth with stable dividend income and reinvest everything for compounding.
Do you think this is a good balance? Would you change anything?

Posts
32I’m building a simple long-term ETF portfolio dividend
The idea is to combine growth with stable dividend income and reinvest everything for compounding.
Do you think this is a good balance? Would you change anything?


Bought some more $VEUR (+0.96%) today as the transaction for the month
extended the position to 4% of portfolio, target is 15% of total portfolio.
so we've got quite a bit more to go.
Hi all
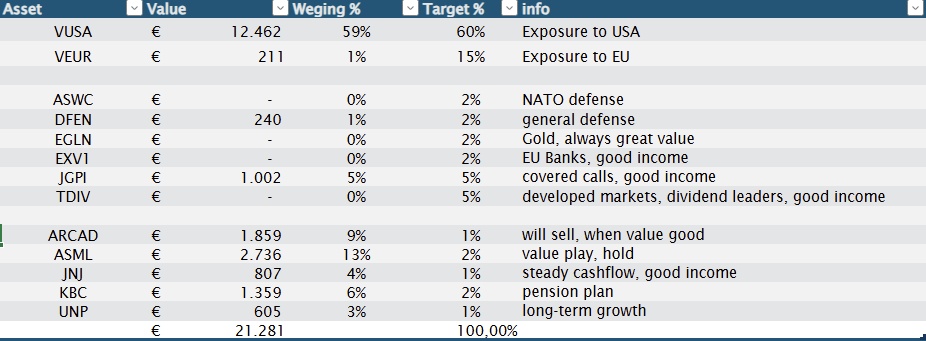
here's some info on my strategy, it's core-satellite method
ETF's is the biggest part with
Core:
$VUSA (+0.6%) & $VEUR (+0.96%)
Satellite:
$ASWC (-0.67%) & $DFEN (+0.12%) as Defense investing, due to EU pulling 5% of GDP with 2030 target
$IGLN (+1.13%) for the gold exposure, minimizing downtrend when markets drop
$JEGP (+0.2%) to make use of market volatility as source of income
$TDIV (+0.23%) past performance is great, dividends of 3-4% always nice income
Individual stocks: mostly dividend stocks as we can deduct €240-region of dividend income of those indidual stocks, sadly not of ETF's.
$$KBC (+0.62%) is marked as pension plan. I do work for KBC and once a yearn i can buy stocks and deduct some of it from my taxes, also buying on cheaper prices.
$UNP (+1.06%) will be a good long-term hold as america is still the biggest, and with trump it should have some long-term growth in it.
$ARCAD (-5.26%) is a value play, aiming to sell around €58, but in meantime, giving dividend to deduct taxes.
$JNJ: (-0.5%) always good to have this one, great long-term hold and steady source of dividends
$ASML (+0.76%) : love this stock, it's a monopoly and is growing strongly, keeping this as long as i like the progress
Hi,
Currently putting aside every month into both $IUSA (+0.6%) and $VEUR (+0.96%) on a 10-15year horizon. Would like to add a 3rd complimentary share or etf. Have considered both blue chip stocks and developing market etf’sz
Any suggestions?
Many thanks & wish you all a great Tuesday.
Absolute midfield in the GetQuin community (but you're good too!🫡😬)
I still have a cash quota of about 20%, from which I make weekly $VWRL (+0.63%) and $VEUR (+0.96%) (to specifically increase my European weighting).
US markets are still historically expensive and a further depreciation of the USD could put additional pressure on the US portion of the portfolio.
I would use larger setbacks for one-off investments.
The 2.25% overnight interest rate at TR, or ~2.157% (thanks @Epi) at $XEON (+0.01%) I am currently still happy to take it.
That's it already.
Keep going! 👍🚀

I've got singing thoughts. Assuming the whole customs thing comes to an end and US stocks and the rest of the market recover, isn't there all the more reason to invest in Europe since everything that happens also has an influence on companies in the EU perhaps preferring to invest in Europe in the future? Am I right or wrong? What are your thoughts
Goal: A globally diversified portfolio via a savings plan
Option 1:
Everything in the $VWRL (+0.63%)
Option 2:
50% $VUSA (+0.6%)
15% $EIMI (+1.48%)
15% $VEUR (+0.96%)
10% $WSML (+0.93%)
What do you think?
Option 1 would be the simpler approach. No rebalancing. Unscheduled purchases or sales with an ETF are easier and more fee-friendly.
Option 2 allows more control in terms of weighting, so I could reduce the US share from $VWRL (+0.63%) from 62% to 45-50%. In option 2 it would also be possible to swap the S&P 500 for Nasdaq or Amumbo depending on the market cycle to get more performance out of it without the risk of a US overweight.
"Should I sell now? Or should I wait and continue investing?"
For over 100 years, there have always been market phases in which investors ask themselves precisely these questions. And indeed, there are a number of crash indicators that have warned of major slumps in the past. But how reliable are these signals? And more importantly, which strategy has proven to be the best historically?
Should you invest everything at once (lump sum), spread out the entry via dollar-cost averaging (DCA) or try to avoid the worst with market timing? We take a look at the data from the last few decades and clarify which strategy has really come out on top in the long term.
This article is primarily aimed at investment newcomers, but there may be something of interest for old hands too! 🚀
Important: This is of course not investment advice.
📍Historical market indicators before slumps
📶 1st Buffett indicator (market capitalization to GDP):
This indicator, popularized by Warren Buffett, compares the total value of the stock market with economic output.
Values above 100% are considered an overvaluation signal; in fact, the indicator was at high levels before several major downturns. An analysis of 21 market downturns since 1950 showed that the Buffett indicator provided warning signals before around 50% of the major downturns (def. >10% decline). In the most severe exaggerations (over ~120% market cap/GDP), a downturn occurred on average 24 months later.
A high Buffett indicator points to an overvalued market environment, but the market can remain overvalued for a long time before correcting.
🚨 Current: According to data from Advisor Perspectives, the Buffett indicator was 205.1% in January 2025, suggesting the market is significantly overvalued.
📶 2nd Shiller P/E ratio (CAPE ratio):
The cyclically adjusted P/E ratio according to Robert Shiller measures the price/earnings ratio on the basis of 10-year, inflation-adjusted earnings.
Extremely high CAPE values occurred in 1929, 2000 and 2007 - all precursors of weak return phases. Studies show that high CAPE values tend to mean low average returns over the following 10 years. In an analysis of 21 major market corrections since 1950, the CAPE provided warning signals in 10 cases by significantly exceeding its long-term average. For example, the Shiller P/E reached historic extremes in 1929 (~32) and 1999 (~44), followed by a crash and a decade of meager returns, respectively.
An extreme Shiller P/E ratio signals overvaluation and low future returns, but the timing is fuzzy - high values can occur years before a crash.
🚨 Current: In February 2025, the Shiller P/E ratio reached a value of 37.96, which is well above the historical average. In the past, such high values were often observed before major market corrections.
📶 3. yield curve inversions:
An inverted yield curve (short-term interest rates higher than long-term interest rates) is considered a reliable recession indicator.
Every US recession since 1955 has been heralded by an inverted yield curve, usually 6-18 months in advance. For equity markets, the signal is less direct: shares often continue to rise for a while after the inversion. For example, the 2Y/10Y yield turned negative in 2006 and the S&P 500 only peaked at the end of 2007. On average, the S&P 500 was still up 12% one year after a 2-10 inversion, before falling later. Historically, in about 6 out of 13 cases since 1976, a 10Y-2Y inversion has preceded a major price decline.
Inverted yield curves signal an economic slowdown - a warning sign, but not an exact timer for a stock market crash (which is often delayed).
🚨 Current: In recent months, the US yield curve has changed significantly. According to an article from January 2025, the Federal Reserve's rate-cutting cycle may already be complete, signaling the end of the long-lasting yield curve inversion. The yield curve is now just back in positive territory at +0.06 %.
In the past, a market crash has often followed the end of a prolonged yield curve inversion, not necessarily during the inversion itself. This means that the real danger for the equity market often only began when the yield curve turned positive again.
📶 4. margin debt (securities loans):
High or rapidly rising securities loans are considered a sign of speculative excesses.
Before the dotcom bubble burst in 2000, margin debt shot up by over 80%; before the 2008 financial crisis, it rose by over 60%. Remarkable: Margin debt peaked shortly before the stock market peaks of 2000 and 2007. As soon as credit levels began to fall, the market slump followed with a few months' delay. Similarly, the low of margin debt in 2009 almost marked the bottom of the S&P 500. An academic study backs this up: An excess of available margin credit proved to be an extremely strong predictor of future lows and outperformed other indicators in statistical tests.
Rapid rises to record highs in margin credit are often associated with market overheating and have historically heralded major corrections.
🚨 Current: In January 2025, margin debt in the US reached a new high of USD 937.25 billion, an increase of 4.24% on the previous month and 33.52% on the previous year.
These developments indicate that despite a normalization of the yield curve, the increased margin debt points to an increased risk appetite among investors.
📶 5 Other indicators:
There are other indicators that observers see as harbingers.
For example, Tobin's Q (market value to replacement cost of companies) was extremely high before slumps such as 2000 - similar to the Buffett indicator.
Profit recessions (declining corporate profits) can also send warning signals, as sustained negative profit trends often occur in recessions and bear markets.
Overall, all of these indicators show an overvaluation or economic weakness before major slumps occur.
❗ Important: None of these indicators are perfect. Many false alarms and long lead times make them difficult to use for precise market timing. For example, the Buffett indicator has been consistently above 120% since 2016 without an immediate crash; the Shiller P/E ratio remained above the historical average for a long time in the 2010s, while the market continued to rise. Indicators therefore tend to offer rough warnings than accurate crash predictions.
📍Backtesting: Long-term investment strategies in a crash environment
Assuming investors recognize such warning signals - which investment strategy has historically been the most successful in the following 10+ years?
Let's look at three approaches to investing in the S&P 500 (inflation-adjusted, with dividends reinvested):
📈 Backtest results:
Historical analyses over many periods show that strategy (A) - the one-off investment - usually produced the highest long-term return.
The reason is simple: stock markets predominantly rise in the long term, so that time in the market is rewarded. A study by Charles Schwab looked at 76 rolling 20-year periods since 1926 and found that in 66 out of 76 cases, immediate investment outperformed staggered investment. Vanguard and Morgan Stanley came to similar conclusions: Lumpsum investing outperforms DCA ~2/3 of the time, especially in up periods. The return advantage is moderate on average (e.g. in the Schwab example, the lumpsum investor realized $135,471 vs. $134,856 with DCA over 20 years - a difference of only $615), but it is there.
✅ Conclusion: Investors who invest for the long term (10+ years) fare slightly better historically if they don't procrastinate, but fully invest as early as possible.
➕➖Advantages and disadvantages of DCA:
Staggered buying (B) primarily has psychological and risk-related advantages in crash scenarios. If a crash occurs shortly after the initial investment, the DCA investor has only invested a portion and can buy at more favorable prices - he lowers the average entry price. This approach mitigates losses at the beginning and can reduce the emotional burden. In the example, DCA would lower the entry price if the share price falls. However, there is a trade-off: if prices continue to rise after the start, DCA misses out on gains with the funds not yet invested - the average cost effect then leads to a higher average price and lower final value compared to the one-off investment. Over long periods, in which there are statistically more upward than downward phases, DCA therefore tends to have slightly lower returns.
✅ Conclusion: DCA is an entry-level risk diversification strategy, but it can cost some performance over the long term. It is suitable if an investor is uncomfortable with immediate all-in or is afraid of an imminent crash. In the long term, however, DCA investors usually fall just short of full investors.
⏱️ Market timing (temporary exit):
Strategy (C) attempts to time the market based on indicators or forecasts - i.e. getting out before the crash and getting back in later at a lower price.
👉 Theoretically sounds attractive: if you had sold every time before a major slump, the returns would have been enormous. In fact, an investor with perfect timing (deciding every year: 100% stocks or 100% cash, depending on whether a crash is coming) would have increased his wealth to over $22 million in 1926-2022 (with a $10,000 start), compared to ~$1 million in buy-and-hold.
👉 But: Perfect timing is impossible in practice - and realistic timing strategies have historically underperformed. A study simulated simple CAPE-based timing rules: Both an aggressive timing strategy (hedging into put options when valuations are high) and a defensive one (going into cash/bonds when valuations are high) significantly underperformed a buy-and-hold strategy over the period 1900-2018.
📈 Specifically, the buy-and-hold return was ~11.3% p.a., while both timing models achieved less.
✅ The reason: False signals and missed profit phases.
Indicators often strike too early alarm or sometimes even wrong. For example, anyone who would have exited in 2015/2016 due to a high CAPE or Buffett ratio would have missed out on the strong gains until the end of 2021 before a downturn came in 2022.
Experience has also shown that some of the best stock market days occur in the middle of crises. Around 78% of the strongest days in the S&P 500 occurred during bear markets or at the very beginning of recoveries. So if you are temporarily out, you are very likely to miss out on the rapid recoveries.
Example: If you had missed the 10 best stock market days in the last 30 years, your total return would have been halved; if you had missed the 30 best days, you would have lost over 80% of your return. This shows how expensive it is to be wrongly positioned, even for a short time.
🕰️ Insight for long-term investors:
❗Even in extreme scenarios (high valuations, risk of recession), in retrospect it was usually better to stay investedthan trying to time the perfect exit and re-entry.
👉 Long-term investors who invested at the peak before a crash, for example, generally still achieved positive real returns after 10+ years - provided they remained invested and reinvested dividends.
For example, despite the financial crisis, it only took a good 5-6 years after the 2007 peak for the S&P 500 (including dividends, adjusted for inflation) to return to its pre-crisis level, and after 10 years investors were clearly in the black.
👉 By contrast, those who in 2006/2007 suspectedthe market was overheated and tried to get out, had to decide when to get back in - many missed the favorable re-entry in 2009 out of fear. The same applies to the dotcom era: the Shiller P/E ratio was over 30 (extremely high) from 1996, but the market continued to rise until March 2000. An early exit would have cost years of upswing. Only with luck would one have sold exactly at the beginning of 2000 and bought again around 2002/2003 - a feat that very few manage.
📍Conclusion: use indicators, but stay invested for the long term
❗Historical indicators such as the Buffett indicator, the Shiller P/E ratio, yield curves or margin debt can signal overvaluation or impending downturns. They are useful warning lights to assess the market situation - e.g. to manage risk or adjust expectations for future returns. However, they were not reliable and sufficient for market timing on their own: many warning signals occurred without an immediate crash following, or they were too general.
👉 For long-term investors (10+ years), hindsight shows that an attempt to time the market usually did not add any value.
On the contrary, buy-and-hold (i.e. stay invested or buy more when the opportunity arises) beat the returns of timing strategies in most cases.
The best strategy in extreme situations was often long-term, staying investedin combination with regular additional purchases (e.g. DCA) if necessary, instead of selling everything in a panic. Lump sum investments have historically achieved somewhat higher final values than cautious entry strategies. If you are unsure about high valuations, you can invest a portion gradually - this reduces the risk of short-term losses - but you should bear in mind that time is an important success factor in the market.
✅ Bottom line: Long-term investing beats market timing.
Even in phases of extreme overvaluation, it was better in hindsight to stay invested or at best rebalance moderately over a 10+ year horizon than to get out completely.
Timing the market completely is hardly possible in the long term - the missed upswings cause more damage than the avoided downswings benefit. Long-term investors are therefore generally best served by keeping a cool head, investing broadly diversified, reinvesting dividends and sitting out the investment horizon instead of frantically chasing entry and exit points.
❓What I do personally:
In general, I am pursuing the goal of gradually divesting myself of more and more individual stocks and investing the profits in broadly diversified ETFs such as the $VWRL (+0.63%) and $VEUR (+0.96%) .
However, I will not invest my current high cash ratio of just under 20 % in one go. For psychological reasons, I prefer dollar-cost averaging (DCA) - even if I may lose some performance as a result.
❓How are you dealing with the current feeling of maximum uncertainty on the market?
Sources:
You might also be interested in:
📈 When in Doubt, Zoom Out – Chart-Tipps für Langfrist-Investoren


+ 1

What a crazy rollercoaster this month it is.
$TXN (+0.98%) was my smallest position. I originally opened it to start and buy more later on so as to have a complete portfolio of 10 stocks what I was aiming for. The reason why I've sold it is I expect them to have financial issues that will lead to a dividend cut. I work in the electronics industry and TI has one of the nicest portfolios of electronic semiconductors, but financially I don't like how much debt they have at this moment and how small FCF they are generating. Furthermore, trump trade wars can also impact this company quite significantly so for me it is nota good fit at this moment.
$LMT (-1.36%) I believe is one of not many US stocks that will not be impacted that significantly in the upcoming years.
$VEUR (+0.96%) adding this ETF was a bit surprise, but since my priority at this moment are EU stocks it fits really nicely in my portfolio.
Transactions:
$ASML (+0.76%) - Bought x0.5 at €690.00
$LMT (-1.36%) - Bought x0.35 at $440.00
$VEUR (+0.96%) - Bought x3 at €42.70
$TXN (+0.98%) - Sold x0.35 at $184.14 (full position)
Dividends:
$ASML (+0.76%) x1 Dividends at €1.52
$MAIN (-1.19%) x10 Dividends at $0.25
$TXN (+0.98%) x0.35 Dividends at $1.36
$BMY (+0.67%) x3 Dividends at $0.62
Unrealized gain/loss: +1.47%
Realized gain/loss: -8.83% (-€5.977)
It surprised me how few people talk about the impact that trump actions bring to the stock market.
It should be clear to everyone that it will hurt all allies, but it would be most painful for US, and in fact you can already see from the stock market.
both above are nominated in US dollars.
There are only 2 countries that can gain from trade wars and it is China, and russia.
I think nobody expects it when trump was elected but it is the reality that we are currently living.
As for me, I decided already month ago that from now on I will invest only in EU stocks and ETF (plus I will use dollars I already have in my account), but I'm curious how you all see this and when the market will be more calm again.
As a bonus as EU citizen I feel that US betrayed us and shouldn't be trusted any longer for some unknown period of time.
Top creators this week