$BAYN (-0.6%)
$LDO (-0.46%)
$FCT (+1.61%)
$VOW (+0.63%)
$SAN (-0.95%)
$VWRL (+0.48%)
$ENI (-0.99%)
$SHEL (-0.55%)
$KO (-0.18%)
$ISP (+1.11%)
$INTC (+3.33%)
$SL (+0.99%)
$GOOGL (+0.54%) .
- Markets
- Stocks
- Intesa Sanpaolo
- Forum Discussion

Intesa Sanpaolo
Price
Discussion about ISP
Posts
62Portfolio Update
Market Volatility
Markets are unpredictable.
You can’t know when they’ll top, bottom, or reverse.
What you can do is read the trend.
That’s where Elliott Wave and Fibonacci can help: not to predict the future with certainty, but to understand whether a stock or index is in an impulse, a correction, or a reversal zone.
For long-term investors, this is useful for timing trims, adds, and re-entries.
Not for trading every move, but for managing capital better.
And yes, no capital gains tax would make technical analysis much easier.
But in the real world, taxes matter — so for strong growth names, fundamentals still count a lot.
There’s no perfect timing.
Only better probabilities.
$NBIS (+3.52%)
$RKLB (+2.87%)
$OSCR (+0.36%)
$NOVO B (+1.06%)
$HIMS (+1.75%)
$SOFI (+0.68%)
$UNH (+0.35%)
$ASTS (+2.46%)
$ETH (+0.64%)
$GOOG (+0.52%)
$DLO (+0.59%)
$AMZN (+0.38%)
$BTC (+0.06%)
$ISP (+1.11%)
$DGX (+5.24%)
$BABA (+3.78%)
ALIBABA: a big buy for me at these levels
On my latest DCA, I added more $BABA (+3.78%) because the stock is now trading below my average cost basis. That kind of weakness is exactly when I want to size in, not out.
Alibaba is one of the most important company of the Chinese market, and in my view it still makes sense to keep it as a counterweight in a portfolio that already has a lot of U.S. exposure. The market may be pricing in too much fear, while the long-term optionality is still there.
The setup is not perfect, and that is the point. Free cash flow has been under pressure because Alibaba is spending heavily on AI, cloud infrastructure, and strategic bets in quick commerce, which compressed margins and pushed down FY2026 free cash flow.
So yes, free cash flow is weaker right now. But that weakness is tied to investment, not to a broken business model. If Alibaba executes on AI and cloud the way management is aiming to, this could look cheap.
For me, this is a big buy because the numbers matter: depressed valuation, real revenue growth, solid EPS base, and a strategic AI spend cycle that could create a stronger earnings profile later.
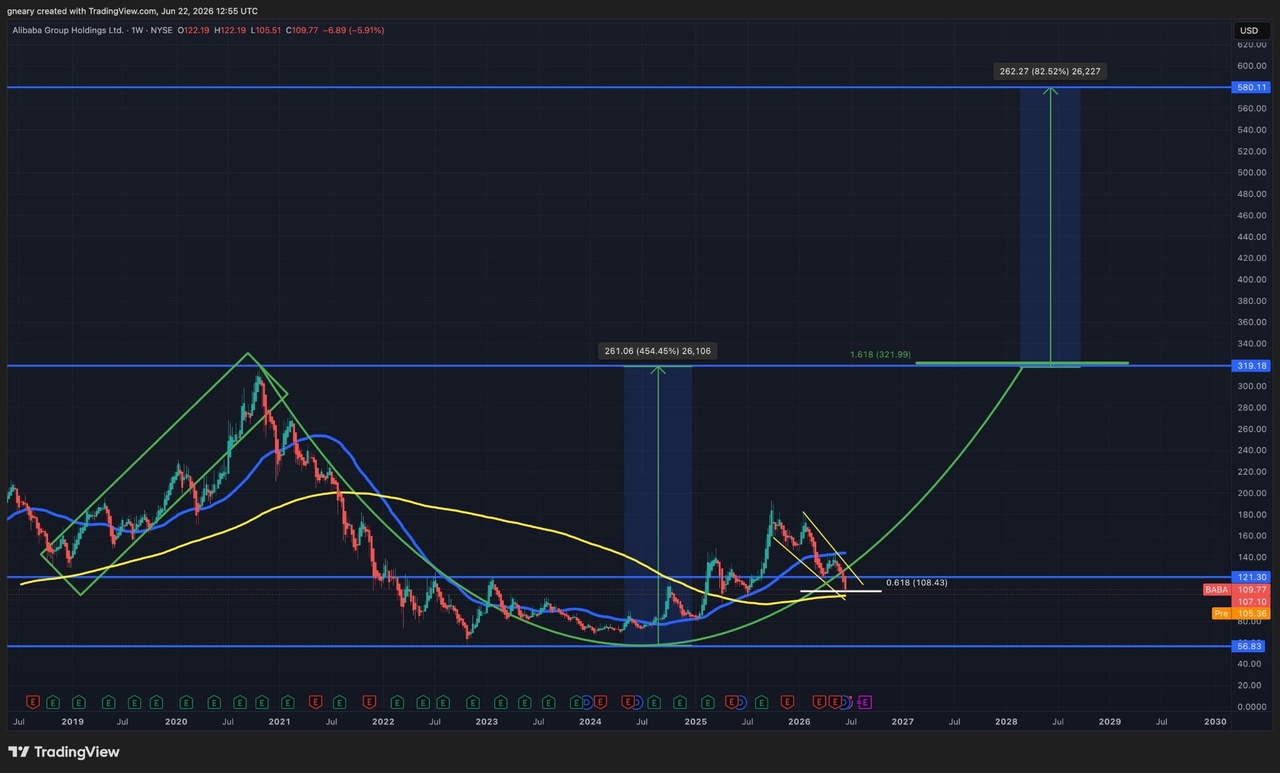
$BABA (+3.78%) is approaching a key technical area where wave 2 appears to be completing around the 0.618 Fibonacci retracement and the 200-week moving average. If this base holds, the next leg higher could point to a wave 3 extension toward 1.618, which in this framework lines up with the old all-time high around $320. The chart also shows a bullish cup-and-handle structure, which makes the technical case more interesting while fundamentals stay intact.
$NBIS (+3.52%)
$RKLB (+2.87%)
$OSCR (+0.36%)
$NOVO B (+1.06%)
$HIMS (+1.75%)
$SOFI (+0.68%)
$UNH (+0.35%)
$ASTS (+2.46%)
$ETH (+0.64%)
$GOOG (+0.52%)
$DLO (+0.59%)
$AMZN (+0.38%)
$BTC (+0.06%)
$ISP (+1.11%)
$DGX (+5.24%)
I’m not just sharing performance. I’m building a public investing thesis.
I started by posting my results, but performance is only the surface.
What really matters is the process behind every decision.
I invest with a long-term mindset, focused on stock picking, growth businesses, and portfolio construction.
From here on, I want to share not only what I own, but why I own it, how I categorize each position, and what role it plays in my portfolio.
My goal is simple:
to turn a portfolio into a thesis, and a thesis into a public journey.
I’m not here to chase hype or pretend to have all the answers.
I’m here to think in public, learn in public, and compound over time.
If you’re interested in public investing thoughts, portfolio context, and long-term conviction, follow along.
$NBIS (+3.52%)
$OSCR (+0.36%)
$HIMS (+1.75%)
$RKLB (+2.87%)
$UNH (+0.35%)
$ETH (+0.64%)
$SOFI (+0.68%)
$BABA (+3.78%)
$GOOG (+0.52%)
$NOVO B (+1.06%)
$ASTS (+2.46%)
$BTC (+0.06%)
$DLO (+0.59%)
$AMZN (+0.38%)
$MSFT (-0.74%)
$ISP (+1.11%)
$DGX (+5.24%)
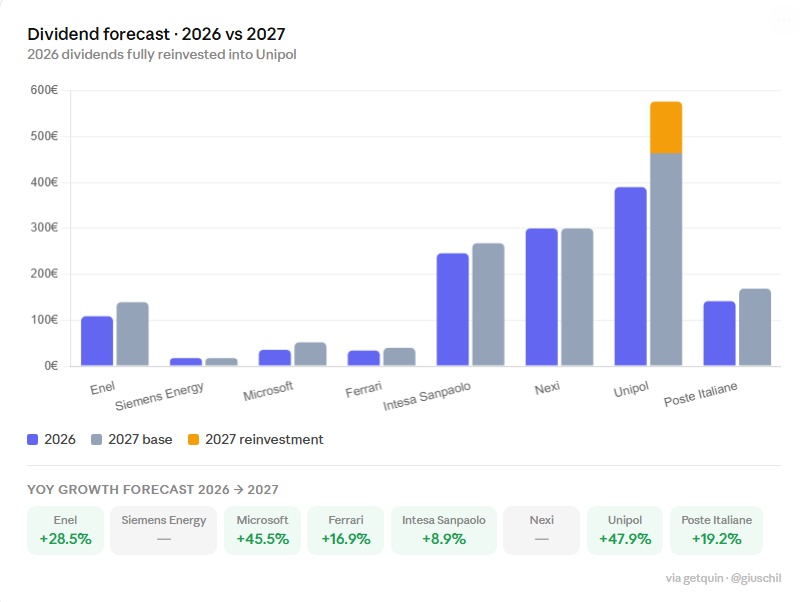
My first €1,000 a year in dividends — here's what 2027 looks like if I reinvest everything ?
I’m happy to see this small but meaningful milestone in my dividend forecasts! 🔥
For 2026 I’m already projected to exceed 1,000 € in passive income per year… and in 2027 it climbs even higher! 📈💰
I only started this journey in 2025. The core of my portfolio is still growth-focused (not passive income), but I like dedicating a big slice to dividends. Now I want to diversify further by increasing my positions in accumulation ETFs.
The plan is simple: I will only reinvest the dividends themselves to slowly grow this passive portion year after year.
Goal: reinvest everything and watch it compound! 🚀
What do you think? Has anyone already passed the 1k € passive income mark?
My current dividend picks:
$ENEL (-2.89%)
$ENR (+3.69%)
$MSFT (-0.74%)
$RACE (+0.14%)
$ISP (+1.11%)
$NEXI (+0.76%)
$UNI (+1.08%)
$PST (-0.92%)
#Dividends
#PassiveIncome
#Portfolio
#Reinvestment
#ETFs
#DividendGrowth
Little Rotation🙂
In light of escalating Iran tensions, I've rebalanced the portfolio by trimming a small Eni (ENI.MI) position, selling off Salesforce (CRM) and Nike (NKE) - those growth bets just weren't delivering. Instead, I've boosted exposure to Energy Fuels (UUUU) for the uranium play, Leonardo DRS (DRS) riding defense tailwinds, the STOXX Europe 600 ETF for broader European exposure, and Intesa Sanpaolo (ISP.MI) banking on higher rates. Eyes on energy resilience and Euro financials amid geopolitical volatility. Happy investing - may your rotations capture the alpha!
$DRS (+0.39%)
$ISP (+1.11%)
$CRM (-1.17%)
$NKE (+0.03%)
$MEUD (+0.25%)
$ENI (-0.99%)
$UUUU (+1.74%)
Intesa Sanpaolo
Following the sale of some dividend stocks
I bought a 2nd tranche of an Italian bank stock with a dividend:
intesa sanpaolo
Here is a compact fundamental analysis of Intesa Sanpaolo
## 1st P/E ratio (trailing & forward) incl. sector comparison
| Key figure | Intesa Sanpaolo | Typical EU banking sector* |
|----------------------------|-----------------|----------------------------|
| Share price (approx.) | € 5.1 | - |
| P/E ratio trailing (TTM) | 9-11 approx. 8-10 (large euro banks, roughly) |
| P/E ratio forward (estimate) | around 7-9 (derived from high earnings growth and dividend yield) | similar, sometimes slightly higher |
| P/S ratio (price/sales, ttm) | approx. 3.3-4.1 mostly 2-3 |
| P/B ratio (price/book, mrq) | approx. 1.5 often 0.7-1.2 |
Interpretation: The **KGV** is slightly above the pure substance sector (many banks trade below book value), which reflects the high profitability and dividend policy, but is still in the "favorable to fair" range in absolute terms.
## 2. earnings per share (EPS) & trend
- Current EPS (TTM): around € 0.50-0.54 per share.
- Net profit 2024: Record net profit of € 8.7 bn, +12% compared to 2023.
- Profit growth: According to Simply Wall St, on average approx. 28% p.a. over several years, sales growth approx. 11.5% p.a.
The **EPS trend** of the last 3-5 years thus shows clearly above-average growth for a major bank, driven by the interest rate environment, fees and insurance business.
## 3. EBIT & EBIT margin (operating result)
Banks typically report operating profit as "operating income/operating margin" rather than traditional EBIT, but analogously:
- 2024: Very strong operating profitability, driven by interest business, fees and record insurance result; cost/income ratio at record low of 42.7% (one of the best ratios in Europe).
- High net margin: net margin around 36.5% according to analysis platform, ROE around 14.3%.
Conclusion: Operating **earning power** and margins are clearly above the average of major European banks, which justifies the slightly higher valuation level.
## 4. dividend, yield & payout ratio
| Key figure | Value (last) |
|-------------------------------|-------------------------|
| Dividend per share (current) | approx. € 0.34-0.37
| Dividend yield (forward) | approx. 6.4-7.7%
| Dividend payout ratio (payout) | approx. 67%
| Total payout 2024 | € 6.1 billion cash dividends
| Additional planned share buy-back of € 2 billion
The bank pursues a shareholder-friendly policy with a high **dividend yield** plus buybacks; with ~2/3 payout ratio, there is still a buffer for capital expansion and growth.
## 5. share price history & performance
| period | price info / performance* |
|--------------|--------------------------------------------------------|
| 52-W-Range | approx. 3.5-6.2 €
|
| Last price | approx. € 5.1 (March 2026, Milan Stock Exchange) |
| 1-J Performance | approx. +39% (last 12 months) |
| Volatility | Beta approx. 0.8 (below market average)
*Compared to a broad index such as the Euro Stoxx 50 or S&P 500, Intesa Sanpaolo has outperformed very strongly in the last year; exact benchmark figures fluctuate depending on the reporting date, but are well below +39%.
This means that the share has clearly outperformed in the last 1-3 years, but has already seen a double-digit decline since the high (February 2026 at approx. €6.16).
## 6. overall valuation - favorable / fair / expensive?
Points in favor of the share:
- Above-average profit and sales growth combined with very high profitability (ROE, net margin, cost/income).
- High and probably sustainable dividend yield of around 6-7% plus share buybacks.
- Valuation ratios (P/E ratio, P/B ratio) rather in the "cheap to fair" range compared to European peers, considering the high quality.
Risks/observation points:
- Significant share price increase in recent years; some of the improvement is already priced in.
- Cyclical interest rate and credit risk in the banking sector in general (interest rate turnaround, economic situation in Italy/eurozone).
Overall assessment from an investor's perspective: Based on the available key figures, Intesa Sanpaolo currently appears **rather favorably to fairly valued**, especially for income-oriented investors who value stable, high dividends and accept the banking sector risk.
Sources:
[1] Intesa Sanpaolo SpA, ISP:MIL summary - FT.com - Markets data

So you're selling BP (oil) and Verizon (telecoms) - the most boring but most crisis-resistant widow-and-orphan stocks in the world - to add a cyclical southern European bank to your portfolio now of all times? Courageous! Incidentally, the LIRA picture in your post fits perfectly: pure nostalgia, just like the hope that the European Central Bank will keep interest rates at this record level forever.
Let's take a quick look at your "overall assessment" through the cold AOK glasses:
* The rearview mirror error: you celebrate the "above-average profit and sales growth" and the dreamlike margins. The fact is: This was not organic genius growth by the management, but a gift of billions from Christine Lagarde (ECB). Every bank prints money when interest rates rise. You're buying yesterday's party here.
* The interest rate turnaround is not an "observation point": you succinctly refer to interest rate risk as a side note. My best man, that's the elephant in the room! Interest rates are starting to crumble. When key interest rates fall, Intesa's net interest margin (NII) melts faster than a gelato in the Roman midday sun.
* 6-7 % dividend? Yes, the yield looks juicy at the moment. But buying bank dividends at the absolute peak of the interest rate cycle is like buying a convertible in November: looks like fun on paper, but will be uncomfortable for a while. You noticed the "significant price increase" yourself. The market is already fully pricing in the best-case scenario.
My Mr. Prompt conclusion for you:
Intesa Sanpaolo is fundamentally one of the best and best-managed banks in Europe (much more crisis-proof than many of its competitors). As a long-term hold, it is perfectly fine. But to add another tranche now after the rally, while the interest rate turnaround is just around the corner, smells suspiciously of classic FOMO (Fear Of Missing Out).
Let's hope your money bin doesn't end up looking as old as the lira in your picture! 😉
How I automated my daily portfolio analysis with AI
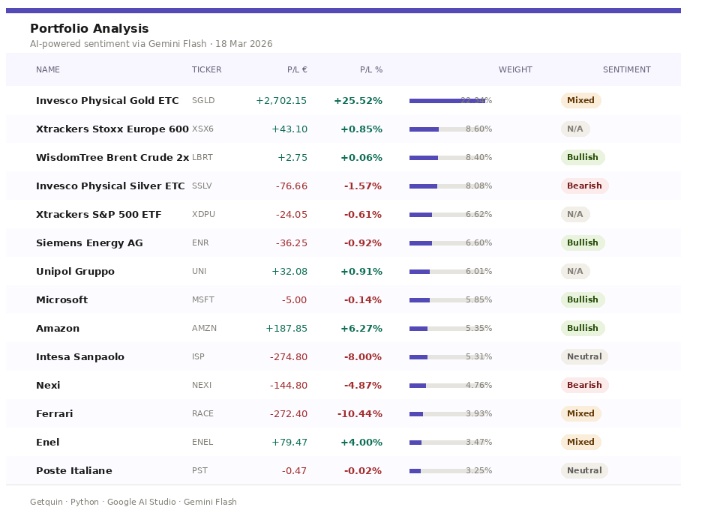
Started with a simple problem: I wanted a daily snapshot of my portfolio with sentiment analysis, without doing it manually every time.
So I built a small system that does it for me.
How it runs: A JavaScript bookmarklet on #Getquin automatically clicks "show more", captures the full positions table as a PNG, and saves it locally.
A Python script then passes that image to Gemini Flash (#Google AI Studio) — it reads the screenshot, extracts every ticker with P/L and weight, searches for recent news, and generates a sentiment tag for each position.
The output lands in a Telegram message every morning. 📬
Today's snapshot:
- Portfolio at +8.16% since inception
- $SGLD (+0.12%) (+25.37%) 🟢 still the biggest contributor — gold doing its thing
- $ENR (+3.69%) 🟢 Bullish — Siemens Energy buyback announced, analysts at Buy
- $NEXI (+0.76%) (-4.78%) 🔴 Bearish — BofA downgrade, guidance missed, competition intensifying
- $ISP (+1.11%) (-7.97%) — sitting on a loss but Moderate Buy consensus intact
- $RACE (+0.14%) (-10.41%) — neutral for now, UBS says near peak negative sentiment
Next step: schedule it on my VPS so it runs automatically every morning without touching anything.
Mid month update - February 26
Hi everyone,
As i've started to do since the opening of my portfolio (in may) here there is a mid month update. ( Note: i'm a beginner with not much money so i appreciate every advice).
This month a lot has happpened, i've sold my positions in: $BATS (+0.77%) , $ISP (+1.11%) , $MO (-0.22%) and $PEP (-0.15%) as all of those were in a positive and changed a bit my strategy, first of all i wanted to buy $MSFT (-0.74%) thanks to his massive reduction in price and then i introduced $IMEU (+0.23%) to have a better geographical risk management. Apart from that i also increased my position in the others ETFs.
As soon as i will have a decent amount to invest i also plan to add a emerging markets etfs.
How do you see my shift in investments?
And that's all for now, any advices?
Individual stocks I would only increase them following dramatic price drops, but the main focus would be on the backbone of the portfolio.
How come you sold Intesa?
Good luck!
Market Update: Sector Analysis & Daily Sentiment - eToro Portfolio
Good morning everyone! ☕️ Today the market is moving on mixed tracks, with some top performers continuing to outshine while traditional sectors reflect recent macroeconomic dynamics. Here is a detailed breakdown of what’s driving today’s movements:
🚀 Communications & Space Economy ($ASTS (+2.46%) ) The satellite communications sector remains the undisputed protagonist. $ASTS (+2.46%) continues to show impressive relative strength, driven by operational progress on the BlueBird constellation. Investors are rewarding the company's ability to scale direct-to-cell broadband services, positioning it as a leader in a high-barrier market.
🏛️ Finance & Banking ($UCG (+1.03%) , $BBVA (+1.16%) , $ISP (+1.11%) ) European banks are showing resilience despite slight pullbacks in local markets.
UniCredit & Intesa Sanpaolo: Benefiting from solid fundamentals and shareholder remuneration policies (dividends and buybacks) among the highest in the sector.
2026 Scenario: The banking sector remains "value-oriented," trading at attractive multiples compared to tech, with an increasing focus on M&A and resilient fee-based income.
💻 Big Tech & AI ($META (+0.59%) , $MSFT (-0.74%) ,$GOOGL (+0.52%) ) The tech sector is in a "wait-and-see" mode ahead of next week's earnings. $META (+0.59%) leads the pack thanks to optimized AI ad spending, while $MSFT (-0.74%) and $GOOGL (+0.54%) reflect a tactical rotation toward more concrete AI infrastructure. Growth is solid, but the market is demanding clear proof of direct monetization.
🛍️ Retail & E-commerce ($BABA (+3.78%) , $CVNA (+1.16%) , $AMZN (+0.38%) )
China: Signs of recovery for $BABA (+3.78%) , supported by improving domestic consumer sentiment.
Personal Note: To be honest, I spent too much time studying the fundamentals and entered $BABA (+3.78%) late. Currently, the position is at a slight loss (approx -1%), but my long-term conviction remains intact. I plan to strengthen this position during my next rebalancing to optimize the entry price.
Consumer: $CVNA (+1.16%) is benefiting from a stabilizing used car market thanks to less aggressive interest rates compared to previous peaks.
💊 Health & MedTech ($HIMS (+1.75%) , $INSM (+0.47%) ) There is strong interest in companies integrating AI and healthcare. However, $HIMS is the most "volatile" part of my portfolio. I’ve seen virtual gains swing from +120% to -5%. While I believe in the business model, its volatility increases my risk score. With a future Popular Investor application in mind, risk stability is my priority. Therefore, I plan to liquidate the position at the next turn-up once my minimum gain target is met to stabilize my portfolio stats. 📉⚖️
🪙 Commodities & Safe Havens ($GLD (+0.04%) , $TRX (+2.78%) )
Gold: With $GLD (+0.04%) nearing all-time highs (around the $4,900+ area), investors are seeking protection against geopolitical uncertainties.
Crypto: Besides my $BTC (+0.06%) stack in cold storage, $TRX (+2.78%) is the only altcoin I’ve chosen to hold here on eToro. I strongly believe in the sustainability of the Tron network for global transactions. I am seriously considering increasing exposure in the coming days, viewing it as an asymmetric bet with great potential.
🎯 Towards the Popular Investor Program: As mentioned at the beginning of the year, I am working to make this portfolio as balanced as possible for future copiers. Risk management comes before spectacular but unstable profits.
How are you managing volatility in the more aggressive Tech stocks? What do you think about the rotation toward European banks? Let me know in the comments! 👇
Trending Securities
Top creators this week