Broaden your portfolio to reduce risk? Tradingview Indicator
Who hasn't experienced this? You think you're diversifying with a new asset, only to realize that it's actually very similar to the rest of your portfolio. This doesn't create a real diversification effect, it's just packaged differently and you have almost the same exposure.
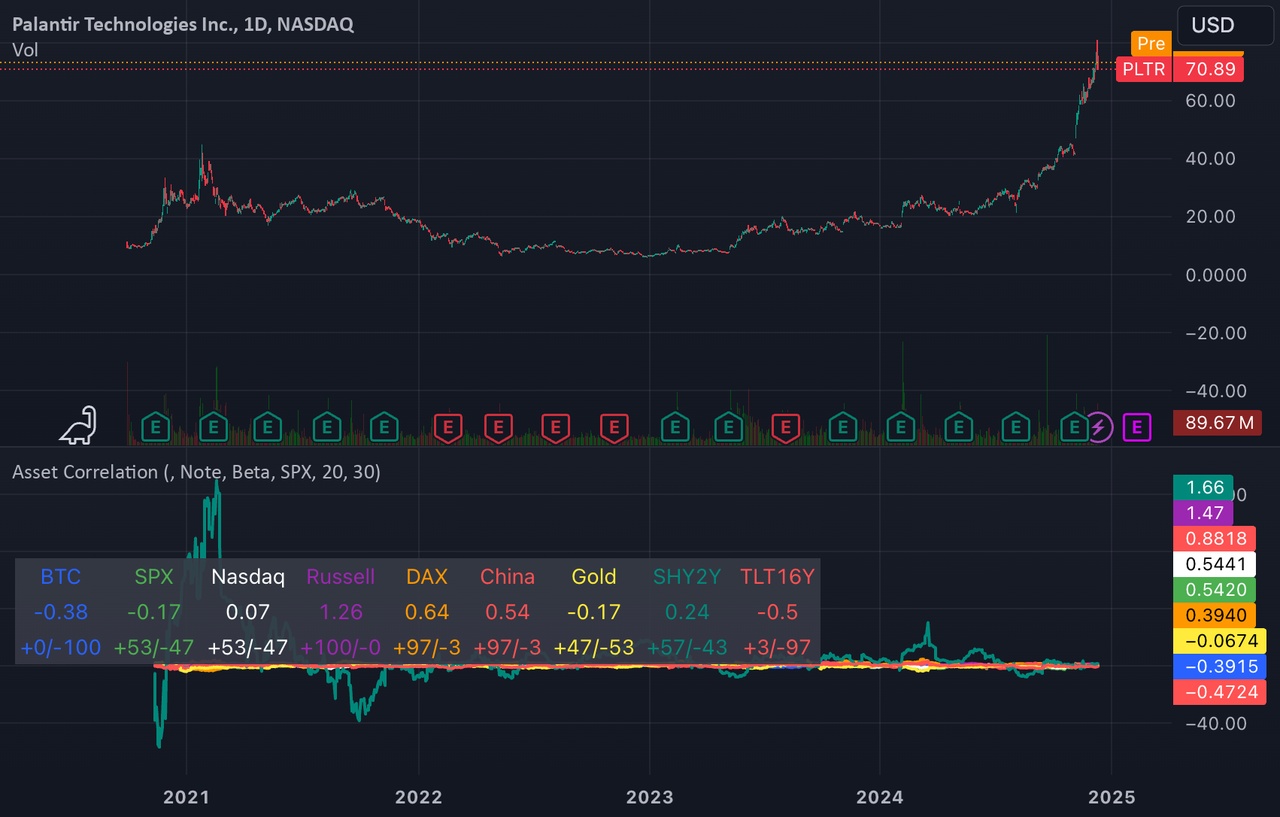
This is where my indicator comes in. It shows you how strongly your current chart (you can use just about anything here: from individual stocks like $PLTR (-0,56%) to ETFs like $IWDA (+0,15%) , bonds, crypto, commodities, economic data, etc.) with key markets such as the S&P500 $VUSA (+0,22%) , the Nasdaq $CSNDX (-0,03%) , the Russell2000 $XRS2 (-0,1%) , the Dax $LYY7 (-0,15%) , China $CNUA (+1,72%) , gold $GOLD silver $PHAG (-1,7%) , bonds or the cryptocurrency $BTC (-1,99%) correlated. This allows you to immediately recognize whether a supposed addition to the portfolio actually changes anything or is basically just a clone of what you already have. Let's take an example: You think you are creating a counterweight to Europe with China, but you realize from the correlation that both markets are moving almost in sync. So you know that this "diversification" is of little use. Apart from the fact that Europe and China generally haven't done much for a long time, haha.
The interpretation of the values is relatively simple. High correlations (close to 1) indicate similar price trends, negative ones indicate opposing trends, and values around zero indicate that there is no clear connection. Bear in mind, however, that correlation is not the same as causality and often only shows indirect relationships. Moreover, historical correlation is no guarantee of future patterns. Nevertheless, this view helps to uncover possible misconceptions and develop more targeted diversification strategies to make your portfolio more resilient. The +/- ratio can now also be taken into account. This is because it often happens that one and the same asset correlates very differently with each other in different phases - sometimes very positively, sometimes very negatively. As a result, the average value can provide a misleading picture. The stronger these fluctuations are, the more percent of the time it is positively or negatively correlated. This is therefore an additional indicator to check how meaningful the average correlation actually is. So + value is the time where the correlation is positive in % etc.
Still to be optimized, that the correlation is not currently limited to certain time periods. For example, if you want to look at the relationship between MicroStrategy $MSTR (-1,62%) and Bitcoin in isolation would have to exclude earlier phases in which MicroStrategy was still a real business and not a "leveraged closed commodity fund" as it is now. In addition to the ATH delta filter, I also plan to incorporate a moving average (MA) as a further trend filter. In the long term, I would like to integrate even more markets, for example emerging markets or non-USD bonds, in order to paint a truly comprehensive picture.
The correlation with interest rate expectations I have used $SHY (short-term government bonds) and $TLT (long-term government bonds). If the SHY falls, the market assumes that interest rates will rise over the next two years. In the case of TLT, this expectation relates to around 16 years and is effectively "leveraged" by the term. If the asset you have shows a high correlation to the SHY, it means that it is relatively sensitive to interest rates (like almost everything). But that would be too much to explain in detail. What is clear, however, is that interest rates play a major role for equities, especially for the Russell 2000, where many smaller, unprofitable companies benefit from low interest rates, as do mining companies with high levels of debt, for example. Of course, it is not the only correlation, but it is an important factor.
- Which other markets or assets would you include to bring more clarity to your analysis?
- Does the indicator even make sense?
- And is there anyone here with a statistical background who would like to go through the code to make sure that everything is calculated correctly or how it could be done better?
I don't know if this is an affiliate link, but don't think so anyway: this is advertising
https://www.tradingview.com/script/kRCxLnhY-Asset-Correlation-Check/


