
Dell jumps 14.5%, Cisco adds 3%. AI infrastructure names are catching a bid after weeks of heavy selling.

Dell Tech
Azione
Azione
Ticker: DELL
DELL
Price
Discussione su DELL
Messaggi
85
2Settimana·
A Million with Satellite - MSCI World Momentum Champions - Monthly Closing, October 2026
🥹 Month 10 since launch has been less than stellar. 🥹
So far this year, things actually only went downhill from mid-June through the end of July, and we were able to continue our upward trend through August and September. But due to a very weak October, we’re once again far from the 30k mark. We’ve now fallen so far that we’re scraping the maximum drawdown from the backtest.
According to the algorithm, I was using Lumentum ($LITE (-4,59%) ), Kioxia ($285A (-4,9%) ), Micron ($MU (-2,83%) ), Hewlett Packard Enterprise ($HPE (-1,33%)), Marvell Tech ($MRVL (-4,84%)), SanDisk ($SNDK (-5,39%)) and Dell ($DELL (-4,2%) ).
The initial investment was approximately 30,000 euros. Upon the sale of Recruit Holdings ($6098 (-3,47%)) and when I bought Marvell Tech ($MRVL (-4,84%)), I kept about 200 euros.
Overall, October resulted in a loss of almost exactly -22% for the satellite portfolio.
-6,600 euros.
Who was in the portfolio and how it performed:
- Lumentum -17% 🥹🥹
- Kioxia -39% 🥹🥹🥹
- SanDisk -33% 🥹🥹🥹
- Micron -17% 🥹🥹
- Dell -20% 🥹🥹
- HPE -13% 🥹
- Marvell Tech -25% 🥹🥹
Kioxia’s decline, in particular, really hurt. After at one point more than doubling in value, the position is now in the red.
YTD, the momentum performance now stands at just +61% TTWROR.
The changes for October have already been made, with the exception of the pending sale of SanDisk. The rotation is massive and shows that the first major AI wave has crashed against the outlook, despite strong numbers.
Exits:
- Micron
- Lumentum
- Marvell Tech
- Kioxia
- SanDisk
Additions:
- Recruit Holdings ($6098 (-3,47%))
- Marathon Petroleum ($MPC (-5,18%))
- Genmab ($GMAB (-1,49%))
- CrowdStrike ($CRWD (+7,81%))
- Okta ($OKTA (+11,58%))
This means the portfolio is now diversified across multiple sectors for the first time. Hoping quietly for a small year-end rally...
Another 44x to reach a million 🥹
7Posizioni
23.406,47 €
0,48%
99
2 Commenti
Krush82@Krush82
2Settimana
•
11
•Mostra la risposta

2Settimana·
Atea Overview – Benefiting from AI and Rising Defense Spending
Atea Provides the IT Infrastructure for Scandinavia's Digital Transformation and Benefits from AI and Defense Spending
We were once again exploring Scandinavia as part of our stock search.
While getting together with friends and neighbors here in Denmark, the conversation turned to companies from the North that don’t get much attention on the stock market, even though there’s a lot going on in their businesses.
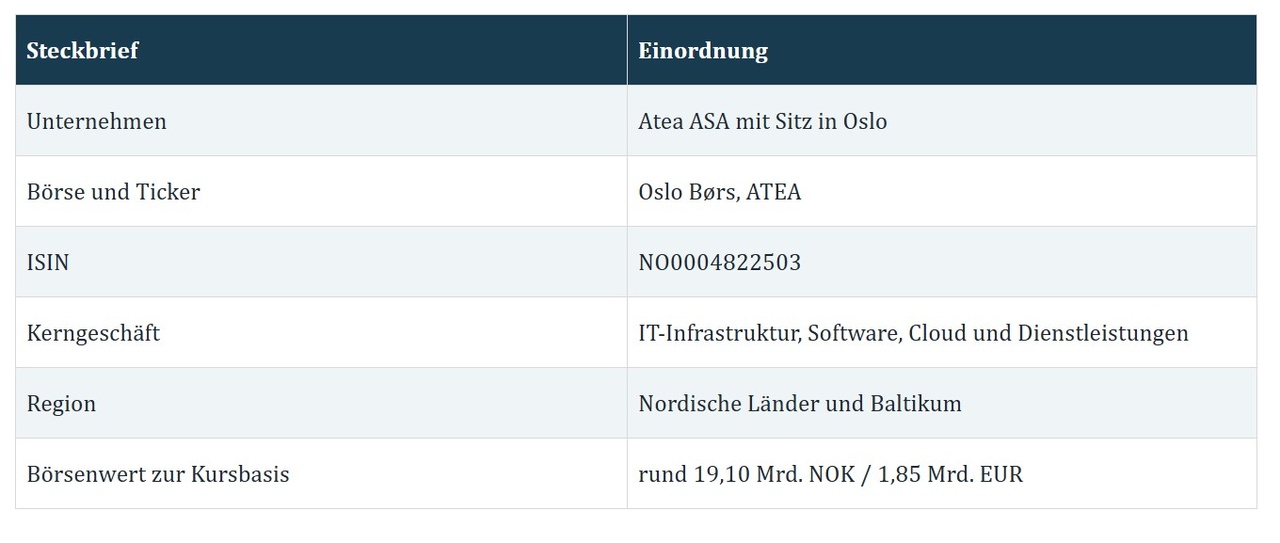
One name came up that I’d barely noticed before: Atea. $ATEA (-2,27%)
After taking a look at the company and its figures from October 22, I thought to myself: We should take a closer look at this candidate.
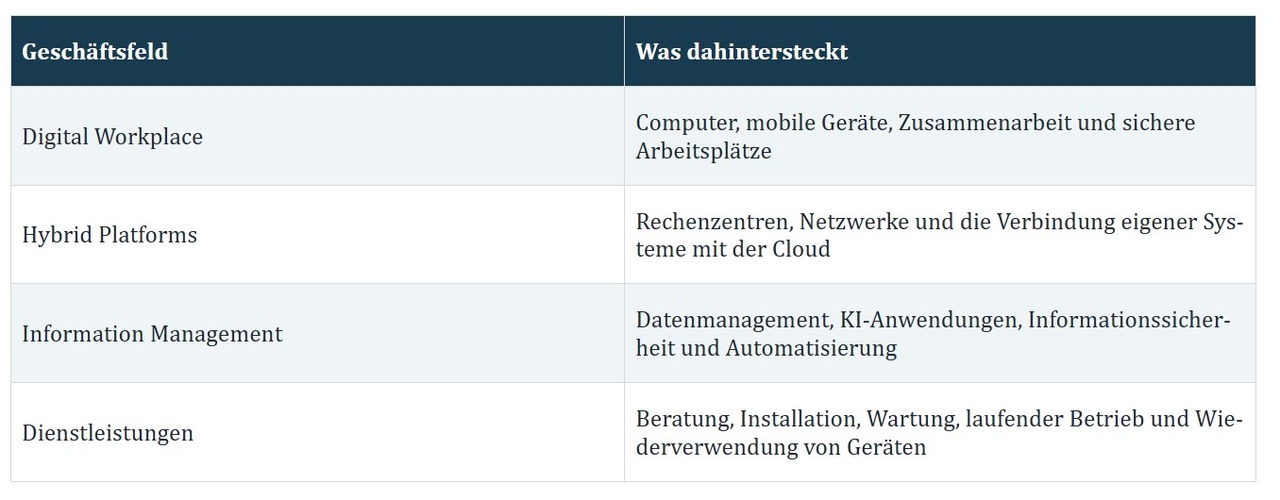
Atea makes its money from the IT that companies, government agencies, and—increasingly—defense organizations actually need.
It’s precisely the combination of AI infrastructure, IT security, and regular dividends is what I find particularly exciting.
Whether this turns out to be a good buy, however, depends on the margins, cash flow, and entry price.
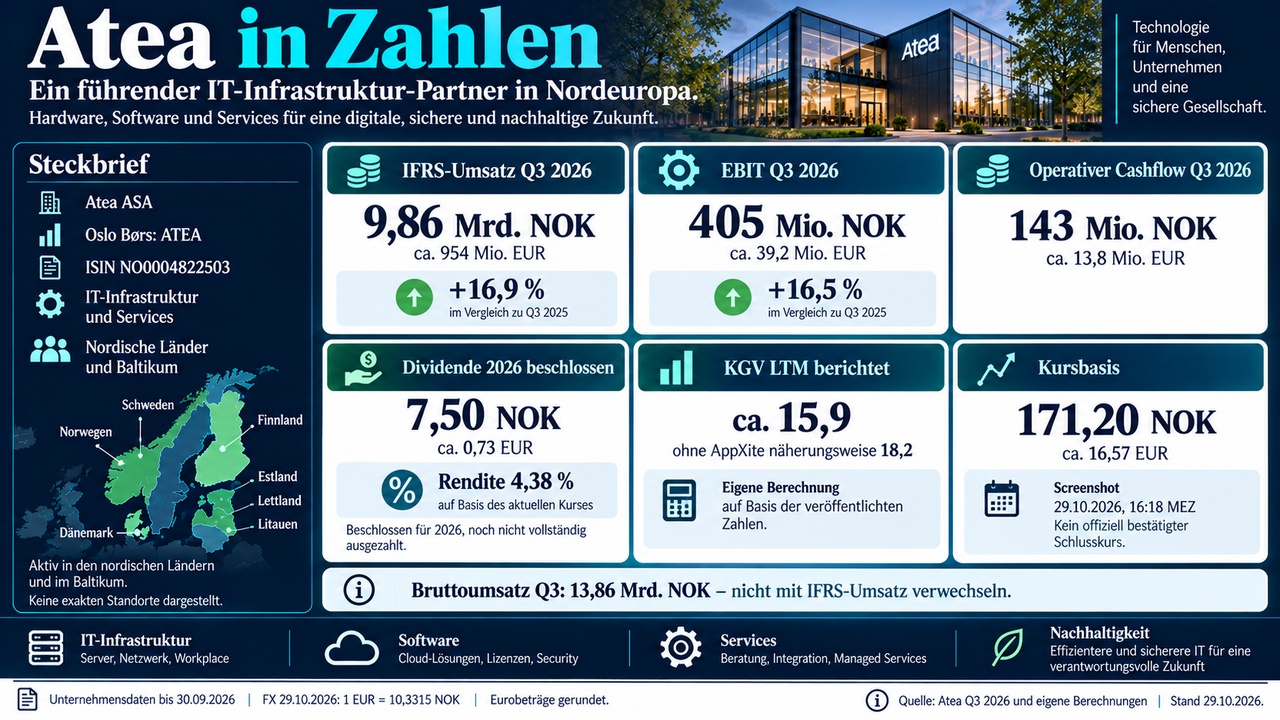
Data as of October 29, 2026. Price basis for the calculations: 171.20 NOK, approximately 16.57 EUR. Sources are listed at the end and in the respective sections.
1 Business Model and History
When a government agency sets up new workstations, a hospital upgrades its IT, or a company needs to integrate servers, networks, and data security, Atea can handle the planning, procurement, installation, and operation.
The technology comes primarily from manufacturers such as Microsoft $MSFT (+0,64%) , Cisco $CSCO (+1,91%) , HP $HPQB34 , HPE, Dell $DELL (-4,2%) , Lenovo, or Apple $AAPL (+0,86%) .
Atea generates revenue by selecting the right products, integrating them, and providing support throughout their lifecycle.
Its roots date back to 1968. That was when Merkantildata was founded in Norway.
The early IT provider evolved into a larger infrastructure and services group, which went public on the Oslo Stock Exchange in 1985. In the 1990s, the company grew through numerous acquisitions. In 2003, Merkantildata and the Eterra and Ementor divisions were merged under the name Ementor.
Today’s Atea took shape primarily in 2006:
Ementor merged with the Danish IT provider Top Nordic and subsequently acquired the Swedish company Atea. In 2007, the Baltic Sonex Group was added.
Since 2009, the group has been known collectively as Atea. More than 50 additional acquisitions strengthened the network in the core markets.
This explains why Atea maintains such a strong local presence to this day. The group combines long-standing customer relationships in individual countries with shared procurement, logistics, and expertise. Today, it has a presence in 88 cities and employs more than 8,000 people.
The leadership has also been familiar with the business for a long time:
Steinar Sønsteby joined the company in 1997, led the Norwegian and Swedish operations, among others, and has been CEO since 2014. A single, romantic “founder’s story” would therefore not do justice to Atea’s origins. Above all, it is the story of several regional IT companies that have gradually grown together.
2 Market Position and Moat
Atea describes itself as the leading IT infrastructure provider in the Nordic and Baltic countries and cites a market share of around 20 percent. This is a figure provided by the company; it does not represent a share of the global IT market.
This scale is an advantage in procurement and complex bidding processes. Local expertise and experience with existing customer systems also cannot be replaced overnight.
According to the company, about 70 percent of sales go to the public sector.
This creates long-term demand but also makes Atea dependent on budget decisions and procurement processes.
A broad public customer base does not mean that a single customer accounts for 70 percent. Reliable figures for the top 5 or top 10 customers are not reported in the reviewed documents.
My assessment: a strong regional position with practical competitive advantages.
However, manufacturers retain significant control over products, terms, and distribution.
The bidding process for the next contract remains competitive.
3 Core Quality Formula
The formula links revenue growth and operating margin. For Atea, one must use the same definition of revenue: IFRS revenue for both growth and margin. Combining the higher currency-adjusted gross revenue growth with an IFRS margin would be methodologically flawed.
This is a steadily growing IT service provider with a retail business and a narrow profit margin. The formula also shows why I wouldn’t equate Atea with a high-margin software company. Gross profit rose by only 2.0 percent in Q3. So, selling more hardware does not automatically mean a corresponding increase in the company’s own value creation.
The nine-month margin is based on 1,049 million NOK in adjusted EBIT.
The reported 1,201 million NOK additionally includes 152 million NOK from AppXite. Own calculations based on the quarterly report.
4 Cash Flow Quality Formula
This is where I see the most important area for improvement. Profits are encouraging; in the long term, they must translate into freely available cash. In Atea’s business, inventory and the payment terms of customers and suppliers temporarily tie up significant amounts of capital.
Operating cash flow for the last twelve months amounts to approximately 91.47 million EUR, while simple FCF is approximately 48.30 million EUR.
The company’s FCF is higher because Atea includes proceeds from asset sales in its net investments.
Business sales are not included in these FCF figures.
The simple cash conversion ratio is thus only about 41 percent: 499 million NOK in FCF divided by 1,219 million NOK in reported net income for the last twelve months.
This profit also includes the AppXite effect. After an additional NOK 431 million in lease payments, only about NOK 68 million
remained on paper—approximately EUR 6.58 million. This is an additional internal cash analysis, not an official FCF metric.
The fourth quarter is particularly important from a seasonal perspective. In 2025, it alone generated nearly 1.98 billion NOK in operating cash flow. A recovery is therefore plausible, but not yet warranted. In addition, Atea sells receivables through a securitization program; as of September, these totaled 1.88 billion NOK. This financing must also be taken into account when assessing cash flow quality. My assessment remains cautious here.
5 Dividend Filters
The approved dividend for 2026 totals 7.50 NOK per share, or about 0.73 EUR. Half was paid in May, and the other half is scheduled for November. Based on the current share price, this results in a gross yield of 4.38 percent.
From 2021 through the scheduled 2026 distribution, this corresponds to approximately 8.4 percent annual growth. This sequence includes four increases and one year with no change; the 2026 dividend has not yet been paid in full. The longer history has not been consistently upward: in 2019, 6.50 NOK was paid, and in 2020, only 5.00 NOK.
Atea generally aims for a payout of about 70 to 100 percent of net income. The 7.50 NOK corresponds to approximately 95 percent of the undiluted earnings per share for 2025. At the same time, actual cash payments over the past twelve months—totaling approximately 808 million NOK—exceeded the company’s free cash flow (FCF) of 526 million NOK, representing about 154 percent. An attractive track record is no substitute for a coverage analysis in this context.
For Norwegian tax purposes, Atea classifies the distribution as a repayment of paid-in capital. This does not imply blanket tax exemption for investors in other countries. My verdict: a welcome distribution, but with a limited earnings buffer and currently weak cash coverage.
6 P/E
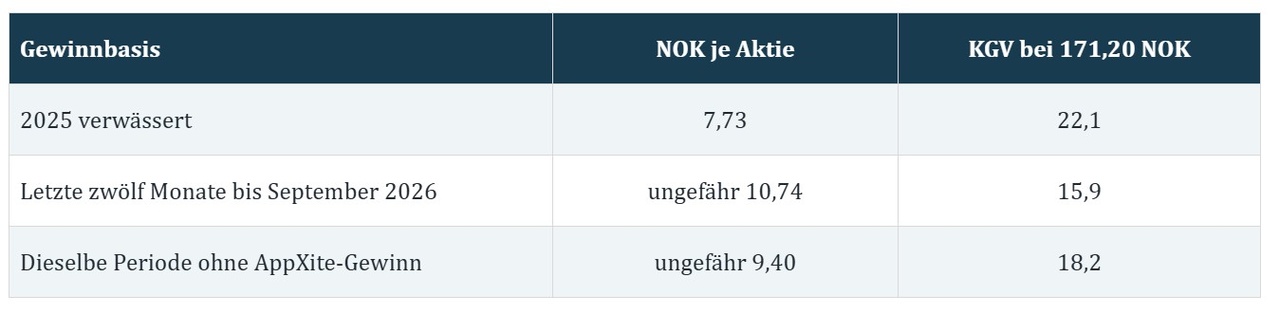
The last line is my own estimate: The tax-free AppXite profit of 152 million NOK is calculated per share using the diluted average number of shares for the nine-month period. Different weighted share counts also make the rolling EPS calculation slightly imprecise.
An adjusted P/E ratio of 18 is reasonable for an established company with growth and dividends. I don’t yet see this as an obvious bargain. In any case, I wouldn’t report the lower P/E ratio of about 16 without accounting for the one-time effect.
7 P/B
Calculation on a twelve-month basis Earnings
Market capitalization approx. 19.10 billion NOK / operating cash flow 945 million NOK = KCV 20.2
Market capitalization / company FCF 526 million NOK = Price-to-FCF ratio 36.3
Company FCF / Market Capitalization = FCF yield 2.75%
The KCV is the ratio to operating cash flow. The ratio to free cash flow is a different metric and is therefore reported separately. Both indicate that, based on the most recent actual cash inflows, the stock is valued at a higher premium than it would be based on reported earnings. A strong Q4 cash flow recovery could improve this picture. Until then, it remains an expectation.
9 P/B Ratio and Balance Sheet
Key figure as of September 30, 2026 / Value
Equity: 4.14 billion NOK / 400.33 million EUR
P/B ratio based on share price = 4.62
Net debt as defined by the credit agreement = 1.35 billion NOK / 130.57 million EUR
Net debt to pro forma EBITDA under the covenant = 0.6
At first glance, the debt ratio appears comfortable. However, the company’s definition excludes additional IFRS 16 lease liabilities of approximately 1.42 billion NOK. It therefore does not provide a complete picture of all financial obligations.
Equity is also not a solid safety buffer: The goodwill of 4.22 billion NOK already slightly exceeds total reported equity. While this can occur after numerous acquisitions, it makes the book value less useful as a valuation anchor. The liquidity reserve of NOK 4.76 billion cited by Atea is primarily an accounting measure of debt capacity up to the covenant limit and does not represent an actual cash balance in the account.
10 Current Figures and Catalysts
The announcement on October 22, 2026 shows a positive operational trend.
Demand for data center hardware is particularly important.
Gross revenue reflects the larger volume of business sold. For parts of the software and services business, Atea recognizes only its own brokerage services as revenue under IFRS. Therefore, the figures of 13.86 and 9.86 billion NOK are not contradictory.
Defense IT: During the earnings call, management cited currency-adjusted growth of nearly 40 percent in this customer segment. As early as November 2025, an NCIA contract with an estimated total value of approximately 130 million EUR over four years was announced. The current report states that this major service contract will begin in Q4 2026 and run through 2029. The contract value does not represent annual revenue or a guaranteed profit amount.
AI: Atea sees rising demand for servers, storage, and networks, as well as for consulting and operations. The company does not report separate AI revenue. The area is thus part of its business operations, but its exact contribution to earnings remains unclear.
For the full year, management expects EBIT of 1.710 to 1.745 billion NOK, or approximately 165.51 to 168.90 million EUR. This figure includes 152 million NOK in AppXite profit. Excluding this amount, the calculated range is NOK 1.558 to 1.593 billion. Slower currency-adjusted revenue growth is expected for Q4; management remains confident for 2027. According to the published financial calendar, the next annual results are scheduled for February 9, 2027 .
11 Competition and Risks
In my view, the risks lie particularly in the narrow margins, the financing of working capital, and the high dividends. While rising hardware prices increase revenue, they can strain customer budgets and squeeze margins under fixed-price contracts. According to management, approximately half of the hardware growth in Q3 was attributable to higher prices.
Public-sector customers mitigate some cyclical risks but can postpone purchases. Added to this are dependencies on major manufacturers and the NOK currency for euro investors. The company’s history also includes the 2018 conviction of its Danish subsidiary for past corruption. Atea subsequently implemented a self-cleaning program in accordance with EU public procurement law. This is not evidence of a new case in 2026, but it does highlight how important compliance is in public procurement.
When it comes to AI, I see primarily opportunities for additional infrastructure contracts. At the same time, automation can change billable consulting and operational services. Manufacturers can deliver more directly, and customers can handle some tasks themselves. For the next three to five years, I view this as a business risk to monitor; AI revenue alone would not be proof of a lasting moat.
12 Future Outlooks and Scenarios
My positive thesis is: More computing power must be procured, installed, secured, and operated. Atea has the customer access and skilled personnel to do this.
To generate good returns for shareholders, the company must also increase its value creation and free cash flow.
My own scenarios for 2027 to 2028:
- Positive scenario: With sustainable earnings per share of 12.50 to 13 NOK and a P/E ratio of 17 to 18, this results in a potential share price range of approximately 213 to 234 NOK, or 20.62 to 22.65 EUR.
- Mixed scenario: With earnings per share of 11 to 12 NOK and a P/E ratio of 16, this results in a potential share price range of approximately 176 to 192 NOK, or 17.04 to 18.58 EUR.
- Negative Scenario: With earnings per share of 9 NOK and a P/E ratio of 14, this results in a potential share price range of approximately 126 NOK or 12.20 EUR.
These scenarios are our own conditional calculations and do not include the profit from the AppXite sale. They are neither company forecasts nor guaranteed fair values. Any dividends are not included. Exchange rate fluctuations may affect the euro return.
13 Technical Analysis
The weekly chart takes precedence for long-term analysis.
As of October 29, the stock is trading at 171.20 NOK, above the 50-week EMA of 160 NOK and the 200-week EMA of 144 NOK.
The overall trend is therefore positive. The weekly RSI stands at approximately 57. The weekly MACD is still below its signal line, although the most recent price movement has improved.
On the daily chart, Atea has recovered from the most recent correction. The 50-day EMA is around 165.22 NOK, and the 200-day EMA is at 161.57 NOK. The daily MACD has turned upward, and the RSI is also near 57. A short-term pause may occur at the upper Bollinger Band around 172.82 NOK. However, touching the band alone is not a sell signal.
Technical reference levels from the charts as of October 29, 2026:
- First pullback zone: 165 to 167 NOK, or approximately 15.97 to 16.16 EUR.
- Lower support zone: 160 to 162 NOK, or approximately 15.49 to 15.68 EUR.
- Notable recent low: approximately 157 NOK, or around 15.20 EUR.
- Major resistance: approximately 179 to 180 NOK, or around 17.33 to 17.42 EUR.
These levels are snapshots. A sustained weekly close below 157 NOK would call the recent recovery into question and suggest another test of that level. However, this alone does not yet indicate a fundamental breakdown.
14. BARGAIN HUNTERS LIST
Technical monitoring plans for approximately three to nine months:
- Current price basis: Entry at 171.20 NOK, first target at 179 NOK, and risk level at 157 NOK. This results in a risk-reward ratio of 0.55 : 1.
- Pullback with stabilization: Entry at 165 NOK, first target at 179 NOK, and stop-loss at 157 NOK. This results in a risk-reward ratio of 1.75 : 1.
- Deeper pullback with stabilization: Enter at 160 NOK, first target at 179 NOK, and stop-loss at 153 NOK. This results in a risk-reward ratio of 2.71 : 1.
- Confirmed breakout: Entry at 181 NOK, first target at 190 NOK, and stop-loss at 173 NOK. This results in a risk-reward ratio of 1.13 : 1.
Euro equivalents for the price levels mentioned:
- 153 NOK is approximately 14.81 EUR.
- 157 NOK is approximately 15.20 EUR.
- 160 NOK is approximately 15.49 EUR.
- 165 NOK is approximately 15.97 EUR.
- 171.20 NOK is approximately 16.57 EUR.
- 173 NOK is approximately 16.74 EUR.
- 179 NOK is approximately 17.33 EUR.
- 181 NOK is approximately 17.52 EUR.
- 190 NOK is approximately 18.39 EUR.
The ratio should always be interpreted as opportunity : risk.
Calculation: potential profit divided by potential loss.
Example for an entry at 160 NOK: (179 − 160) / (160 − 153) = 2.71.
The 153 NOK level serves as a risk buffer below the most recent low; it is not a precise historical support level. The 190 NOK is a preliminary projection target following a successful breakout. To confirm this, a convincing closing price above 180 NOK would be important first. A standard buy-stop order does not check the closing price.
These plans do not constitute a long-term company valuation. Risk levels do not guarantee an execution price; price gaps, slippage, and fees can worsen the actual outcome. The calculated risk-reward ratio says nothing about the probability of occurrence.
15 My Personal Conclusion
For me, Atea is a company worth keeping an eye on.
The group has been in business for decades and can address specific customer needs in digitalization, AI infrastructure, and defense IT.
The dividend makes the overall package even more attractive.
However, my enthusiasm ends where high hardware revenue is automatically equated with high earnings quality. The adjusted valuation metric is less favorable than the reported P/E ratio, and cash flow coverage needs to improve.
That’s precisely why the fourth quarter would be the next crucial checkpoint for me.
My overall verdict: an interesting Scandinavian IT stock; for now, it’s best to watch it or wait for a more favorable pullback.
For long-term investors, the story becomes more compelling if growth reliably generates more free cash flow per share.
What do you think of Atea? Have you had this name on your radar, or have you so far been focusing on the large, well-known companies in AI and defense?
Sources and Calculation Basis
The four valuation ratios are based on 171.20 NOK and approximately 111.56 million outstanding shares, excluding treasury shares, as of September 30. No subsequent changes in the number of shares are assumed. Twelve-month figures were calculated as the full year 2025 plus nine months of 2026 minus nine months of 2025. The price-to-FCF ratio is separate from the P/E ratio. Figures are rounded.
Q3 2026 Originalbericht, insbesondere Seiten 3, 10–17, 23, 26–28 und 33–34
Q3 2026 Präsentation und Ausblick
Offizielle Ergebnismeldung vom 22. Oktober 2026
Managementgespräch vom 22. Oktober 2026
Unternehmensprofil und Geschichte
Steinar Sønsteby und sein beruflicher Werdegang
Dividendenpolitik und Zahlungshistorie
Offizielle Meldung zum NCIA-Auftrag vom 25. November 2025
Veröffentlichter Finanzkalender
Historische Einordnung durch Store norske leksikon
Historische Compliance-Meldung von 2018
Dustin Unternehmensprofil, Bechtle Geschäftsmodell and Computacenter Investor Relations
EZB-Referenzkurse, abgerufen für 29. Oktober 2026
and, of course, everyone else :)
+ 6
1414

1Mes·
Dell Out
... it was always clear that I would sell them at the first clear sign of trouble.
Yesterday, a bank downgraded them from “Overweight” to “Equal Weight.” And they’re unlikely to benefit from the current sell-off anyway. Since the stock has grown much larger than I expected—and I’ve already partially sold it in the meantime (it was originally intended as a trade)—I’ve now sold it off completely.


1Mes·
A Million with Satellit - MSCI World Momentum Champions - September 2026 Monthly Report
🚀 Month 9 since the start has also gone really well again. 🚀
So far this year, things really only went downhill from mid-June to the end of July, but over the last two months, the upward trend has continued. And yes, the 30k mark has been broken once again 😍
According to the algorithm, I was on track with Lumentum ($LITE (-4,59%) ), Kioxia ($285A (-4,9%) ), Micron ($MU (-2,83%) ), Hewlett Packard Enterprise ($HPE (-1,33%)), Recruit Holdings ($6098) (-3,47%) and Dell ($DELL (-4,2%) ). In addition, outside the algorithm, we are invested in SanDisk ($SNDK (-5,39%) ).
The starting value was around 26,300 euros. Due to capital gains tax on the sale of Western Digital ($WDC (+0,28%) ), 650 euros were lost; however, a capital inflow of 720 euros largely offset the tax.
All in all, September delivered a gain of almost exactly +15% for the satellite portfolio.
+4,000 euros in capital gains 🚀
Who was involved and how it went:
- Lumentum +11% 🚀
- Kioxia +16% 🚀
- SanDisk +16% 🚀
- Micron +15% 🚀
- Dell +21% 🚀🚀
- HPE +25% 🚀🚀
- Recruit +1% 🐌
The overall result was driven equally strongly by all of them. Only Recruit Holdings was unable to keep pace with the strength of the others.
YTD, the momentum performance now stands at a strong +110% TTWROR. 🤯😍
The analyses will now show whether there will be any changes for October. At least, that’s what I’m expecting. The analyses are underway...
Only 33 more to go until a million 🥹
Edit: Recruit Holdings is no longer in the portfolio for October. After a long wait, we now officially welcome SanDisk to the MSCI World Index—and thus directly into the portfolio (I’d already held it for a while as a precaution)—and Marvell has also made it back into the lineup. Here’s to a great October, which we’d love to see bring us the 3x.xxx,xx € mark!
7Posizioni
30.219,25 €
27,78%
2121
19 Commenti
Recruit Holdings is being dropped from the index, and SanDisk and Marvell Technology are being added
•
55
•1Mes·
🤫 99% Risk of a Crash & a Revenue Disaster: Why This Crashed AI Stock Still Belongs on Our Bargain-Hunting List!
Hey, everyone! ☕🍁
It’s great to see so many of you here!
But before we dive deep into the numbers, I have to confess something right off the bat:
Well, that thing about “99% cluster risk & revenue disaster” was, of course, just a nasty clickbait headline—and you all fell for it like a house on fire! 😉
But hey, let’s be honest: It a lie, unfortunately. That number is, after all, set in stone in the financial statements!
After poring over the latest reports in the conservatory with a fresh pot of coffee, we came across a stock that’s currently taking a pretty spectacular nosedive.
We’re talking about TSS $TSSI At first glance, this looks like a total write-off—but anyone familiar with our eye for the extraordinary knows:
It’s precisely where the panic is at its peak that the most exciting turnaround opportunity is sometimes hiding. You’ll find out why the company is still very interesting at the end.
Grab a hot cup of coffee, join us in the heated sunroom, and let’s break this down without any rose-colored AI glasses:
1. Business Model – What Does TSS Actually Do?
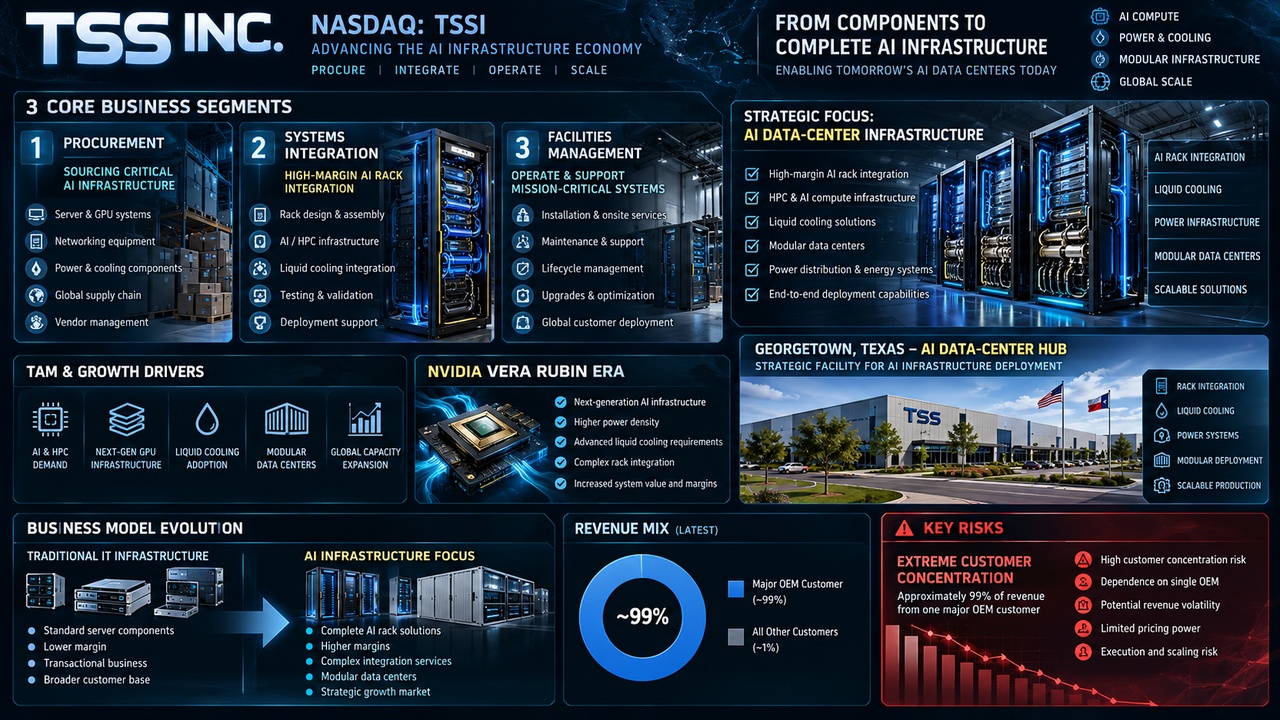
TSS plans, configures, integrates, and operates data center and IT infrastructure. The business is essentially divided into:
Procurement: Purchasing and reselling hardware. High revenue, low margins, and volatile.
Systems Integration: Servers—and in particular AI/HPC racks—are configured, integrated, tested, and deployed for customers.
Facilities Management: Operation, maintenance, logistics, and infrastructure related to data centers.
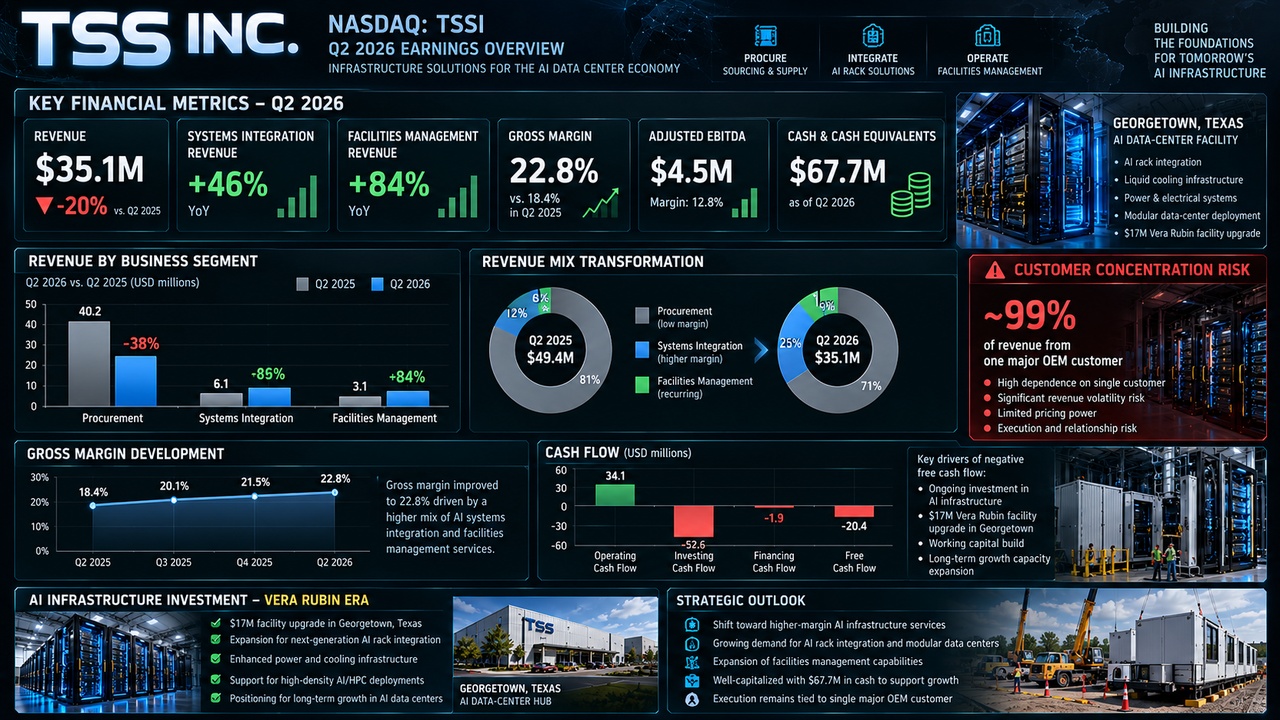
The last two areas, in particular, are exciting. In Q2, Systems Integration grew by 46% to $13.9 million, while Facilities Management grew by as much as 84%. Weak procurement revenue, on the other hand, dragged down total revenue by 20%.
TSS is therefore less of an “AI hardware manufacturer” and more of a provider that ensures the hardware can be installed and operated in the first place.
2. Market Position & Moat—Moat or Garden Gate?
Here, the regulator must immediately pour the first bucket of cold water:
TSS does not have a classic moat.
There is no proprietary chip architecture, no platform with network effects, and no patented miracle technology.
What TSS does have is:
- specialized infrastructure and expertise in high-density computing,
- well-established OEM relationships,
- physical capacity,
- experience with complex rack integrations,
- speed in rolling out new platform generations.
Georgetown, Texas, is particularly interesting. TSS is investing approximately 17 million USDto prepare the facility for NVIDIA’s $NVDA (-4,25%) upcoming Vera Rubin platform . Management expected completion in mid-September and additional revenue primarily starting in Q4.
But there’s an elephant in the room:
Dell most recently accounted for about 99% of revenue.
That’s not a normal customer concentration. It’s practically a dependence on a single company.
If this relationship ends or Dell $DELL (-4,2%) postpones the integration, the lights could go out here very quickly.
Competitive moat: moderate to weak.
Customer Stickiness: high.
Customer Risk: extremely high.
3. Core Quality Formula
Our formula:
Revenue growth + operating margin
Q2 2026: Total revenue: $35.1 million
Year-over-year growth: −20%
GAAP operating income according to the quarterly table: approximately $2.1 million.
Operating margin:
2.1 / 35.1 = approx. 6.0%
Therefore: −20% + 6% = −14 points
➡️ Core Quality Score: −14
According to the specified scale: <15 = weak/speculative.
That looks brutal—and mathematically, it’s correct.
However, you have to understand why revenue is falling:
Procurement plummeted by 45%, while the higher-value systems integration business grew by 46% and facilities management by 84%. At the same time, the gross margin jumped from 16.4% to 22.8%.
So TSSI is currently a mix-shift/turnaround case, not a quality growth compounder.
4. Cash Flow Quality Formula
Here, things get uncomfortable again.
In the first half of 2026:
Operating cash flow: −7.295 million USD
CapEx: 4.609 million USD
Therefore:
FCF = −7.295 − 4.609 = −11.904 million USD
With a market cap of approximately 262 million USD:
H1 FCF yield ≈ −4.5%
Not annualized. Still, the trend is clear.
The Pro Report also shows a negative LTM FCF yield.
➡️ Cash flow quality is currently weak.
However, significant funds are currently being invested in capacity expansion for Vera Rubin. Therefore, the negative FCF here is understandable, but it cannot be ignored.
The company has sufficient liquidity to afford this expansion at the moment.
5. Dividend Filter
In a nutshell:
Dividend: $0.
Therefore:
❌ No 3.5% yield
❌ Not an income stock
❌ Not a cash flow investment
There’s no sugarcoating it here. TSSI is a growth/special-situation bet.
6. P/E ratio
Depending on the data provider, the following figures are currently reported:
Trailing P/E: approx. 18x
Forward P/E: approx. 27x.
The Pro Report from September 18 showed a trailing P/E of 16.9x and a forward P/E of 37.4x; for a company with very limited analyst coverage, the forward multiples fluctuate significantly.
18x trailing is not expensive for an AI infrastructure stock.
However, 27x forward is not an obvious bargain either, given that total revenue is currently shrinking.
The valuation argument is therefore not: “Cheap stock.”
Rather:
“If the higher-margin AI integration business scales significantly, today’s valuation could look favorable in hindsight.”
That’s an important distinction.
7. P/E Ratio
When it comes to cash flow, the classic KCV is currently of little use.
LTM operating cash flow in the Pro-Report: approximately −9.4 million USD.
With a market cap of around 262 million USD, that would mathematically result in approximately:
P/CF ≈ −28 .
However, a negative KCV has no meaningful traditional valuation interpretation.
➡️ KCV currently unusable / warning sign.
8. P/S
TTM revenue: 193.3 million USD
Market Cap: approx. 262 million USD
Therefore: P/S ≈ 1.36
That’s interesting for an AI infrastructure stock.
If systems integration and facilities management account for a larger share of the revenue mix in the future, a P/E ratio of around 1.3 could certainly be attractive as the overall margin increases. But only then.
9. KBV
Equity as of June 30: approximately 80.3 million USD.
Market cap: approximately 262 million
Therefore: P/B ratio ≈ 3.3
Not a deep value play.
But not an absurd AI valuation either.
For TSSI, book value is significantly less important anyway than the question of how much EBITDA its new infrastructure can generate.
10. Current Figures & Catalysts
At first glance, Q2 was dismal: Revenue: $35.1 million, −20% YoY
Expectations around $47.1 million
EPS $0.05 instead of the expected $0.06.
That’s why the stock took a massive hit after the earnings report.
Under the hood, things looked better:
Systems Integration +46%
Facilities Management +84%
Gross margin 22.8% vs. 16.4%
Adjusted EBITDA +12% to $4.5 million
Management also maintained its FY2026 adjusted EBITDA guidance at the upper end of $20–22 million .
The key catalyst is NVIDIA Vera Rubin
TSS is investing approximately $17 million in power and cooling infrastructure for the next generation of NVIDIA products. The company expects the majority of the revenue contribution from this investment to come primarily starting in Q4 2026.
And this is precisely where regulators need to be meticulous:
As of today, I have not yet been able to find an official announcement stating that the renovation has now been fully completed.
The latest investor relations announcement from September 21 merely concerns an investor event. TSS, Inc.
So no made-up green checkmark. This still needs to be confirmed.
11. Competition & Risks
The risks are not merely cosmetic.
Dependence on Dell: Relying on a single OEM for roughly 99% of revenue is the biggest problem.
Execution Risk: The Vera Rubin expansion must be successful and operate at full capacity.
Supply Chain: Storage, cables, and other rack components sometimes limit throughput.
Volatile Procurement: This can cause extreme fluctuations in a single quarter.
Competition: Larger IT integrators such as CDW, IBM, Accenture, and Rackspace have significantly more resources.
Technological Advances: AI infrastructure is changing extremely rapidly; TSS must invest continuously.
The stock itself: Beta of about 2—this isn’t a stock where you can just sit back and collect dividends.
And once again: The biggest red flag isn’t valuation or debt.
It’s customer concentration.
12. Future Outlook
The key story is this: Today, the business is still dominated by a volatile procurement segment.
Tomorrow, a larger share is expected to come from: AI Rack Integration + Facilities Management + Modular Data Centers .
This would be fundamentally very attractive because these areas generate higher margins.
The CEO even explained during the Q2 earnings call that the company’s current facilities have 2–3 times the capacity of the contractually guaranteed minimum volume; the bottleneck is more a matter of operational efficiency or the supply chain than demand.
In addition, TSS is planning further modular data centers and is explicitly seeking to expand its customer base beyond the currently dominant OEM.
If this succeeds, TSSI could undergo a significant fundamental transformation.
If not, we’ll still have a small service provider that is practically dependent on a single major customer. That’s the bet.
13. Technical Analysis – Weekly Chart
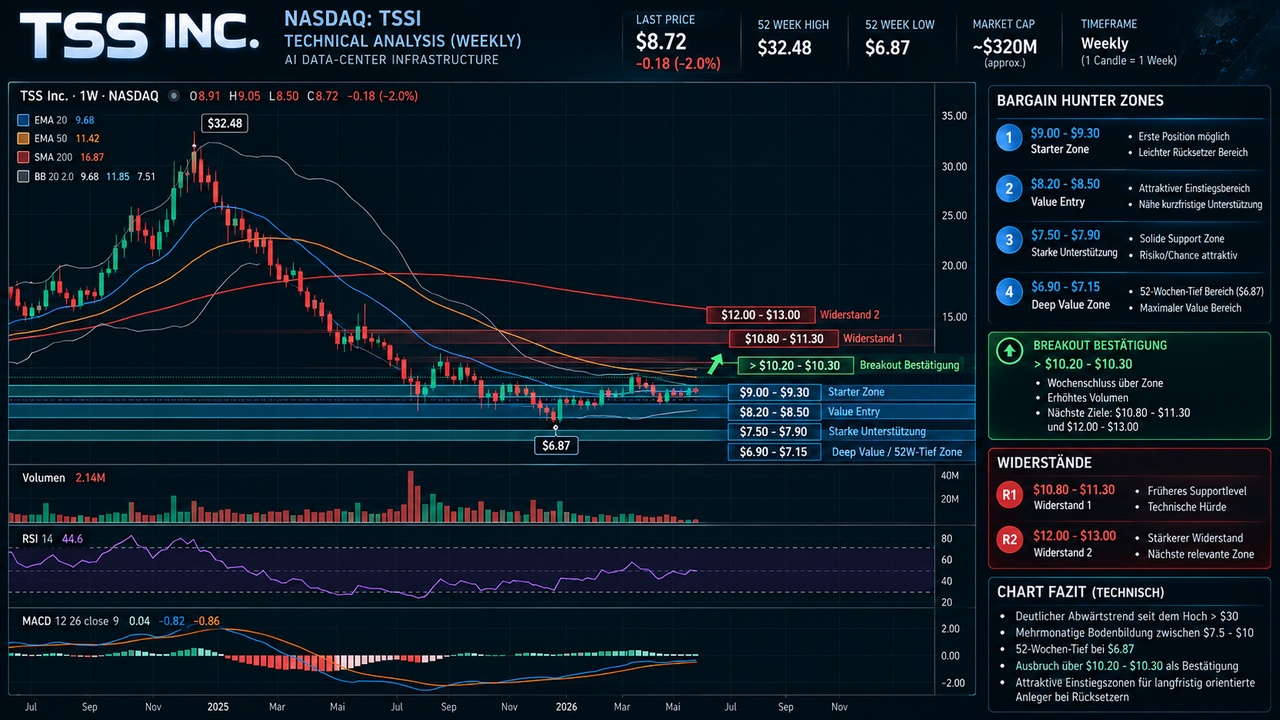
The long-term hype has been completely priced out.
From the range around $30 , the price plummeted. This was followed by a series of lower highs over several months, until it finally stabilized roughly between $7.5 and $9 .
On the weekly chart, I currently see:
Price: back around $9–10
RSI: around the mid-40s—neutral, not overbought
MACD: still below zero, but downward momentum is easing
50-week trend: still problematic
Long-term support: intact
Volatility/ATR: has declined significantly.
In short:
Bottom forming, yes. New long-term uptrend, not yet.
For a speculative turnaround stock, this is actually exactly the phase that gets interesting.
The daily chart is already looking better: MACD is turning upward, RSI has recovered, and since early September we’ve been seeing higher lows.
The first key resistance zone is roughly at: $9.50–$10.30.
After that: $10.8–11.3
and then the significantly tougher zone: $12–$13.
A sustained break above these levels would significantly improve the chart picture.
14. Bargain Hunter’s List – Entry Zones
Now comes the range that the Wintergarten Oversight Committee usually measures with a folding rule.
Zone 1 – Starter: $9.00–9.30
This is the current base. Acceptable for a small entry.
Zone 2 – Good Bargain: $8.20–8.50
Demand has been seen here on multiple occasions. The CRV is becoming significantly more attractive.
Zone 3 – Strong Support Zone: $7.50–7.90
This is the actual September bottom range.
Zone 4 – disaster level: $6.90–7.15
Close to the 52-week low of $6.87. There, the valuation would become extremely attractive—provided there is no fundamental reason for the decline.
And then there’s the momentum scenario:
>$10.20–$10.30 with convincing volume
In that case, you pay a bit more, but in return you get confirmation that the current base has been broken.
Not my favorite strategy:
chasing $10–11 when the stock is already up +10 or +15% in the morning.
15. My Personal Conclusion
All right, feet off the garden table. Now for the reality check.
$TSSI I like it much better than many AI microcaps, because here there’s already:
- a real business,
- real revenue,
- profitability,
- plenty of cash,
- manageable debt,
- genuine AI infrastructure,
- a concrete Vera Rubin catalyst
are in place.
As of June 30, TSS had approximately $67.7 million in cash. The balance sheet is therefore quite solid for a company with a market capitalization of only about $262 million.
What I particularly like is the shift in quality within the business:
Total revenue is down—but high-margin AI integration is surging.
This could be the start of a meaningful transformation.
However: The 99% dependence on Dell is no minor flaw.
That’s why I would never treat TSSI as a safe AI compounder.
Furthermore, free cash flow is currently negative, and the long-term weekly chart hasn’t recovered yet.
So here’s the Terrassenaufsicht verdict:
🟡🟢 TSSI – speculatively interesting, but not yet a quality investment.
No “all in.” No FOMO buy.
But in the range of $8–$9.5 , I find the risk-reward ratio interesting.
If Vera Rubin ramps up as planned, Systems Integration continues to grow at double-digit rates, and TSS simultaneously lands a second major client, the investment case could improve significantly.
For me, this second major client might even be more important than the next impressive revenue record.
Because:
Reducing Dell’s share from 99% to, say, 70–80% would fundamentally transform the company.
Smaller alternatives in the same broader AI infrastructure sector include, for example, Silicom, POET Technologies or Navitas Semiconductor. Some of these companies have more technological leverage, but are either significantly more speculative or are now valued much higher.
As far as I’m concerned, TSSI currently occupies an interesting middle ground:
small enough to offer real upside potential, yet large and operational enough that we’re not just buying PowerPoint slides here.
And so, for now, TSSI gets to keep a seat in the sunroom.
And, of course, everyone else :)
1616
3 Commenti
1Mes
Phew. That all sounds really bad. Let me guess: your investment model was screaming “NO,” and TSSI doesn’t fit into any category. I don’t have room in my portfolio for bets like that right now. I’d rather wait and see what $GWH does or use the money to add to my existing positions.
Great presentation anyway—well-structured, as we’ve come to expect from you guys. Best regards
Great presentation anyway—well-structured, as we’ve come to expect from you guys. Best regards
•
22
•
2Mes·
Amodei's call for a "pause" targets the wrong part of the AI value chain
Slows down Dario Amodeis Is the call for a slower pace in AI now hampering the industry’s growth? The Anthropic CEO called for this over the weekend in his essay “We Must Pace the Frontier”—to deliberately slow the advancement of AI model capabilities— OpenAI CEO Sam Altman and xAI CEO Elon Musk publicly agreed within hours.
Amodei’s core argument: Recursive self-improvement and security incidents such as the OpenAI Hugging Face incident showed that the models’ capabilities are growing faster than the ability to control them. His three-step plan begins with independent auditors working directly within the companies. By this, he means not
halt to training, but rather more time for safety work to proceed in parallel with progress.
Why many see this as a brake on growth
Within the community, the call is being interpreted as a warning sign regarding the AI industry’s high growth rates. A slower pace in the release of new models could dampen demand for fresh computing power and thus weigh on the valuations of AI companies and Neoclouds. Coinciding with the announcement, market prices for Anthropic and OpenAI shares fell.
Why this misses the actual driver of growth
Amodei’s appeal targets the training of new models—and it is precisely this part of the AI value chain that is now the smaller and shrinking segment. According to Deloitte, by 2026, around two-thirds of global AI computing power will be directed toward inference (the ongoing operation of already trained models).
And it is precisely this demand for inference that is growing faster than ever before:
- $GOOGL (+1,18%)-Cloud order backlog: from $240 billion to $460 billion within one quarter
- Tokens processed by Google: 16 billion per minute, an increase of 60% compared to the previous quarter
- $MSFT (+0,64%): AI order backlog increased more than twelvefold
- GPU rental prices have grown from ~10 million/MW in early 2026 to as much as ~40–50 million/MW today
So the real bottleneck remains computing power itself, not the political will to slow things down. Microsoft and Google each have investment budgets of around $180–190 billion just to meet demand at all. Training pacing is unlikely to make much of a difference to this scarcity as long as current models are already so powerful for users that demand for their use continues to grow.
Overall , the appeal seems more like a shift in priorities—away from a pure race for capabilities and toward greater safety and control. In my opinion, it is wrong to believe that this will act as a brake on the entire AI value chain.
The largest and fastest-growing part of it—inference—remains virtually untouched by the debate.
This announcement could also come at a strategically opportune time: Training new frontier models costs a great deal of money (tens of billions per model). A deliberately slowed pace would alleviate precisely this cost burden and improve the profitability of Anthropic and OpenAI, just before both are set to make potential IPOs . This safety call—which, incidentally, protects their own balance sheets—comes at just the right time for the model providers.
What are your thoughts on this?
$IREN (-6,87%)$NBIS (-3,86%)$NVDA (-4,25%)$AMZN (+3,74%)$AMD (+3,2%)$WULF (+1,42%)$ORCL (-1,74%)$CSNDX (+0,35%)$AVGO (+2,87%)$SPCX (+1,42%)$PLTR (-0,37%)$META (-0,17%)$CRWV (-7,41%)$DELL (-4,2%)$BE (-3%)$MU (-2,83%)
Sources:
https://darioamodei.com/post/we-must-pace-the-frontier
https://www.deloitte.com/global/en/about/press-room/2026-tmt-predictions.html

darioamodei.comDario Amodei — We Must Pace the Frontier
88
1 CommentoIt's really starting to pick up steam! If a bit of euphoria and FOMO kicks in, we might even see four-digit prices. It's also noticeable that it's being traded pretty heavily—up and down—which means there's a lot of speculation involved.
••

2Mes·
Dell jumps 9.2% to $464 after earnings — Wall Street raises targets as AI demand, margins and guidance all reset higher
⠀
The headline: All 6 firms raised their price targets, with analysts highlighting that Dell’s AI boom is now lifting not just servers, but storage, traditional compute and overall profitability.
Average PT: $614
Implied upside from $464: ~32%
Updated analyst views:
• Melius: Buy — $735 from $650 (+58%)
• Raymond James: Outperform — $617 from $500 (+33%)
• BofA: Buy — $600 from $505 (+29%)
• Mizuho: Outperform — $600 from $500 (+29%)
• Evercore ISI: Outperform — $575 from $550 (+24%)
• Piper Sandler: Overweight — $558 from $497 (+20%)
Why analysts are getting more bullish:
• Q2 revenue reached $47.0B vs. ~$44.9B expected, while EPS of $7.04 crushed the ~$4.90 consensus
• FY27 revenue guidance surged to ~$192B from $167B
• FY27 EPS guidance jumped to ~$25.50 from $17.90
• AI server revenue reached $16.4B, with $61B of orders and backlog climbing to ~$95B
• Dell raised its FY27 AI server revenue outlook to ~$74B from $60B
• Traditional server revenue surged 122% and storage grew 26%, showing AI demand is spreading across the broader infrastructure stack
The margin surprise: Gross margin reached 21.1%, far above expectations, while stronger storage mix and AI scale helped offset component inflation.
The key constraint: Demand continues to exceed available supply across DRAM, NAND, CPUs and other components — BofA estimates demand is running roughly 30% above supply in FY27.
Bottom line: Dell is evolving from an AI-server volume story into a broader infrastructure earnings story. AI is driving server demand, pulling through higher-margin storage and traditional compute, while the massive guidance raise shows the opportunity is translating directly into revenue and earnings.
44
2Mes·
𝐃𝐞𝐥𝐥 𝐓𝐞𝐜𝐡𝐧𝐨𝐥𝐨𝐠𝐢𝐞𝐬: 𝐑𝐞𝐯𝐞𝐧𝐮𝐞 𝐚𝐧𝐝 𝐄𝐏𝐒 𝐒𝐦𝐚𝐬𝐡 𝐄𝐬𝐭𝐢𝐦𝐚𝐭𝐞𝐬 𝐚𝐬 𝐀𝐈 𝐒𝐞𝐫𝐯𝐞𝐫 𝐃𝐞𝐦𝐚𝐧𝐝 𝐒𝐮𝐫𝐠𝐞
⠀
📊 𝐑𝐞𝐬𝐮𝐥𝐭𝐬
• Adj. EPS: $7.04 (Est. $4.92) ✅, +203% YoY.
• Revenue: $46.97B (Est. $44.51B) ✅, +58% YoY.
• ISG Revenue: $31.78B, +89% YoY.
• AI-Optimized Server Revenue: $16.40B, +100% YoY.
• ISG Operating Income: $4.78B, +225% YoY.
• Adjusted Free Cash Flow: $8.15B, +224% YoY.
⠀
🎯 𝐆𝐮𝐢𝐝𝐚𝐧𝐜𝐞
• Q3 FY2027 Revenue: $49.0B (Est. $41.36B) ✅, +81% YoY.
• Q3 FY2027 Adj. EPS: $6.50.
• FY2027 Revenue: $192.0B (Est. $173.33B) ✅, raised from $167.0B.
• FY2027 Adj. EPS: $25.50 (Est. $18.82) ✅, raised from $17.90.
• FY2027 AI-Optimized Server Revenue: $74.0B, raised from $60.0B.
⠀
📌 𝐊𝐞𝐲 𝐓𝐚𝐤𝐞𝐚𝐰𝐚𝐲𝐬
• Revenue surged 58% YoY to a record $46.97B and beat consensus by more than $2B, while Adj. EPS rose 203% and significantly exceeded expectations.
• AI-optimized server revenue doubled YoY to a record $16.4B, while Dell booked $60.9B of AI server orders and exited the quarter with a $95B backlog.
• Infrastructure Solutions Group revenue jumped 89% YoY, with traditional servers and networking up 122% and storage up 26%.
• Dell raised its FY2027 revenue outlook by $25B to $192B and lifted its AI server revenue outlook to $74B.
• The company returned a record $4.3B to shareholders through share repurchases and dividends.
⠀
💬 𝐌𝐚𝐧𝐚𝐠𝐞𝐦𝐞𝐧𝐭 𝐂𝐨𝐦𝐦𝐞𝐧𝐭𝐚𝐫𝐲
“With AI momentum accelerating and our opportunity expanding across the portfolio, we’re raising our full-year FY27 revenue outlook by $25 billion to $192 billion, up nearly 70% year over year.”
88


2Mes·
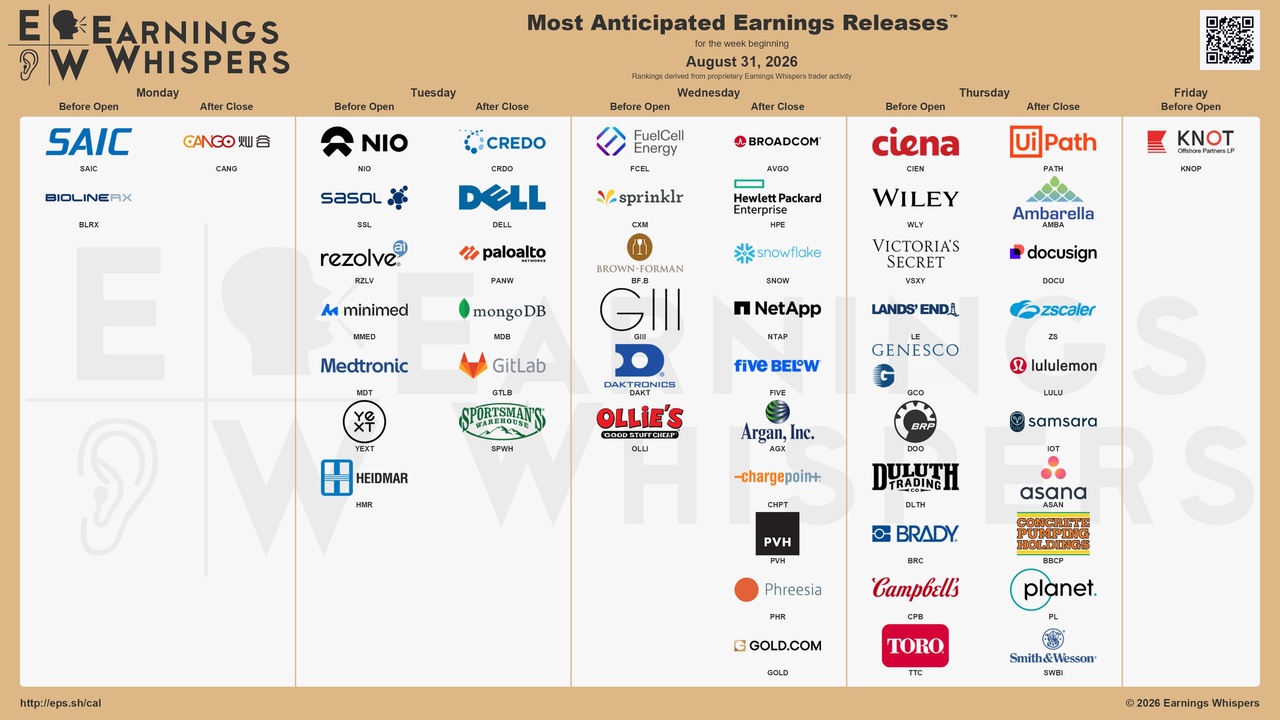
The Week Ahead
Monday, August 31
🇨🇳 3:30 a.m.: Purchasing Managers' Index (PMI)
🇩🇪 2:00 p.m.: Consumer Prices (Inflation) for August 🌶
Tuesday, September 1
🇩🇪 8:00 a.m.: Retail sales for July
🇺🇸 4:00 p.m.: ISM Purchasing Managers’ Index (Manufacturing)
🇺🇸 4:00 p.m.: JOLTs (Job Openings)
Wednesday, September 2, 2026
🇺🇸 8:00 p.m. – Fed Beige Book
Thursday, September 3
🇺🇸 2:30 p.m.: Weekly Initial Unemployment Claims
🇺🇸 4:00 p.m.: ISM Purchasing Managers’ Index (Services)
Friday, September 4
🇺🇸 2:30 p.m.: U.S. Employment Report (Nonfarm Payrolls & Unemployment Rate) 🌶
$AVGO (+2,87%)
$DELL (-4,2%)
$PATH (-4,39%)
$9866 (+0,29%)
$NIO (-0,49%)
$CIEN (-2,98%)

Titoli di tendenza
I migliori creatori della settimana
Dati LSX · Dati fondamentali e di fine giornata da FactSet