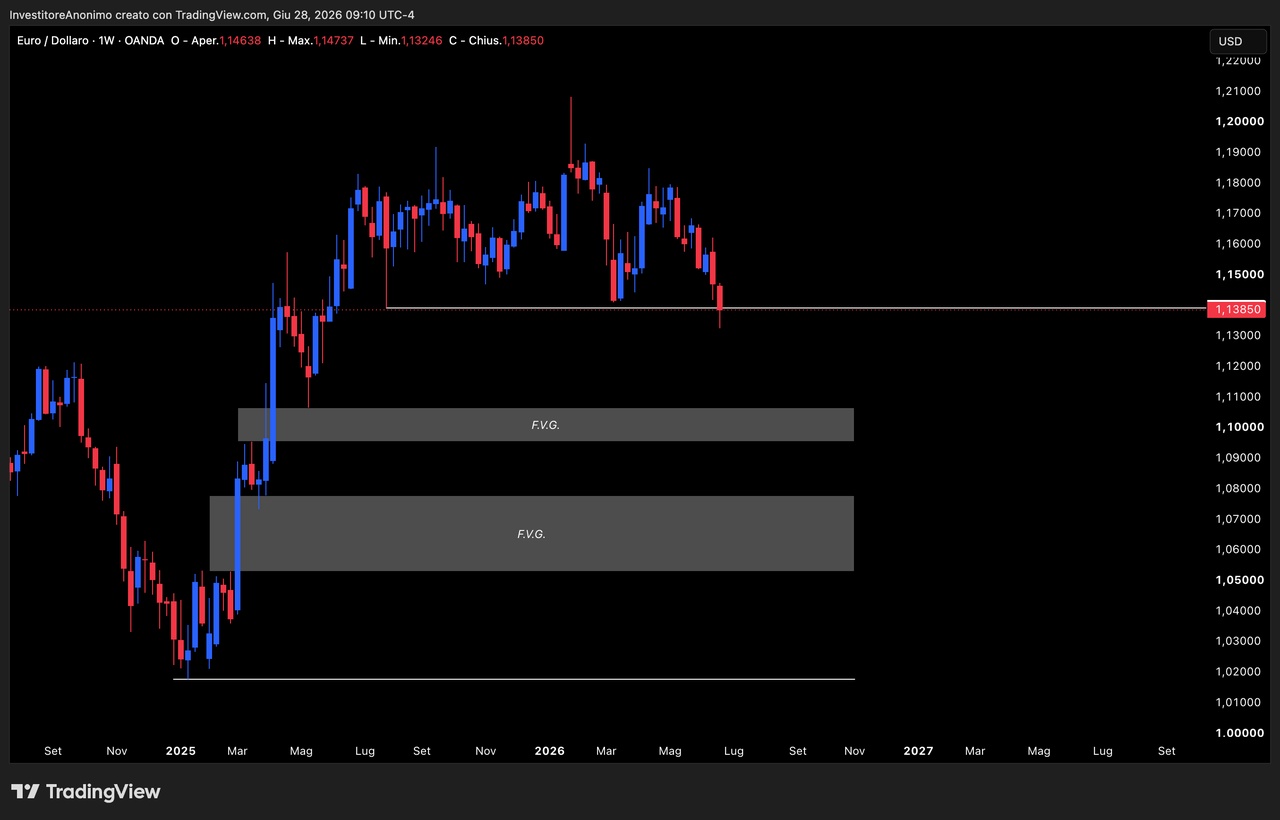

🇬🇧 If you zoom out on the weekly chart of $965275 (+0,09 %) the price action is sending a very clear and strong signal. After a long distribution phase in which buyers repeatedly failed to reach new highs, the bears have finally taken control of the broader market trend. The clean break below the key psychological and structural support level at 1.13850 shifts the entire market structure. In my opinion, this isn’t just a temporary pullback; we are looking at the continuation of a strong bearish trend for the coming months.
Here is my detailed breakdown of the technical picture:
- The Breakdown: The weekly candle closing below that major horizontal level indicates institutional selling pressure. This liquidity sweep confirms that the path of least resistance is now heavily skewed to the downside.
- The First Magnet (1.1000 Area): The first target is the upper FVG (Fair Value Gap). This area represents a historical price imbalance where the market moved too quickly. Price acts like a magnet toward these zones, and I expect a rapid drop toward the 1.1000 psychological level to rebalance the order book.
- The Ultimate Target (1.0500–1.0750): If the momentum persists, the deeper and much wider FVG below will be the ultimate destination. This is a massive pool of unfilled buy orders that the market left behind during the previous rally.
The structural setup is solid, and all signs point toward a complete rebalancing of these lower zones.
🇮🇹 Looking at the weekly chart of $965275 (+0,09 %) from a long-term perspective, the price action is sending a very clear directional signal. After a prolonged distribution phase in which buyers never managed to establish new relative highs, sellers have officially taken control of the macro trend. The decisive break below the key support level at 1.13850 is not a simple retracement, but a genuine shift in market structure. For the first few months of the coming year, my outlook remains strongly bearish, with well-defined short targets.
Here is my detailed analysis of the key points on the chart:
- The Structural Break: The weekly candle’s close below the red horizontal level confirms pressure from large institutional investors. Liquidity below the lows has been absorbed, and the path is now clear for a decline.
- The First Target (1.1000 Area): The price is moving inexorably toward the first FVG (Fair Value Gap). The inefficiencies created by previous bullish impulse moves must be resolved, and I expect the psychological level of 1.1000 to be tested very soon.
- The Main Target (1.0500 – 1.0750): If momentum remains this aggressive, the true long-term target is the second FVG, which is significantly wider. A massive amount of pending orders left unfilled during the previous rally is concentrated there.
The chart pattern speaks for itself, and all volume indicators point toward a gradual decline to fill these price gaps.