
$XDEM (-0.22%)
$XDEV (-1.1%)
$WSML (-0.24%)
$CSPX (+0.4%)
$IWDA (+0.4%)
- Markets
- ETFs
- Xtrackers MSCI World Value ETF
- Forum Discussion

Xtrackers MSCI World Value ETF
ETP
ETP
ISIN: IE00BL25JM42
Ticker: XDEV
IE00BL25JM42
XDEV
Price
Discussion about XDEV
Posts
18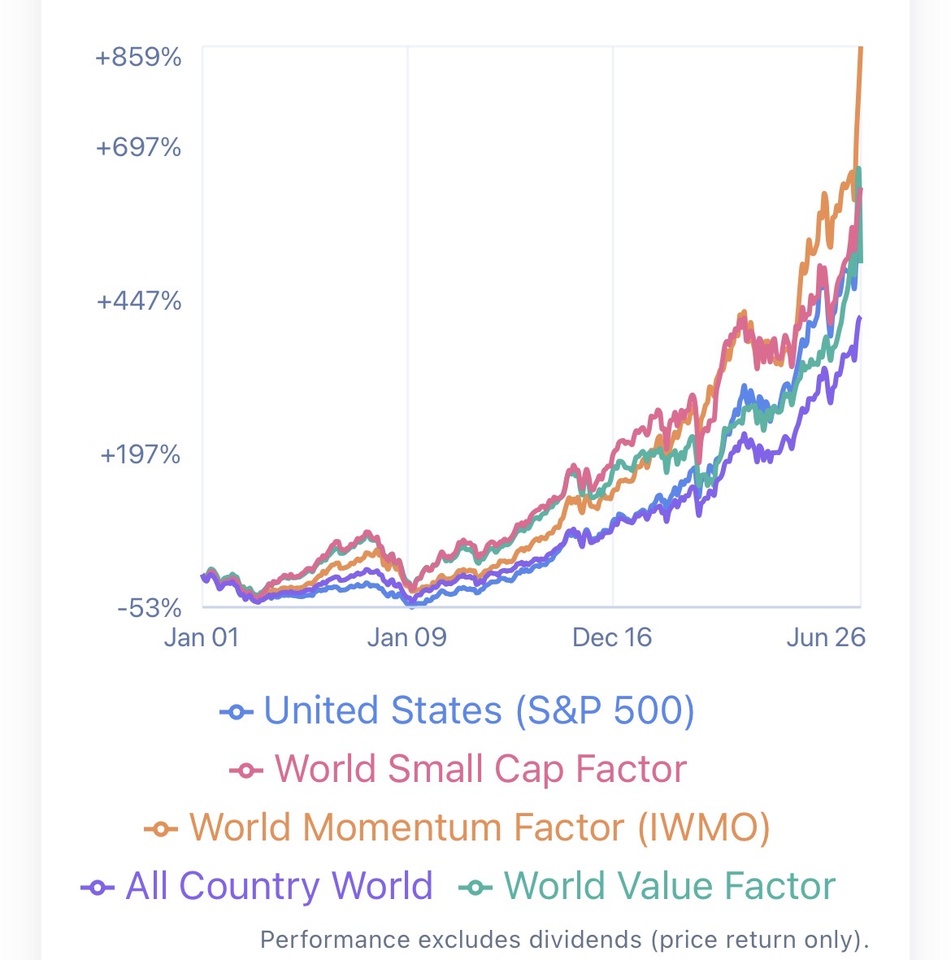
4Wk·
Simple but maybe brilliant investing idea
I bought $MU (-7.98%) at 65 € per stock and I’m still holding. When I bought the stock, it was the most undervaluaded stock in the $XDEV (-1.1%) and it’s still like this ! Meanwhile something straordinary happened. Now MU it’s also in the first seat of $XDEM (-0.22%) . The best value investors understand that it is not enough to buy a stock simply because it is undervalued. You also need to identify companies that the market is likely to become interested in over time. In other words, the goal is to buy stocks that are both cheap and gaining attention.
My idea is to buy stocks that rank highly in both value and momentum indexes, and then sell them when they fall significantly in either ranking. The reasoning is that, if a stock drops in the value ranking, the market may have already re-priced it closer to its fair value. If it drops in the momentum ranking, it may indicate that investor interest is fading.
It would be fascinating to backtest this strategy by analyzing the historical constituents and rankings of global value and momentum indexes over the past several decades. Unfortunately, I have not been able to find historical holdings data for these indexes. Can you help me in this ?
66
4Wk·
A doubt of mine
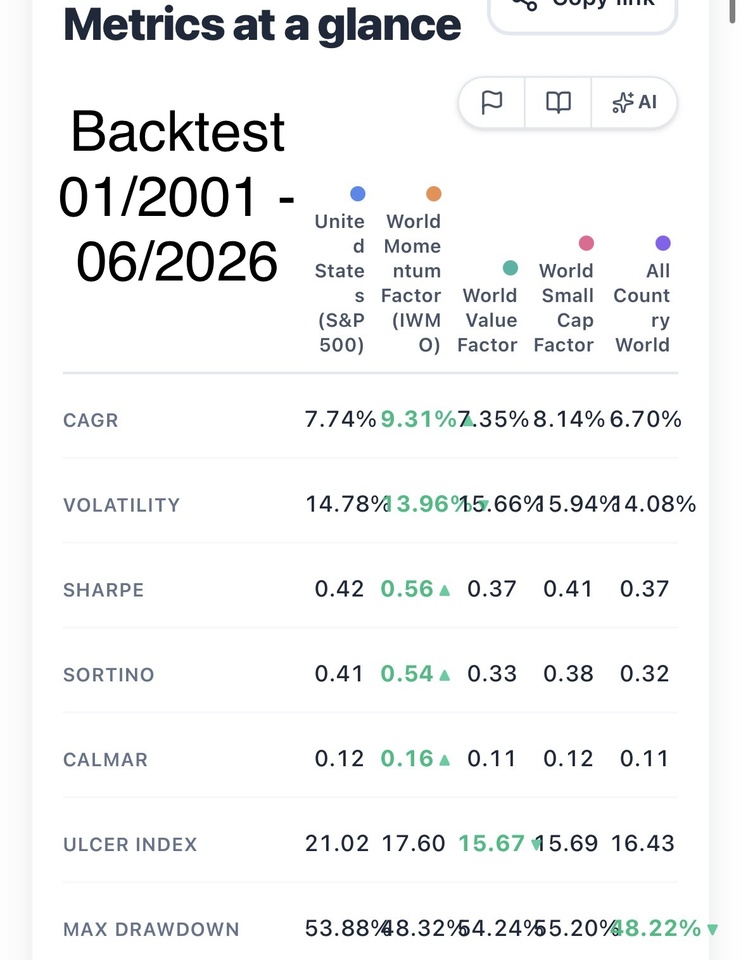
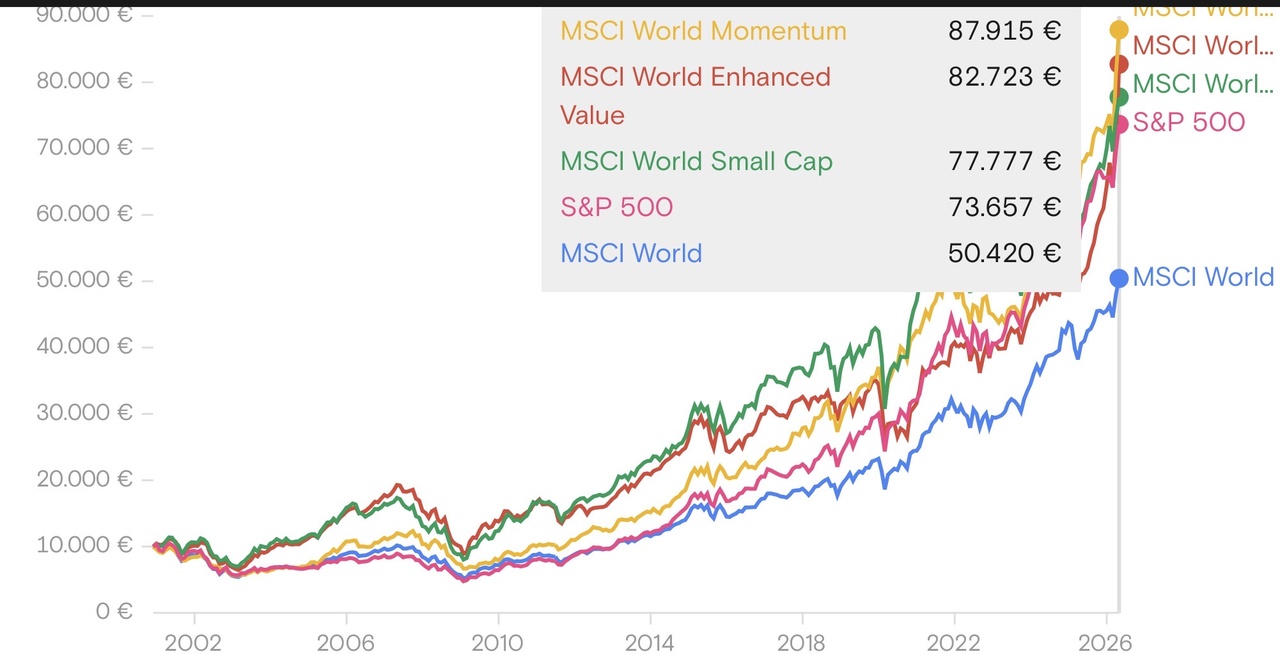
Why people keep on buying $IWDA (+0.4%) or $VWRL (+0%) as core of their portafolio when the following index perform way better (in fact they beat even the sp500 on a long range, meanwhile keeping global diversification and diversification from the big7).
4Wk·
MY PLAN TO LIVE OF DIVIDENDS
Hello everyone, I'm 24 y.o. my portfolio is currently worth 55-60 k eur. My plan is to save around 1000 eur per month and invest in growth product for 15-20 years. Specifically:
GLOBAL ETF (50 % allocation):
MSCI WORLD VALUE $XDEV (-1.1%)
MSCI WORLD MOMENTUM $XDEM (-0.22%)
MSCI WORLD SMALL CAP $WSML (-0.24%)
note: they all have had better return (on long range) in comparision with sp500 and ofc msci core world or ftse all word. Plus these etf offer a real diversification from having the big 7 as first positions.
GLOBAL TECH (50 % allocation):
MSCI WORLD INFORMATION TECHNOLOGY $XDWT (-0.3%)
NASDAQ 100 $XNAS (+0.73%)
note: msci world IT it's good bcs with the time it can move towards international technology stocks and not only american, meanwhile the nasdaq it has the advantage of having also companies that are not directly linked to technology but general innovation (plug power, rocketlab ecc.). BOTH ETF HAVE THE SAME RETURNS OVER THE TIME.
Once I'll reach the milestone of 1 million I'll allocate everything in these 2 etf high dividend stocks:
VanEck Morningstar Developed Markets Dividend Leaders
iShares STOXX Global Select Dividend 100
note: these etf are incredible, they have only 20 % of USA, they are super diversified all around the world + no tech sector present (that is usually speculative, volatile and where bubbles can be more likely to happen). Only big worldwide companies that offers high dividend and are super stable.
BE READY FOR IT:
avarage dividend annually: 4.5 %
avarage growth annualy: 8 %
it means that you start to take 45 k (before tax) annually in dividends + your capital of 1 million is growthing at 8 % rate and doing composite interest over the years. Each year your dividend passive income increase and your capital too. If there is a finacial crises ? well for sure these etf will loose way more then sp500, nasdaq and other products. These companies are defensive, they have big cash flow and investors invest in them when they are afraid of the tech market or others speculative sectors.
LET ME KNOW WHAT YOU THINK ABOUT IT !!!!!
Enjoy your day and let's make it.
55
5 Comments
In theory there is no direct connection between dividend and gained wealth.
You could just stay in your global etf plan and go for it.
Nearly the same goes for sector an Country etfs.
Still everything can go according to plan. Just brace yourself for a smaller crash when high yield stocks cut dividends in half.
You could stay in plan a) and just sell a part of your portfolio. When you need some money.
I plan to hold $XDEM $XDEV $XDEQ $ZPRV $ZPRX and $5MVL for life. Selling small parts of it when I want to spend.
That way I take a more scientific approach and don’t pay unnecessary taxes. At least for me in Germany dividends have high disadvantages anyway
•
22
•
1Mon·
1 Year of Investing Reflecting & Looking Forward 🎯
Today, one year ago I made my first investment with no real strategy, 20/06/2025 I bought my first share of S&P500, started small, €20 here, €50 there, just feeling my way through, buying whatever caught my eye, chasing hype, following trends without any real conviction or framework behind the decisions.
A lot has changed since then. Over the past year I’ve been gradually restructuring, learning what kind of investor I actually want to be, reducing complexity, cutting positions that didn’t serve a clear purpose, and building something I can genuinely stick to for the next 10+ years.
The strategy going forward
Long-term growth portfolio, anchored in global indices, with active conviction in selected factors and companies.
The core is simple: 50% in broad market ETFs
Everything else is built around it with the intention to boost the overall portfolio performance.
Target allocations:
Core = 50-55% $FWRG (-0.04%) + $AVWS (-0.31%) (90%/10%)
World Value ETF = 8-10% $XDEV (-1.1%)
Semiconductor ETF = 6-8% $SEMI (-0.08%)
Emergent Markets = 6-8% $5MVL (+1.08%)
Quality = 3-4% $IUIT (-0.37%)
Mega caps = 3-5% $MSFT (+3.6%)
$AMZN (+6.74%)
$META (+2.62%)
$GOOGL (+6.34%)
Others = 1-3%
$ASML (-1%)
$NOW (+1.39%)
Gold = 5-7% $4GLD (-1.28%)
Bitcoin = 3-5% $BTC (+0.67%)
I’ve some names in my watchlist in case the opportunity appears: $TSM (-0.21%)
$MU (-7.98%)
$NBIS (-2.65%)
$PNG (+1.19%)
$NU (-1.35%)
$SOFI (-1.1%)
$IREN (-5.68%)
$PLTR (+0.05%)
$MA (+0.34%)
Main goal and top priority is to bring my Core
Position as close as possible to the target allocation and Emergent Markets as well, however I’ll keep an eye on market’s volatility.
Special thanks to @Wealth-Accelerator and everyone else that helps me daily in this amazing platform, replying to my posts or comments.
We finding direction. Year two is about executing with discipline and letting time do the work.
Open to questions and feedback, always learning 🚀
13Positions
€13,920.78
10.22%
1616
7 Comments
Nice to see your personal path and thanks for mentioning 🙏
I want to see 10k in your FTSE All-World till Christmas 😉😅💪🏼
I want to see 10k in your FTSE All-World till Christmas 😉😅💪🏼
•
33
•2Mon·
May 2026 - €1471.69 Investment Update
Personal Portfolio
Stocks
- ServiceNow $NOW (+1.39%) 4 shares purchased — €403.20
ETFs
- Invesco FTSE All World $FWRG (-0.04%) — €288.65
- Global Small Cap Value $AVWS (-0.31%) — €24.31
- VanEck Space Innovators $JEDI (+0.02%) — €120.20
- iShares MSCI Global Semiconductor $SEMI (-0.08%) — €110.86
Bitcoin (Bitvavo) - €100
Subtotal invested: €1047.22
Next Month Target
- 90% of the DCA allocated to $FWRG (-0.04%) + $AVWS (-0.31%)
- 10% of the DCA allocated to $XDEV (-1.1%) to bring it back to the desired portfolio weighting
- 1 $AMZN (+6.74%) share if the price still in my range to buy - €240 Max
Shared Portfolio with My Girlfriend
ETFs
- WisdomTree Quantum Computing $WQTM (+0.72%) — €154.47
- Invesco FTSE All World $FWRG (-0.04%) — €130.00
- Xetra Gold $4GLD (-1.28%) — €20.00
- S&P 500 Information Technology $IUIT (-0.37%) — €45.00
- Avantis Small Cap Value $AVWS (-0.31%) — €25.00
Bitcoin (Coinbase) - €50
Subtotal invested: €424.47
Next Month Target
- 80% of the DCA allocated to $FWRG (-0.04%) + $AVWS (-0.31%)
- 20% of the DCA allocated to $IUIT (-0.37%)
Total invested: €1471.69

1313
9 Comments
I don't really understand the hype surrounding $NOW. There must be a reason why the share is trading about 50% lower than the calculation would say.
I had a look at their website, which is full of buzzwords etc., isn't that just hot air?
I had a look at their website, which is full of buzzwords etc., isn't that just hot air?
•
22
•
10Mon·
CAP update > active 375k passive 0k
This month I poured extra cash into the investment account effectively zeroing out the leverage exposure.
This is an issue I had not considered when I structured my accumulation plan . https://getqu.in/G2SujF/ .
I should probably increase pac purchases when I have extra income and not reduce the level of leverage implemented.... I have a few days before my next purchase and want to think about it. I would appreciate your views on this.
Anyway, today the broker entered orders again balancing the percentages of the ETFs in the plan:
- $IWDA (+0.4%) 31 shares at 106.665
- $XDEV (-1.1%) 11 shares at 47.387
The portfolio plotted by getquin reports a total amount of about 375k recording some deviation from the actual. i am not clear where the deviation comes from, perhaps from the miscalculation of double taxation on some dividends. I will try to solve it shortly.
#etfs
#dividends
#portfolio
#portafoglio
#fire
#retirement
#leverage
#pac
18Positions
€375,696.10
21.86%
11Mon·
Here's my new 8k a month pac.
Today the first orders of my new automatic accumulation plan will be placed in the market. Each month, on the first and fifteenth days, my broker will place orders for 4,000 euros, automatically rebalancing the portfolio holdings of these instruments according to the following weights:
$IWDA (+0.4%) 50% | $XDEV (-1.1%) 37,5% | $IEMA (+1.39%) 12,5%
Why did I choose these ETFs?
◾ Right now my portfolio is 98% composed of distribution instruments. This all-accumulation PAC aims to correct this drift, at least partially.
◾To realign the portfolio to the market with a slight tilt value: I believe that some segments of the market are overvalued and will have lower returns in the coming years. At the same time, however, I believe in passive investing and do not want to deviate too much from the market with excessive tilts. Today this tilt in my portfolio already exists--think Nvidia weighs only 0.5 percent of my total exposure.
How do I finance my €8,000 per month plan?
It is not an inheritance, not a win-win, I do not sell courses or do scams. In the next post I will explain in detail my thoughts and misgivings about it.
33
9 CommentsCongrats. Brave decision to go Value. I think value has underperformed in the last years in the msci world. This isn’t necessarily bad as factors like small or value can always underperform for many years before they come back. That’s the risk in risk factors.
How do you think about adding other factors?
How do you think about adding other factors?
••

1Yr·
Presentation of multifactor portfolio
estimated reading time: 4 minutes
Twenty years ago, the new market crash wiped out my first stock market money and my ego. I swore off the stock market, but my pension certificate showed me that ducking out has an expiry date.
So the first attempts to start again followed. Here on Getquin, I have learned from positive critical voices from e.g. @DonkeyInvestor and @Epi that there is more to it than "just picking something". Since my last post 6 months ago, this was followed by extreme late-night brooding, Excel monsters, AI research, reading Kommer and countless "new agains".
I have tried to read up on modern optimization models such as Mean-Variance, Black-Litterman and Fama-French etc. and implement them in the best possible way.
The result was this portfolio!
As thoroughly tested as you can in a private garage, and coupled with the insight that we only have to leave the uncontrollable to chance.
And one thing first. I am convinced of this and will not change it.
I just want to share my thoughts and ideas about the direction with you. It's difficult to really explain every detail here, I'm sure I could do it better in a conversation, but that's not possible here. I can assure you that the selection and combination definitely makes sense - at least for me and the construct. Among other things, it was important to me to be able to control individual regions separately. I think I have achieved that.
Global (30%)
- SPDR MSCI All Country World, $SPYY (-0.02%)
- L&G Global Equity UCITS ETF, $LGGG (-0.05%)
- iShares Edge MSCI World Momentum, $IS3R (+0.02%)
- Xtrackers MSCI World Value, $XDEV (-1.1%)
- Invesco Global Active ESG Equity, $IQSA (+0.12%)
- VanEck World Equal Weight Screened, $TSWE (-0.59%)
- VanEck Morningstar Developed Markets Dividend Leaders, $TDIV (-0.74%)
USA (31.5%)
- L&G US Equity, $LGUG (+0.29%)
- iShares MSCI USA Mid-Cap Equal Weight, $IUSF (-0.43%)
- JPMorgan BetaBuilders US Small Cap Equity, $BBCS (-0.22%)
- SPDR MSCI USA Small Cap Value Weighted, $ZPRV (-0.76%)
Europe (17.5%)
- HSBC EURO STOXX 50, $H50A (+0.05%)
- L&G Europe ex-UK Quality Dividends Equal Weight, $LDEG (-0.19%)
- SPDR MSCI Europe Small Cap Value Weighted, $ZPRX (-0.5%)
Emerging markets (19%)
- iShares Edge MSCI Emerging Markets Value Factor, $5MVL (+1.08%)
- UBS LFS MSCI Emerging Markets ETF, $EMMUSA (+1.17%)
- L&G Emerging Markets Quality Dividends Equal Weight, $LDME (+0.27%)
- SPDR MSCI Emerging Markets Small Cap, $SPYX (+0.25%)
Japan (2%)
- L&G Japan Equity UCITS ETF, $LGJG (-0.69%)
Ø TER = 0.25%
In summary, this gives the following breakdown
Regional breakdown
- USA (North America) ~ 48%
- Asia ~ 22%
- Europe ~ 22%
- UK ~ 3.6%
- Japan ~ 4.4%
Market capitalization
- Large Cap ~ 52%
- Mid Cap ~ 26%
- Small Cap ~ 22%
The portfolio deliberately allocates its capital to the regions and - where possible - to all capitalization classes. The world building blocks provide the global beta; value, momentum and quality satellites add factor premiums. In the USA, a complete large/mid/small stack provides a pronounced size bias, while Europe receives a value bias via quality and small value ETFs. The emerging layer combines large-cap value stocks, quality leaders and a small-cap module - a diversification anchor beyond the developed markets.
Due to the almost equal weighting of the 18 positions, the Herfindahl index of ETF weights falls to ~633; indirectly, the portfolio contains several thousand individual stocks. The weighted TER is ≈ 0.25 % p. a., spreads below 0.1 %. This means that, compared to a $GERD (-0.31%) a favorable multifactor portfolio myself.
The factor tilts (value 42 %, size 35 %, quality/div ≈ 12 %, momentum ≈ 8 %) increase the expected volatility moderately to 18-20 % p.a.; however, historical data on small and value indices indicate 1-2 percentage points additional return over long horizons. Large caps remain present at around 52 %, mid caps at 26 % and small caps at 22 % support the size premium .
With my "multi-factor all-cap portfolio", I combine global market coverage with five proven premiums, without cost or concentration ballast. Of course, I will have to endure additional fluctuations, but I believe that I have created a robust source of returns over the long term.
I have tried to consider everything and leave nothing to chance, except the uncontrollable.
Anyone who has made it this far. Thanks for reading.
I'm looking forward to your feedback.
PS:
YES, I have Bitcoin😉 and also two themed ETFs. They just stay like that.
- ARK AI & Robotics ETF, $AAKI (+0.06%)
- HanETF Future of Defense ETF, $ASWC (+1.53%)
- ETC GROUP CORE BITCOIN, $BTC1 (-2.71%)
---
no investment advice; DYOR
Thanks also to @VPT , @Mister_ultra , @Ph1l1pp , @ShrimpTheGimp , @MoneyISnotREAL , @Staatsmann and @Smudeo for commenting and providing approaches.
2121
117 Comments
Completely overengineered in my view, but that's how you want it 🤷🏻♂️ You might get a little factor bonus, but that's it. You don't have any effective protection against heavy crashes or years of dry spells, for example. It wouldn't be worth the effort for me.
•
2525
•
1Yr·
Presentation of portfolio logic - feedback welcome!
Hello dear community,
Recently my portfolio and its logic was presented in an article by Business Insider and analyzed by Konrad Kleinfeld from SPDR. There was some exciting feedback, but of course I would also like to activate your swarm intelligence and get your feedback 🙂
First of all: Although I am pursuing a core-satellite strategy, the "satellite" does not aim to outperform, but is simply for fun and offers room for investments that do not fit into the logic of the core. The satellite consists largely of ETFs (e.g. in commodities, real estate, private equity, REITs, etc.), but only accounts for <10% of the overall portfolio and is not included here.
My goal is broad diversification that goes beyond a pure market capitalization-based index as well as long-term returns.
In doing so, I rely on a rule-based approach and diversify along factors based on the selection criteria of the indices. As I deliberately do not want to make any sector or regional bets in the "core", but instead focus purely on the selection criteria of the indices, the relatively significant dividend block serves to reduce the US lump, as high-dividend companies are more frequently found in Europe.
Since the portfolio is quite granular, the portfolio overview function would be very confusing, so I hope it is easy to understand in text form:
1. MSCI World Block (40%):
$SPPW (+0.59%) MSCI World (10%)
$XDEM (-0.22%) MSCI World Momentum (10%)
$XDEQ (-0.37%) MSCI World Quality (10%)
$XDEV (-1.1%) MSCI World Value (5%)
$WSML (-0.24%) MSCI World Small Cap (5%)
Momentum, Quality and Size in the sense of the "normal", market-capitalized MSCI World are weighted slightly higher, as they have historically performed better and should logically perform better in a long-term positive market environment.
2. emerging markets block (20%):
$SPYM (+1.11%) MSCI Emerging Markets (6.67%)
$SPYX (+0.25%) MSCI Emerging Markets Small Cap (6.67%)
$5MVL (+1.08%) MSCI Emerging Markets Value (6.67%)
⚠ There are currently no ETFs on the MSCI EM Quality and MSCI EM Momentum indices that are available in UCITS form and tradable in Europe. Therefore, the logic of the EM block does not yet exactly reflect the structure of the World block. As soon as these ETFs are available, the block will be adjusted accordingly. Consequently, the "normal" MSCI EM as well as the value factor and small caps are currently equally weighted here.
3rd Dividend block (30%):
$VHYL (-0.52%) FTSE All-World High Dividend Yield (5%)
$TDIV (-0.74%) Developed Markets Dividend Leaders (10%)
$ISPA (-0.51%) Global Select Dividend 100 (10%)
$ZPRG (-1.16%) S&P Global Dividend Aristocrats (5%)
As mentioned, this block serves 1) to reduce the US lump, is also distributing and thus provides cash flow, which 2) is used for rebalancing at the end of the year (so I don't have to spend any additional capital on this, which has a psychological effect for me) and 3) the monthly distributions motivate me to continue investing intensively. In addition, 4) the tax-free allowance is utilized without having to actively sell shares in the other "blocks". The top 10 holdings of the individual ETFs differ greatly here despite the common denominator of "high yield". However, the financial sector is a large lump. The weighting here is derived from the high yield and diversification in the sense of complementing the other "blocks" (i.e. little tech and little US).
4. hedge bonds (10%):
$IBCI (-0.15%) Euro Inflation Linked Government Bond (10%)
My equity allocation is (roughly) based on the rule "120 minus age", so 10% is currently left for bonds. The purpose of a bond block in the portfolio is stabilization and further diversification. With shares, I give a company capital, i.e. I become a stakeholder in the company. Corporate bonds have the same logic, because here I am also giving capital to companies. That's why I opted for government bonds in the eurozone. TIPS have performed comparatively well here in the past and the logic of inflation-linked interest rates also appeals to me.
📈 Additional considerations:
1. i deliberately do without the "Low / Min Volatility" factor, as i assume a rising market in the long term and would like to participate more in the positive phases instead of reducing the vola.
2) I don't see overlaps between ETFs as a problem, but rather as a deliberate overweighting of companies that fulfill several criteria at the same time. Of course, many companies currently overlap in the classic MSCI World and the Quality and Momentum variants. However, the selection criteria are different and as soon as a company no longer meets the quality criteria, for example, it automatically drops out of the index and the weighting is reduced without me having to actively do anything about it.
3) I have actively decided not to invest in a multi-factor ETF because I want to have transparent control over the allocation of the individual factors and many of the factor ETFs available combine the selection criteria underlying the individual factors in such a way that the corresponding product would have performed well in the past, which of course represents a hindsight bias and does not necessarily correlate with future performance.
💡 To those of you who have read this far:
First of all, thank you for your time! The portfolio is intended to dynamically reflect a section of the market that could develop positively in a diversified manner based on the different selection criteria of the indices, without taking bets on specific sectors or regions. What do you think of the allocation and the strategy? Do you see any room for improvement or things you would do differently?
Thanks for reading, showing interest and thinking along. 😊
1717
48 Comments
Interesting approaches that make perfect sense the way you have explained them. Personally, it would be too time-consuming for me, but that doesn't mean it's not good.
Do you have a benchmark over several years where you can see the comparison to a "carefree package" dev.world/EM. What is the performance deviation?
What would also be interesting is how the analysis by BI came about and what was their feedback?
Do you have a benchmark over several years where you can see the comparison to a "carefree package" dev.world/EM. What is the performance deviation?
What would also be interesting is how the analysis by BI came about and what was their feedback?
•
22
•Trending Securities
Top creators this week
Real-time data from LSX · Fundamentals & EOD data from FactSet