
$MRL (-3,42 %) has significant exposure to $CRWV (-9,7 %) . If the latter are no longer treated as defaulted/junk bonds, Merlin could also start to recover. @Codeandcapital You’re still invested there—how do you view the REIT from this perspective? And how does our Spanish @investron Merlin look once the transition to a DC REIT is essentially on a more solid footing (see also my last post on this)?

Merlin Prop Soc
Action
Action
ISIN: ES0105025003
Ticker: MRL
ES0105025003
MRL
Price
Discussion sur MRL
Postes
6
2Sem.·
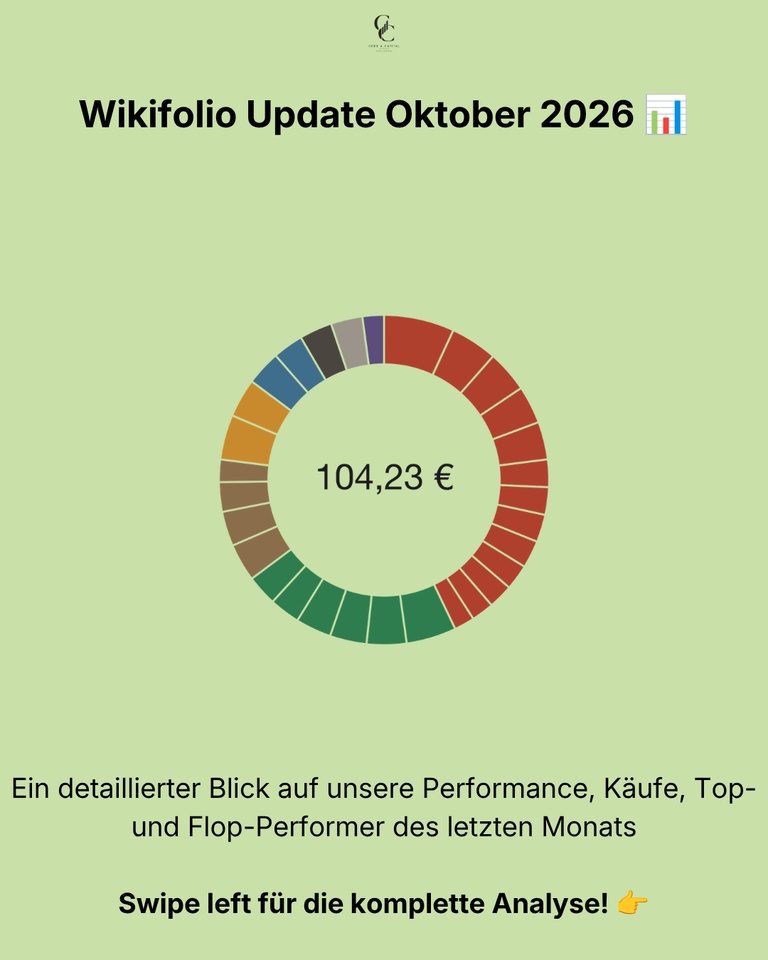
Wikifolio Update October 2026: Tech Stocks Fall, Pharmaceuticals and Oil Rise.
On October 1, the model replaced 18 of its 30 positions. One month later, all six of the month’s top-performing stocks are new additions resulting from that very rebalancing. However, three of the six worst-performing stocks are as well. The Wikifolio ended October down 11.64 percent, its weakest month since its launch in March.
October was not a good month for tech stocks. Concerns about AI spending by the major cloud companies have resurfaced; the SOX semiconductor index lost 15.4 percent over the month, and the Nasdaq fell 5.3 percent. That was its weakest month since March 2025. Quarterly earnings reports came out last week. Seagate and Teradyne beat expectations but still saw their shares fall. On October 30, $INTC (-4,79 %) l issued a weak outlook for the fourth quarter and plummeted 28.6 percent in a single day. SanDisk $SNDK (-16,22 %) , Marvell $MRVL (-10,34 %) and $AMD (-10,69 %) also saw double-digit declines. In the meantime, on October 28, the Fed kept interest rates at 3.75 to 4.00 percent; two members would have preferred to raise them already.
For a portfolio that, after rebalancing, is invested nearly half in semiconductors and memory
, this was the worst possible month:
📊 Monthly performance: −11.64%
📊 Price as of October 30: €104.23
📊 Performance since inception (March 13): +4.2%
📊 Largest loss since inception: −18.6% (previously −14.6%)
📊 Next rebalancing: Early January 2027
Performance & Comparison 🚀
The Nasdaq fell, the broad indices held steady, and the DAX even gained ground. The model clearly lagged behind this time, falling more than twice as far behind as the Nasdaq.
Performance Comparison (September 30–October 30, 2026, end of day, all as euro-denominated ETFs):
Global Quant 6-Factor: −11.64%
NASDAQ 100: −5.27%
FTSE All-World: −0.52%
S&P 500: +0.25%
DAX: +2.43%
The Wikifolio is now 17.5% below its high of €126.30 on June 22.
Buys & Sales 💶
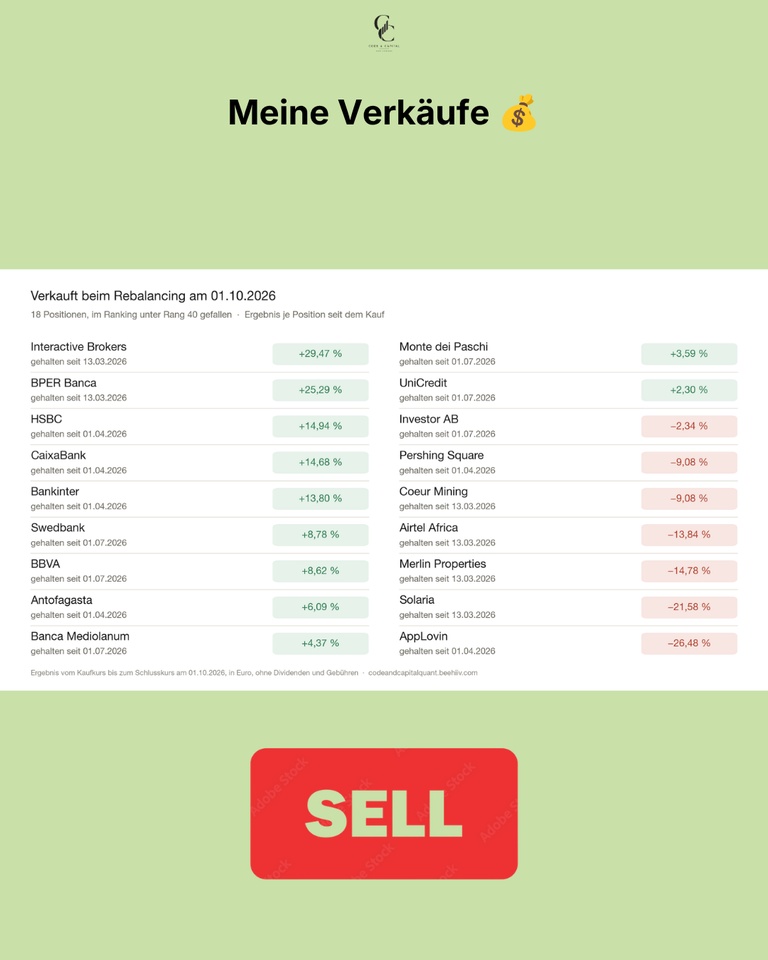
On October 1, the third rebalancing took place—the largest one yet. 18 stocks out, 18 in, 12 remained.
The model sold all nine banks: Bankinter $BKT (-2,71 %) , Swedbank $SWED A (-2,17 %) , UniCredit $UCG (-1,92 %) , CaixaBank $CABK (-2,8 %) , BBVA $BBVA (-1,65 %) , BPER $BPE (-3,94 %) , Monte dei Paschi $BMPS (-1,58 %) , Banca Mediolanum $BMED (-3 %) and HSBC $HSBA (-3,92 %) . Also, Interactive Brokers $IBKR (-4,27 %) , Antofagasta $ANTO (-4,18 %) , Coeur Mining $CDE (-7,14 %) , AppLovin $APP (-6,66 %) , Airtel Africa $AAF (+0,27 %) , Merlin Properties $MRL (-3,42 %) , Solaria $SLR (-3,72 %) , Investor AB $INVE B (-2,44 %) and Pershing Square $PS (-8,71 %) . All were ranked below 40th place. You can see the returns on each position since the purchase on the slides.
It bought six healthcare stocks (Eli Lilly $LLY (+0,14 %) , Bristol-Myers Squibb $BMY (+0,73 %) , Vertex $VRTX (-0,97 %) , Incyte $INCY (-1,09 %) , Illumina $ILMN (-3,91 %) , WuXi AppTec $603259 ) and five semiconductor companies (Seagate $STX (-11,15 %) , Marvell $MRVL (-10,34 %) , Applied Materials $AMAT (-8,15 %) , Teradyne $TER (-6,61 %) , KLA $KLAC (-8,36 %) ). Also included is Fortinet $FTNT (-4,61 %) , CF Industries $CF (-0,21 %) , Marathon Petroleum $MPC (-0,12 %) , APA $APA (+0,15 %) , Pop Mart, the Hong Kong Stock Exchange $HKXCY , and Lion Finance $BGEO (-7,4 %) . Applied Materials and KLA had been sold by the model in July; now they’re back in the portfolio.
After the reshuffle, twelve of the thirty positions were semiconductor and memory stocks, accounting for a combined 44.8% of the portfolio.
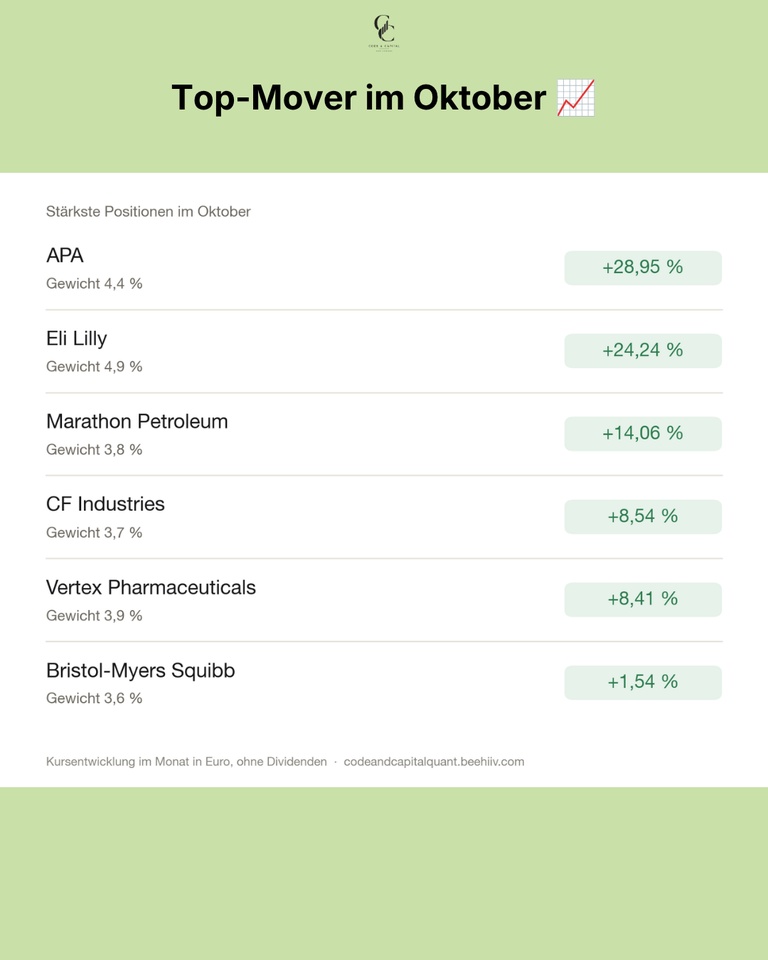
Top Movers in October 🟢
The sectors that gained were those unrelated to AI. APA topped the list with +28.95%. The oil company reported preliminary third-quarter results on October 7 and repurchased 10.5 million of its own shares. Eli Lilly rose +24.24%. Third-quarter revenue rose 39 percent to $24.4 billion, driven by Mounjaro and Zepbound, and Lilly raised its full-year revenue forecast to $91 billion to $92 billion.
Marathon Petroleum gained +14.06%, even though the stock fell 7.4% on October 27 along with other refiners. CF Industries rose by +8.54%, Vertex by +8.41%, and Bristol-Myers Squibb by +1.54%. All six have been in the portfolio since October 1.
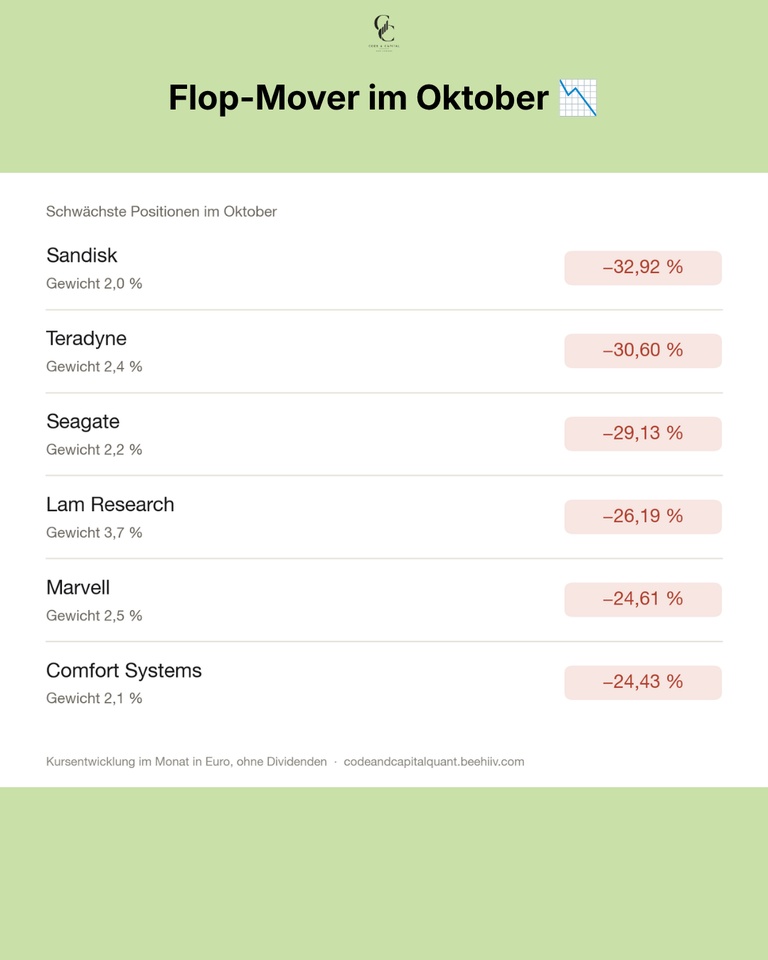
October’s Worst Performers 🔴
This list consists almost entirely of chip stocks. SanDisk saw the biggest loss at −32.92%; on October 30 alone, it fell by 13.5%. Teradyne dropped −30.60%. The earnings report on October 28 beat expectations, as did the outlook, yet the stock still fell. Seagate (−29.13%) saw the same pattern following its earnings report on October 27. Lam Research fell −26.19%, Marvell by −24.61%. Comfort Systems lost −24.43%. It’s not a chip stock, but the company manufactures climate control and electrical systems for data centers and is thus tied to the same sector. On October 23, following the quarterly earnings report—which did not include a 2027 outlook—the stock dropped about 8 percent in a single day.
Teradyne, Seagate, and Marvell were added to the portfolio on October 1. SanDisk, Lam Research, and Comfort Systems $FIX (-4,11 %) were already in the portfolio and were still among the gainers in September.
What’s in the portfolio now 🔍
Stock prices have fallen. The companies’ financial results look different so far. Key metrics for the 30 positions, each showing the median value as of October 31:
P/E ratio: 24.6
Revenue growth: +21.2%
Earnings per share growth: +48.8%
Net margin: 39.0%
Return on equity: 39.4%
Debt-to-equity ratio: 0.2
With a P/E ratio of 24.6, this portfolio isn’t exactly cheap. However, revenue is growing by one-fifth per year, and debt plays virtually no role. The next earnings season will show whether these figures hold up.
Conclusion 💡
October showed what a 44.8% gain means in this sector. When the sector turns, the entire portfolio turns with it. The pharmaceutical and oil stocks added during the rebalancing performed well, but they couldn’t keep up with the chip stocks. A few weeks ago, I calculated a sector limit. At 20 percent, it reduced the maximum drawdown by 2.1 points, but I haven’t implemented it yet. I don’t tinker with the rules in the middle of a drawdown.
What I want to look into is the timing. Rebalancing always takes place just before earnings season, and this time the earnings reports came out right in the first few weeks after the purchase. I’ll run the numbers to see if this is a real disadvantage or if it just happened to look that way this time before I make any changes.
❓ Question for the community
How did October go for you? Did you also have chips in your portfolio, and did you buy more, sell, or just sit it out?
👇 Share your thoughts in the comments!
➡️ Every month, you’ll find the complete Wikifolio update here—even in bad months—along with research from the model.
🗞️ Newsletter: codeandcapitalquant.beehiiv.com
📈 Wikifolio: https://www.wikifolio.com/de/de/w/wf0gquant6
+ 2
66
13 Commentaires
2Sem.
All I bought in October were potato chips. As a result, I gained a few kilos, but my investment portfolio held its ground.
•
33
•1Mo·
Merlin Properties: The Commercial REIT That Isn't Really One?
$MPTYY
$MRL (-3,42 %) is a Spanish REIT, the largest on the Ibex. However, it is one whose traditional business (offices, logistics, shopping centers) is under pressure.
Currently, data centers account for about 10% of rental income; this is expected to rise to 65% by 2032. The situation is quite different at GAV, where data centers already account for 80% of the approximately €13.5 billion.
So far, 160 MW have been leased, including to ($CRWV (-9,7 %) , $META (-4,13 %) and $NBIS (-13,63 %) ).
This is expected to rise to 200 MW by the end of 2026. The pipeline stands at >200 MW. Everything here also depends somewhat on the new regulations in Spain. If they’re implemented as announced, things might get tough.
Does anyone know this REIT or is already invested in it? How do you view it compared to “real” data center REITs like $EQIX (-4,9 %) or $DLR (-6,54 %) ?
Edit: Here are some figures from the last quarter:
- Revenue: Total income reached EUR 307 million, with gross rental income at EUR 292 million, representing a 10% like-for-like increase.
- FFO (Funds From Operations): FFO was EUR180 million, an 8% increase year-over-year.
- FFO Guidance: Full-year 2026 FFO guidance was raised from EUR327 million to EUR340 million, equating to approximately EUR0.55 per share.
- Loan-to-Value (LTV): LTV decreased to 24.5%.
- GAV (Gross Asset Value): GAV increased by 3.7% on a like-for-like basis.
- NTA (Net Tangible Assets): NTA stood at EUR15.99 per share.
- Occupancy: Overall occupancy was 94.7%, with shopping centers at 96.9%, logistics at 95%, and offices at 84.4% in Barcelona.
- Like-for-Like Rental Growth: Overall like-for-like rental growth was 3.3%, with shopping centers leading at 6.4%.
- Tenant Sales (Shopping Centers): Tenant sales increased by 8.4%, and foot traffic grew by nearly 2%.
- Occupancy Cost (Shopping Centers): Occupancy costs remained affordable at 10.8%.
- Data Center Leasing: 160 megawatts of IT capacity was brought online, up from 112 megawatts in the previous quarter.
- Data Center Phase 1 GRI: Estimated gross rental income for Phase 1 is EUR68 million for 2026.
- Data Center Promote: Recognized a promote accrual of EUR101 million for Phase 1, with a payment of nearly EUR20 million in March 2026.
- Capital Recycling: Sold EUR75 million in assets as of July, with an additional EUR90 million in divestments agreed upon.
- Liquidity: Held EUR2.6 billion in liquidity.
An article on regulation: https://www.idealista.pt/en/news/financial-advice-in-portugal/2026/10/06/77877-data-centre-development-will-move-to-portugal
66
2 Commentaires
$MRL
I think there’s more to see under the original Spanish ISIN than under the ADR. Maybe you could add a link to that in the post so it shows up there, too.
Because of my many positive vacation experiences in Andalusia, I just love Spanish stocks. Still, for practical reasons, I don’t have any in my portfolio except for Iberdrola. Thanks for bringing this stock to my attention ;)
It’s a bet on the European data center boom—especially in Spain—and a bet on the ECB’s interest rates trending downward.
I think there’s more to see under the original Spanish ISIN than under the ADR. Maybe you could add a link to that in the post so it shows up there, too.
Because of my many positive vacation experiences in Andalusia, I just love Spanish stocks. Still, for practical reasons, I don’t have any in my portfolio except for Iberdrola. Thanks for bringing this stock to my attention ;)
It’s a bet on the European data center boom—especially in Spain—and a bet on the ECB’s interest rates trending downward.
•
22
•2Mo·
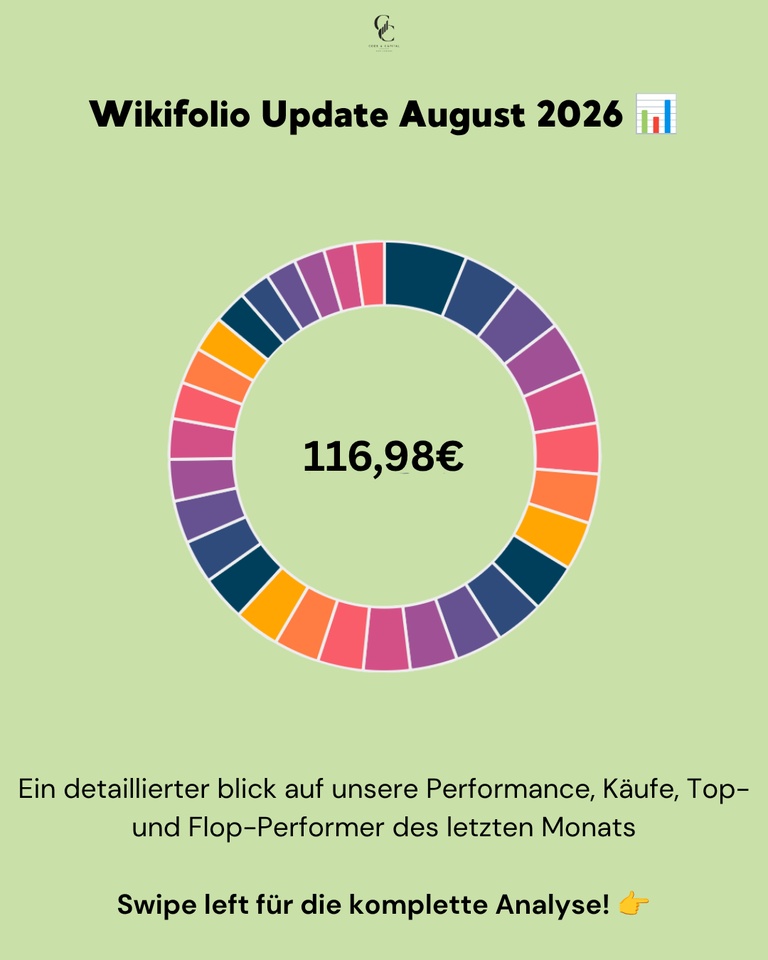
📊 Wikifolio Update August 2026
SanDisk $SNDK (-16,22 %) up 28 percent, Western Digital $WDC (-10,28 %) down 18 percent. Both in the same sector, in the same month. My model didn’t react to either of these movements, yet at the end of the month it was still up 3.03 percent.
August had two sides. At the beginning of the month, mild inflation data was released, and the S&P 500 hit an all-time high of 7,816 points on August 13. After that, sentiment on the bond markets shifted. The 30-year U.S. yield rose to its highest level in nearly twenty years, and U.S. gross debt exceeded forty trillion dollars. At the end of the month, Nvidia reported $NVDA (-11,46 %) quarterly revenue of 96.2 billion, an increase of 106 percent. The next day, Fed Chairman Warsh signaled a pause in Jackson Hole, and the market priced in an interest rate hike in September.
📊 Monthly performance: +3.03%
📊 Max. Performance: 16.1%
📊 Price as of Aug. 31: €116.85
📊 Next Rebalancing: October 1, 2026
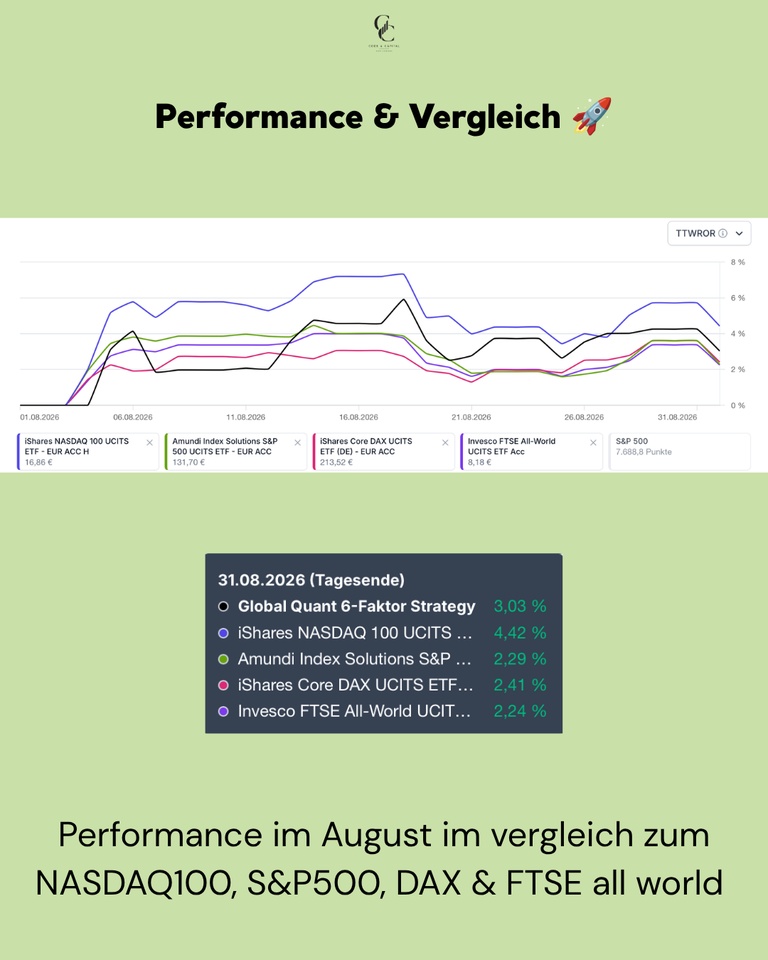
Performance & Comparison 🚀
August was a positive month for all major indices. The Nasdaq led the way, driven by Nvidia. The model performed in the middle of the pack and outperformed the broad indices.
Performance Comparison (August 1–August 31, 2026, end of day):
Global Quant 6-Factor: +3.03%
NASDAQ 100: +3.57%
S&P 500: +2.74%
FTSE All-World: +2.27%
DAX: +2.03%
Purchases & Sales 💶
None. The model trades only quarterly; the last rebalancing took place on July 1. Nothing happens between those dates, even if individual positions diverge significantly. That is precisely the point of the rules. The next rebalancing is scheduled for October 1, when a larger portion of the portfolio will be replaced.
Top Movers in August 🟢
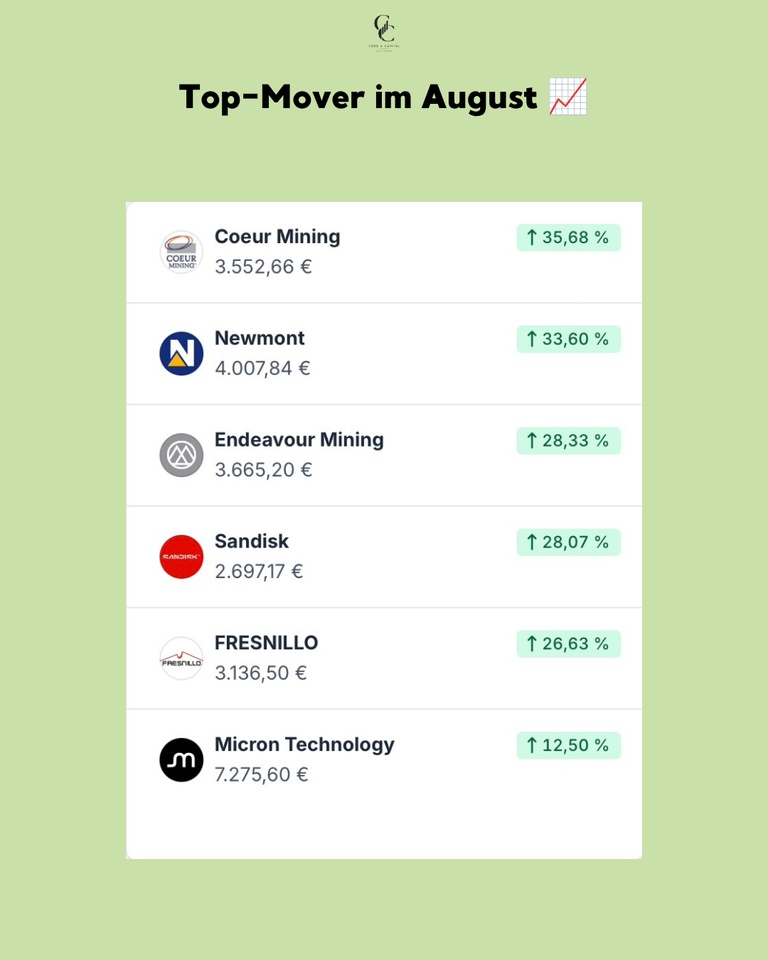
The month belonged to gold mining stocks. Over the course of the month, gold rose at times to nearly $4,700, reaching its highest level since May. By the end of the month, it had given back some of those gains. The move was driven by a weaker dollar combined with ongoing central bank purchases. Mining stocks react to this with leverage because their margins rise disproportionately. Coeur Mining $CDE (-7,14 %) topped the list with +35.68%, followed by Newmont $NEM (-5,58 %) at +33.60% and Endeavour Mining at +28.33%. Fresnillo $FRES (-1,46 %) rose +26.63%. All four have been in the portfolio since the spring. In addition, the storage stocks performed well. SanDisk $SNDK (-16,22 %) rose by +28.07%, and Micron $MU (-11,72 %) by +12.50%.
August’s Biggest Losers 🔴
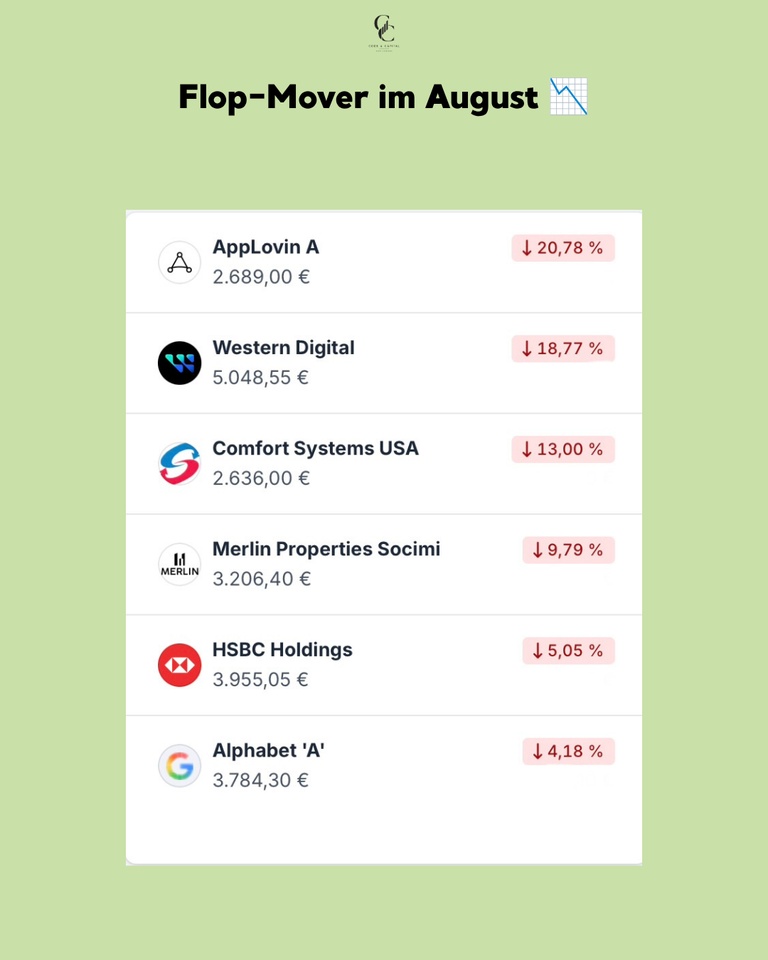
AppLovin $APP (-6,66 %) suffered the biggest loss at -20.78%. Western Digital $WDC (-10,28 %) fell -18.77%, while SanDisk gained nearly thirty percent over the same period. Comfort Systems $FIX (-4,11 %) fell by -13.00%, and Merlin Properties $MRL (-3,42 %)
-9.79%. Among financial stocks, the decline was limited; HSBC $HSBA (-3,92 %) lost -5.05%. Alphabet $GOOG (-1,87 %) fell -4.18%.
Conclusion 💡
August demonstrated the value of a diversified portfolio. While technology stocks diverged and AppLovin fell 20 percent, gold mines carried the month. None of these positions are in the portfolio based on personal opinion; they’re there because the ranking placed them at the top. October 1 will be interesting because a large portion of the commodity stocks are on the sell list.
❓ Question for the Community
Did the volatility in August make you get cold feet, or did you stubbornly hold onto your positions? And how much gold do you currently have in your portfolio?
👇 Let us know in the comments!
➡️ Every month, you’ll find the full Wikifolio update here, along with research from the model in between.
🗞️ Newsletter: codeandcapitalquant.beehiiv.com
📈 Wikifolio: https://www.wikifolio.com/de/de/w/wf0gquant6
+ 1
1010

4Mo·
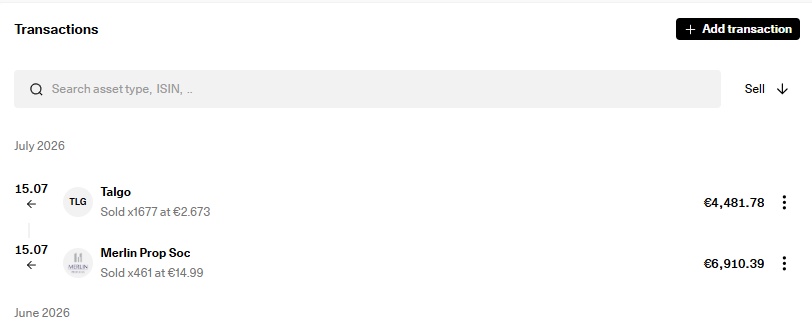
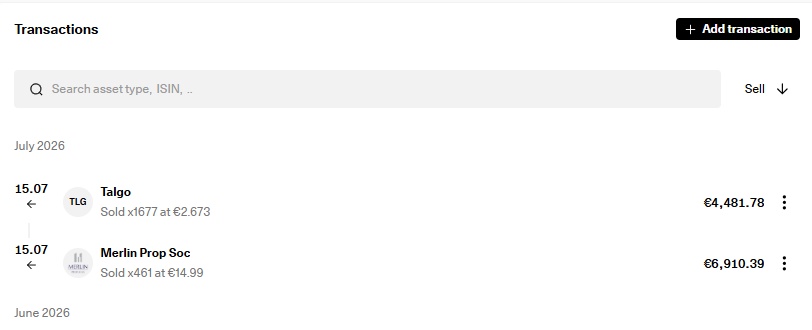
I sold Talgo and Merlin. Here's what I bought.
I’ve held Talgo for 5 years. My position is down 25% including dividends. I bought it because of its potential: high-speed trains, Spanish technology, and solid contracts.
With Merlin, it was a different story: a 30% gain in value and another 30% in dividends over a similar period. A Spanish REIT with quality assets. It seemed like a safe bet.
Both are in the Low Threshold quadrant on DividendQuad. The numbers don’t lie:
🔴 Talgo ($TLGO (-1,03 %)
): Quality 15, Opportunity 10. Negative free cash flow (-€94M). Penalties from Renfe totaling €116M for missed deliveries. Debt-to-equity ratio skyrocketing to 3.27x. The government blocked a takeover by a foreign group. No dividend, no cash.
🔴 Merlin ($MRL (-3,42 %)
): Quality 30, Opportunity 15. Cut the dividend by 93.9% in 2026 to finance its pivot to data centers. Current yield: 2.55%. Negative FFO per share (-€1.07). And the risk that the SOCIMI tax regime will be eliminated adds an extra layer of uncertainty.
This week I sold both and made purchases in the following stocks:
🟢 Vinci ($DG (-0,54 %) ): Quality 80, Opportunity 85. Yield 4.18%. P/FFO 7.8x. Debt/EBITDA 1.48x. Monopoly concessions with inflation-indexed revenues.
🟢 Standard Life ($PHNX (-4,79 %) ): Quality 80, Opportunity 85. Yield 6.14%. The reported losses are purely accounting-related (hedging). Adjusted operating profit grew 15% to £945M. Solvency II surplus of 153%.
🟢 EON ($EOAN (-0,05 %) ): Quality 80, Opportunity 85. Yield 2.96%. P/FFO 7.4x. 75–80% of EBITDA comes from regulated networks. The recent net loss was a one-time accounting charge.
I’m glad that since I created my tool, these decisions have become much easier. It helps me separate the emotional aspect from the decision-making process.
33
2 CommentairesDo you reinvest your dividends automaticly?
••
5Mo·
Spanish SOCIMIs may be suitable for dividend growth strategies
I have Merlin Properties ($MRL (-3,42 %) ) in my portfolio with a 50% profit. My system gives it a LOW THRESHOLD.
Why?
It’s not because of the yield, even though it’s at ~2.9%; that’s not the main issue. The problem is that the quality score is 30/100.
What does the quality score measure? It doesn’t measure whether the company is good or bad. It measures whether it fits the strategy I’ve defined: buying shares in high-quality essential services companies that pay consistently growing dividends
📉 WHY QUALITY = 30/100:
1. Three dividend cuts in 6 years. Although they were strategic (reinvesting in data centers).
2. The payout ratio is broken. By law, a REIT must distribute >90% of its taxable income. Merlin is retaining massive amounts of capital to build data centers. That’s not what I look for in a dividend REIT.
3. P/FFO of 34x. For a REIT, anything over 20x is already expensive. The market is pricing in the future growth of data centers, not the current dividend.
📈 WHAT I DO LIKE ABOUT MERLIN:
- LTV of 28.9% (excellent, among the lowest in Europe)
- FFO growing +5.1% year-over-year
- 5% discount to NAV
- 3GW of data center pipeline, 112MW already pre-leased
- 95.6% occupancy
It’s a great company. But right now, it’s more of a growth-dividend play than a traditional dividend stock, as defined by my system. The system detects this and lowers its quality rating below 50, not because it’s a bad stock, but because it doesn’t fit the strategy.
My conclusion: I’m selling it. If in 2–3 years the data centers generate sufficient FFO and restore the dividend, the quality rating will rise and I’ll take another look at it.

33
Titres populaires
Meilleurs créateurs cette semaine
Données en temps réel par LSX · Données fondamentales et de clôture de FactSet