
$SON (-0,89 %)
$MDT (+0,74 %)
$LDOS (+0,49 %)
$PANW (-0,2 %)
$CDNS (-0,2 %)
$KRYS (+0,79 %)
$HL (+1,01 %)
$TOL (-0,44 %)
$KVUE (+0,17 %)
$DEVON
$ADI (+1,56 %)
$GRMN (-0,69 %)
$SEDG (+1,32 %)
$MCO (+0,12 %)
$FVRR (-1,8 %)
$PODD (+0,49 %)
$CVNA (+7,25 %)
$DASH (+0,39 %)
$FIGX
$EBAY (-0,08 %)
$RELY
$WMT (-0,13 %)
$PWR (+1,87 %)
$DE (+0,07 %)
$LMND (+3,15 %)
$KLAR (+0,25 %)
$W (+0,41 %)
$NICE
$YETI (+0,67 %)
$OPEN (+1,7 %)
$NEM (+0,69 %)
$AKAM (-1,86 %)
$SFM (+2,44 %)
$TXRH (+0,82 %)
$BCPC (+0,42 %)
$BKNG (+0,04 %)

Garmin
Action
Action
ISIN: CH0114405324
Ticker: GRMN
CH0114405324
GRMN
Price
Discussion sur GRMN
Postes
105Mo·
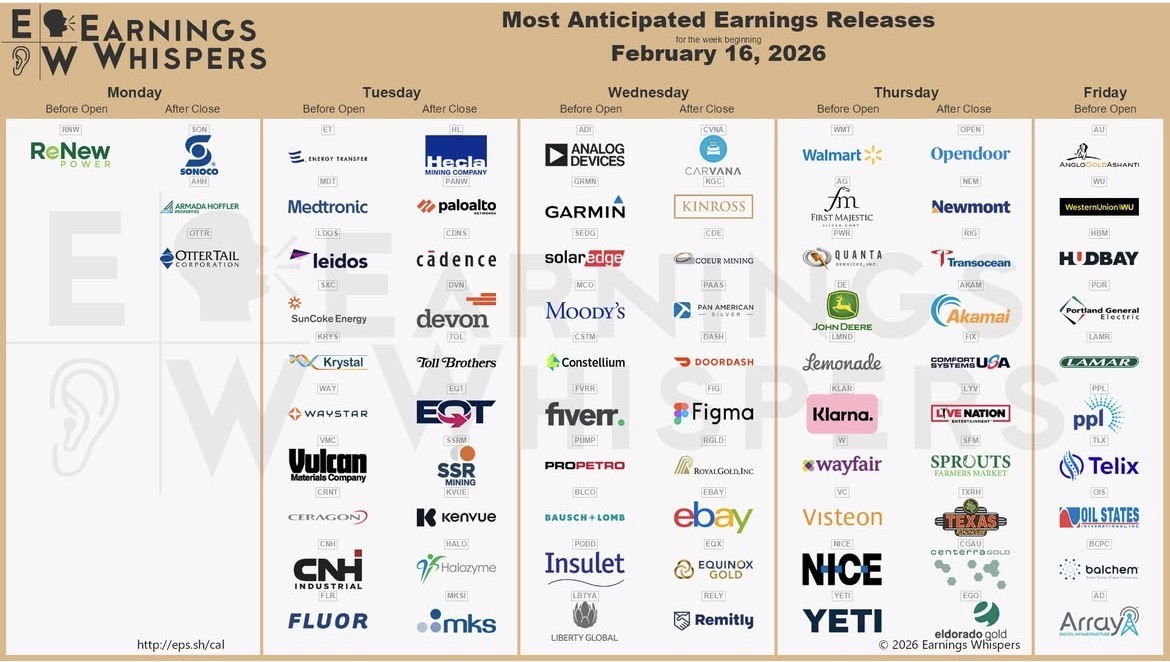
A little quieter next week
88
11 Commentaires
Clemens S.@XClemensx
5Mo
•
55
•Voir toutes les 9 autres réponses

8Mo·
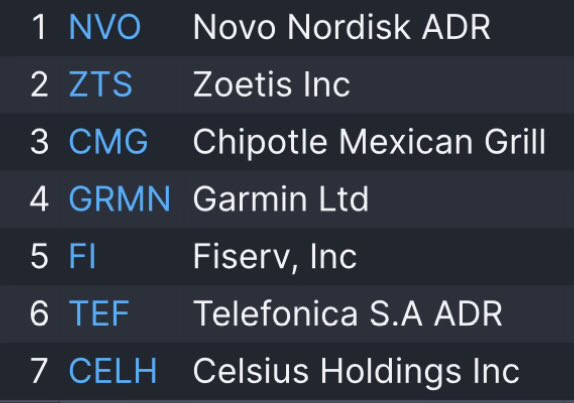
Companies with RSI below 20 🤔
$NOVO B (-0,78 %)
$NVO (-0,64 %)
$ZTS (-0,18 %)
$CMG (+2,79 %)
$GRMN (-0,69 %)
$FI (+0,1 %)
$TLNC34
$CELH
Found an interesting article on x:
There are over 850 stocks with a market capitalization of at least $10 billion.
Of these 850+, only 7 currently have a daily RSI below 20.
Most interesting for me $NOVO B (-0,78 %) and $ZTS (-0,18 %) , $CELH I will probably have to take a closer look again.
Another reason why I increased $NOVO B (-0,78 %) I also topped up again yesterday.
Certainly also interesting from a trading perspective. Which companies on this list are the most interesting for you and why? 🫡
Explanation RSI:
The Relative Strength Index (RSI) is a technical indicator designed to measure the strength or weakness and direction of an asset. It was developed by Welles Wilder in 1978 and has since become one of the most widely used indicators in technical analysis.
The RSI is calculated by comparing the price fluctuations of an underlying asset over time. It is then converted into an index value from 0 to 100. A value above 70 is interpreted as "overbought" and a value below 30 as "oversold".
It is recommended to calculate the RSI with a period of 14 periods. However, some traders also experiment with other time periods. The RSI is an extremely flexible indicator and can be applied to different time periods and assets.
The RSI offers traders two types of signals:
A buy signal and a sell signal. A buy signal is generated when the RSI falls below a certain threshold, usually 30, which is considered oversold and signals that the price is likely to recover in the near future.
A sell signal is generated when the RSI rises above a certain threshold, usually 70, which is considered overbought and signals that the price is likely to correct in the near future.
However, the RSI alone is not sufficient to make informed trading decisions. Rather, it should be used in conjunction with other indicators and analysis methods to gain a more comprehensive understanding of market conditions.
It should also be noted that the RSI, like any other indicator, is prone to error and is not always perfect. For example, if the RSI is stuck in overbought or oversold territory for a long time, this may indicate a trend continuation and not necessarily an impending correction.
Overall, the RSI is a valuable indicator that can help traders assess the trend strength or weakness of an asset and identify potential reversal points.
However, the RSI should be used in conjunction with other indicators and analysis methods to gain a more comprehensive understanding of market conditions. It is also important to be aware of potential sources of error and to interpret RSI signals accordingly in order to make successful investment decisions.
There are numerous other indicators that can help traders determine the strength or weakness of an asset.
Some of the most popular alternatives to the RSI are:
- The Moving Average Convergence Divergence (MACD)This indicator measures the divergence between two moving averages and is often used to identify trends and turning points.
- The Stochastic IndicatorThis indicator measures the relationship between the closing price of an asset and its price range over a certain period of time and makes it easier to identify an overbought or oversold market.
- The Williams %R indicatorSimilar to the RSI, Williams %R measures the ratio of the highest and lowest price of an asset within a given time period. There are differences in the calculation of the RSI and Williams %R, but the results are similar.
- The On-Balance Volume (OBV)This indicator measures the trading volume in relation to the price movements of an asset and is used to identify potential buy or sell signals.
- The Money Flow Index (MFI)This indicator is similar to the RSI, but also includes trading volume in the calculation and helps to identify overbought and oversold market conditions.
Each indicator has its own strengths and weaknesses, and none of them are perfect. It is best to use multiple indicators to gain a more comprehensive understanding of market conditions and compare the results with other analysis methods and charting indicators.
https://de.investing.com/academy/trading/rsi-indikator-erklaerung/
@TomTurboInvest
@Multibagger what's in it for you? 😄
3737
30 Commentaires
I also bought Novo yesterday. I am keeping an eye on Fiserv and Chipotle.
•
1111
•
11Mo·
Garmin Ltd Q2’25 Earnings Highlights
🔹 Revenue: $1.81 B (Est. $1.69 B) 🟢; UP +20% YoY
🔹 Pro Forma EPS: $2.17 (Est. $1.88) 🟢; UP +37% YoY
Guidance (FY’25)
🔹 Pro Forma EPS Guidance: $8.00 (Est. $7.93) 🟢
🔹 Revenue Guidance: $7.10 B (Est. $6.87 B) 🟢
🔹 Gross Margin Guidance: 58.5% (Est. 58.5%) 🟡
Segment / Product Results
🔹 Fitness Net Sales: $605.4 M (Est. $496.2 M) 🟢; UP +41% YoY
🔹 Outdoor Net Sales: $490.4 M (Est. $509.3 M) 🔴; UP +11% YoY
🔹 Aviation Net Sales: $249.4 M (Est. $234.4 M) 🟢; UP +14% YoY
🔹 Marine Net Sales: $299.3 M (Est. $289.2 M) 🟢; UP +9.6% YoY
🔹 Auto Net Sales: $170.2 M; UP +16% YoY
Other Metrics
🔹 Operating Income: $472 M (Est. $402.8 M) 🟢; UP +38% YoY
🔹 Fitness Operating Income: $198 M (Est. $128.4 M) 🟢; UP +83% YoY
🔹 Outdoor Operating Income: $158 M (Est. $173.9 M) 🔴; UP +16% YoY
🔹 Marine Operating Income: $63 M (Est. $61.7 M) 🟢; UP +5% YoY
🔹 Auto Operating Loss: $10 M (Est. Loss $7.32 M) 🔴
🔹 Aviation Operating Profit: $63 M (Est. $53.7 M) 🟢
🔹 Gross Margin: 58.8% (Est. 58.0%) 🟢; UP +150 bps YoY
🔹 Next Dividend: $0.90/share, payable Sep 26, 2025

1Année·
All these stocks hit new 52 WEEK HIGHS at some point today
Visa $V (-0,12 %)
Robinhood $HOOD (+4,21 %)
Delta Airlines $DAL (-0,1 %)
Trade Desk $TTD (+0,64 %)
DoorDash $DASH (+0,39 %)
United Airlines $UAL (+0 %)
Wells Fargo $WFC (+0,02 %)
Booking $BKNG (+0,04 %)
Abbvie $ABBV (-0,58 %)
Agnico Eagle $AEM (+0,93 %)
Alaska Airlines $ALK (+0,68 %)
Apollo $APO (+0,84 %)
Applovin $APP (+1,4 %)
Ares Capital $ARCC (+0,23 %)
Celestica $CLS (+1,23 %)
Coupang $CPNG (+0,32 %)
Corteva $CTVA (-0,03 %)
Carvana $CVNA (+7,25 %)
Duolingo $DUOL
Garmin $GRMN (-0,69 %)
Hilton $HLT
$ICE (+0,11 %)
Incyte $INCY (+0,25 %)
Leidos $LDOS (+0,49 %)
Live Nation $LYV (+0,4 %)
Madison Square Garden $MSGS (+1,15 %)
Nasdaq $NDAQ (-0,3 %)
Sprouts $SFM (+2,44 %)
Nuscale $SMR
Sharkninja $SN
Synchrony $SYF (+0,03 %)
Texas Roadhouse $TXRH (+0,82 %)
VF Corp $VFC (-0,49 %)
WellTower $WELL (+0,33 %)
88

1Année·
Evening getquin community,
What is your opinion about Garmin $GRMN (-0,69 %) ?
I have been in the share business for 2 years and have never noticed the share, but I have noticed their products (bicycle navigation system ♥️). Today I happened to see it in the S&P500 because of the sharp rise in the share price.
The question for you:
What products do you have from the company?
Are you invested?
How do you see Garmin in the future?
Greetings Julian 👋
1111
11 Commentaires
1Année
I bought 10 shares in 2019. I came across them through my interest in sports watches. I currently have my Fenix 6 Pro, which is great for mountaineering, hiking, running and cycling.
Without GPS, the battery lasts ~14 days even after years. I'm happy with that. I have completely switched off smartwatch functions, they only distract me.
I didn't make any good stock valuations back then, so I bought at a bad time (too expensive). In the meantime, however, I'm still up acceptably.
Without GPS, the battery lasts ~14 days even after years. I'm happy with that. I have completely switched off smartwatch functions, they only distract me.
I didn't make any good stock valuations back then, so I bought at a bad time (too expensive). In the meantime, however, I'm still up acceptably.
•
22
•
3Année·
Economy on 23.02.2023...
Many numbers and Indexänderungen⤵️
Yesterday, after-hours, some numbers came in. I will go into more detail in a moment. Most important was each the FED protocol. There was then again clear that further interest rate hikes will come. These are then also announced in the next Fed meeting. On it, the stock market has also reacted slightly. Let's see if the impact continues today. Actually, it was nothing new. Otherwise, the markets start today relatively friendly. Also in the crypto sector, we had only 3 steps forward, then in recent days again 2 steps back and now again 3 steps forward? On the stock market you learn especially that 2+2=4 is not true, but 2-1+2-1+2=4!
On Monday some changes in the Indizies stand to. here times in the overview, which happens:
DAX
RECORD: $CBK (+0,22 %) Commerzbank
EXCEPTION: $LIN Linde
MDAX
UPDATE: $NDX1 (-0,86 %) Nordex
OUTPUT: $CBK (+0,22 %) Commerzbank
SDAX
RECORD: $DBAN (+0 %) Deutsche Beteiligungs AG OUTPUT: $NDX1 (-0,86 %) Nordex
EURO-STOXX-50:
RECORD: $UCG (+0,26 %) Unicredit
OUTPUT: $LIN Linde
STOXX-50
RECORD: $SAF (-0,4 %) Saffron
OUTPUT: $LIN Linde
STOXX-Europe 600
RECORD: $SINCH (-0,91 %) Sinch
OUTPUT: $LIN Linde
Then there were some very interesting figures to report. I'll list the most important ones here:
$NVDA (+1,41 %)
Nvidia:
reported 4th Quarter January 2023 earnings of $0.88 per share. The consensus earnings estimate was $0.81 per share on revenue of $6.0 billion. The Earnings Whisper number was $0.85 per share.
$ETSY (+0,83 %)
Etsy:
Missed analyst estimates of $0.80 in the fourth quarter with earnings per share of $0.77. Revenue of $807.2 million exceeded expectations of $754.31 million.
$EBAY (-0,08 %)
eBay:
Beats fourth-quarter analyst estimates of $1.06 with earnings per share of $1.07. Revenue of $2.5 billion beats expectations of $2.46 billion.
$INTC (+1,22 %)
Intel:
Lowers quarterly dividend to 12.5 cents (previously: 36.5 cents, analyst forecast: 36.5 cents) and reaffirms Q1 guidance.
$GRMN (-0,69 %)
Garmin Ltd:
Surpassed analyst estimates of $1.19 in fourth-quarter earnings per share of $1.35. Revenue of $1.31 billion beat expectations of $1.3 billion.
$OSTK (+1,03 %)
Overstock.com Inc:
Missed analyst estimates of $0.03 in the fourth quarter with earnings per share of -$0.04. Revenue of $404.89 million below expectations of $448.92 million (competes with Home24 and HomeDepot)
$SM (+0 %)
M Energy:
Beat analyst estimates of $1.25 in the fourth quarter with earnings per share of $2.09. Revenue of $671.32 million exceeded expectations of $572.52 million.
$UNITY (+0 %)
Unity Software:
Beat analyst estimates of $0.01 in the fourth quarter with earnings per share of $0.03. Revenue of $451 million beat expectations of $434.7 million (Was always a favorite for me for WEB3)
$TDOC (+5,16 %)
Teladoc Health:
Beat analyst estimates of -$0.25 in the fourth quarter with earnings per share of -$0.23. Revenue of $637.7m exceeded expectations of $633.4m.
$O2D (-0,51 %)
Telefónica Germany:
Posts Q4 revenues of €2.2 billion (PY: €2.06 billion, analyst forecast: €2.1 billion), Ebitda (adjusted) of €667 million (PY: €624 million, forecast: €644 million) and net income of €125 million (PY: €67 million, forecast: €19 million). Proposed dividend for 2022 of €0.18 per share (PY: €0.18). In the outlook for 2023, Telefónica Deutschland expects revenue growth in the low single-digit percentage range, an investment ratio of 14% (PY: 14.7%) and Ebitda growth in the low single-digit percentage range.
Today mostly German/EU numbers are coming but what I'm also interested in is Alibaba!!! These usually come around noon.
Japan stock market holiday
Economic data (abbreviated version)
08:00
- DE: Development of energy prices 2022
11:00
- EU: Consumer prices January Eurozone PROGNOSIS: -0.2% yoy/+8.6% yoy Previous estimate: -0.4% yoy/+8.5% yoy Previous: -0.4% yoy/+9.2% yoy Core rate PROGNOSIS: +5.2% yoy Previous estimate: -0.8% yoy/+5.2% yoy Previous: +0.6% yoy/+5.2% yoy
12:00
- DE: ECB, publication of 2022 balance sheet
14:30
- US: GDP (2nd release) 4Q annualized PROGNOSIS: +2.9% yoy 1st release: +2.9% yoy 3rd quarter: +3.2% yoy GDP deflator PROGNOSIS: +3.5% yoy 1st release: +3.5% yoy 3rd quarter: +4.4% yoy
- US: Initial jobless claims (week) PROGNOSIS: 197,000 previous: 194,000
Quarterly figures / Company dates USA / Asia
22:05 Booking Holdings quarterly results
No time stated: Moderna | Alibaba quarterly figures
Quarterly figures / company dates Europe
07:00 Deutsche Telekom | Gerresheimer
07:00 Heidelbergcement | Knorr-Bremse
07:00 Vitesco | Axa | Essilor-Luxottica | Krones
07:30 Dürr | Hensoldt | Munich Re | Telefonica
07:30 Auto1 | Indus Holding | Bouygues
07:45 Eni SpA Annual Results and Capital Markets Day with Presentation of Strategic Plan 2023-2026
08:00 New Work | Anglo American| Wintershall Dea
08:00 BAE Systems | Rolls-Royce Annual Results
15:00 Hochtief annual results (3 p.m. BI-PK)
18:00 Freenet Annual Results
18:05 Saint-Gobain annual result
No time stated: Valeo | Annual results
#quartalszahlen
#boerse
#börse
#aktien
#news
#newsroom
#community
#communityfeedback
#nachrichten
#täglich
#investieren
#wirtschaft
#politik
#inflation
#fed
#rezession
#mitverstandzumkapital
#krypto
#kryptowährung
#kryptos
#cryptos
#nvidia
#etsy
#ebay
#münchnerrück
#deutschetelekom
#alibaba
#bookingcom
#bookingholdings
#intel
#garmin
#unity

2323
2 Commentaires
3Année
Your reports are just mega!!! Thanks for this 👌🏾👍🏾
•
22
•
3Année·
Sector bet - Quo vadis?
or
Help, a sector ETF on getquin
Between the years is a very good time to think about your investment strategy. Surrounded by family, you can take a breather while the kid is still busy with way too many Christmas presents and you don't actually know what day of the week it is.
In the last post I already mentioned that the market situation has awakened in me the attraction to invest in individual stocks.
As this changes the structure and distribution in my portfolio, I've also been questioning my previous purchases, most notably the one mentioned above $2B76 (+0,88 %).
A year ago, it was started to be parsed, as an individual note in a world portfolio that was too boring until then. As I said, I did not want and could not deal with individual stocks at that time.
At that time, this ETF contained values such as $NVDA (+1,41 %)
$AMD (+1,93 %)
$GRMN (-0,69 %) and even $AAPL (+0,02 %) were represented and appeared among the Top10 positions.
If you look at the Top10 positions today, they are no longer the ones mentioned, which are still included, but which you have to look for more closely. So something has changed in the included positions and their weighting.
The fact that I am $2B76 (+0,88 %) in my portfolio with 15% in the minus, does not even bother. So it's not about selling due to panic at double-digit price losses, but to question one's own strategy and the fit of the existing values to it.
But what does the ETF actually do?
Automation & Robotics currently invests in 159 companies that develop technologies in the field of automation and robotics in industrialized and emerging countries. The automation of processes in industry, in the manufacture, storage and distribution of products, the use of robotics to supplement or replace humans in the above-mentioned areas is where I am active myself through my job and where I want to invest.
Launched in 2016 and since then it has delivered the following perfomances:
2017: +46,8%
2018: -18,3%
2019: +37,8%
2020: +38,8%
2021: +21,0%
2022: -30,27%
So performance is swinging out quite a bit, both up and down. An indication that if it went down strongly, it can also go up strongly again?
Sector bets are not really popular on getquin. So now settle the question: What to do with this thing?
What are the possibilities?
- Dissolve sector bet and split it into world and single stocks
- Leave the sector bet and do not continue to manage it
- Continue sector bet
Is my investment case still intact?
While writing the lines about what the ETF actually does, there it was again, this tingling for the topic of automation. I just think it's awesome when companies develop technological solutions that make work easier and or take it away, thereby increasing productivity.
Have you ever been in a sparkling clean warehouse, where the machines and robots just shine and are reflected in the floor? Or things like pressing a button in my home office and seeing a pallet on a conveyor system on the other side of the world? Hach ... I love that.
I'm still burning for the topic and therefore want to remain invested in the sector.
What about the companies in the ETF?
Since I admittedly can't really do much with the current Top10 positions from the ETF, I also sat down again and looked at the companies. Here is a small excerpt from the Top5:
Lattice Semiconductor Corp (USA, 1.56%)
Manufactures programmable semiconductor products for AI, infrastructure 5G and factory automation.
Intuitive Surgical Inc (USA, 1.55%)
Develops and markets robotic video systems for surgery.
Lasertec Corp (JAP, 1.52%)
Develops and sells inspection and measurement equipment.
Coupa Software Inc (USA, 1.50%)
Provides cloud-based software to connect customers with suppliers and optimize supply chains.
Rockwell Automation Inc (USA, 1.49%)
Specializes in automation and control systems for the food, automotive and energy industries.
-> No companies that I would have thought of investing in individually at this point.
A few more familiar faces are also still represented in the ETF. These include, for example.
- Nvidia (0.97%)
- AMD (0.79%)
- Garmin (1.10%)
- Keyence (1.23%)
- SAP (1.30%)
- Snowflake (1.29%)
- Intel (0.79%)
If you look at the weightings of the individual companies, you will notice that they are fairly evenly weighted. A plus point of the ETF in my opinion.
I want to stay invested in the sector. Now the question, whether it remains the ETF or should be switched to individual stocks?
After the research of the companies I have to say that I could not determine the one or the two companies from which I expect the most in the future in the field of automation. Sure, I could put chipmakers or semiconductor stocks in my portfolio to cover even broader areas than just automation, but that would lose me my investment case. And who doesn't believe that we will be operated by remote-controlled robots in the future? 😉
What is the solution now?
By re-examining the ETF and the companies in it, ultimately nothing will change in the positions in my portfolio. The sector bet will continue and after one or two suspensions in favor of individual stocks, will be started again in the new year.
What I will pay attention to is the weighting in the portfolio. By adding the individual stocks, the share of the World+EM dwindles, which I do not want to let fall below 70%.
So even though sector bets are relatively unpopular, at least here on getquin, in some cases they also fulfill an investment case better than single stocks and can therefore work very well as an admixture.
Nevertheless, unlike with a world ETF, you should ask yourself more often whether the stock selection still suits you. Over time, not only the weightings of the positions in such ETFs change, but also personal preferences, risk tolerance and one's own strategy.
In this sense, I wish all who have made it this far a Happy New Year and a positive return year 2023! Let the corks pop 🍾
1515
24 Commentaires
Nice reflection 🙂 . You can't identify the 1, 2 companies that will go through the roof? Why not? Because the profile and delineation is possibly too fuzzy? An indicator for me that there will still be a nice selection in the area and that will give the ETF properly. I therefore stick to it: fingers away from too narrowly set sector bets.
•
55
•
4Année·
𝗠𝗮𝗿𝗸𝗲𝘁 𝗡𝗲𝘄𝘀 🗞️
𝗘𝘃𝗲𝗿𝗴𝗿𝗮𝗻𝗱𝗲 𝗸𝘂𝗿𝘇 𝘃𝗼𝗿 𝗱𝗲𝗺 𝗕𝗮𝗻𝗸𝗿𝗼𝘁𝘁 / 𝗗𝘂𝘁𝗰𝗵 𝗕𝗿𝗼𝘀 𝗽𝗹𝗮𝗻𝘁 𝗜𝗣𝗢 / 𝗠𝗶𝗰𝗿𝗼𝗦𝘁𝗿𝗮𝘁𝗲𝗴𝘆 𝗸𝗮𝘂𝗳𝘁 𝗲𝗿𝗻𝗲𝘂𝘁 𝗕𝗶𝘁𝗰𝗼𝗶𝗻
𝗘𝘅-𝗗𝗮𝘁𝗲𝘀 📅
As of today, Coca Cola ($CCC3 (-0,03 %)), Comerica ($CA3), Domino's Pizza ($EZV (+0,64 %)), Garmin ($GEY (-0,69 %)), Gilead ($GIS (-0,93 %)), Merck & Co. ($6MK (-0,6 %)) and Leidos ($S6IA (+0,49 %)) traded ex-dividend.
𝗤𝘂𝗮𝗿𝘁𝗮𝗹𝘀𝘇𝗮𝗵𝗹𝗲𝗻 📈
Today, Crealogix ($CX1), JD Sports Fashion ($9JD2), AstroNova ($ALOT (+0 %)) and Sanne Group ($SNN) will present their quarterly results.
𝗜𝗣𝗢𝘀 🔔
Dutch Bros - The largest drive-through coffee chain in the United States has selected tomorrow (9/15-21) as the date for its initial public offering on the New York Stock Exchange. The company expects to raise approximately $484 million. Of this, 200 million is to be used to cover debt. The remaining capital is to be used for share repurchases and corporate growth. In addition, the company announced that it will donate 1% of the capital raised through the IPO to a charitable organization over the next 10 years.
𝗠𝗮𝗿𝗸𝗲𝘁𝘀 🏛️
Evergrande ($EV1A) - The second largest, Chinese real estate and construction group again warns of liquidity shortages. This is due to a sharp decline in the company's property sales. Attempts to sell some of the company's assets to generate new capital have also failed to bring much progress. Evergrande has taken on more than 260 billion euros in debt after years of aggressive expansion. At the current time, the group employs about 163,000 people. After the announcement of the impending liquidity shortage, numerous people (homebuyers, artisans & small investors) gathered in front of the group's headquarters in Shenzhen to demand their money back.
𝗖𝗿𝘆𝗽𝘁𝗼 💎
MicroStrategy ($MIGA (+2,92 %)) - The U.S.-based software company, whose founder and CEO is bitcoin maximalist Michael Saylor, took advantage of declines in the bitcoin exchange rate and bought 5,050 bitcoin ($BTC-EUR (+1,08 %)) worth $242.9 million at an average bitcoin price of $48,099 per bitcoin. In total, MicroStrategy now holds 114,042 bitcoin. This currently equates to a total value of US$5.131 billion. Thus, the company holds approximately 0.5% of the world's existing Bitcoin. MicroStrategy bought its Bitcoin at an average price of 27,712 US dollars per Bitcoin. As a result, the company generated a notional profit of about $2 billion. However, the company has never sold a single Bitcoin.
77
6 Commentaires4Année
mirgen also the IPO of On in new york. the fastest growing sporting goods company in the world.
•
11
•

Titres populaires
Meilleurs créateurs cette semaine
Données en temps réel par LSX · Données financières de FactSet