
Xtrackers has $AWEX (-0.38%) has just been launched. Certainly very interesting for some for whom $EXUS (+0.2%) is not enough. 😬
- Markets
- ETFs
- Xtrackers MSCI World ex USA ETF
- Forum Discussion

Xtrackers MSCI World ex USA ETF
ETP
ETP
ISIN: IE0006WW1TQ4
Ticker: EXUS
IE0006WW1TQ4
EXUS
Price
Discussion about EXUS
Posts
25

4Mon·
MATT monthly review February 2026
The first month for MATT is already behind us. And a good one at that.
On February 13, we switched to the final universe. Since then there have been no signs of reallocation. The assets currently selected have a large momentum gap. With commodities, energy, gold and emerging markets, the portfolio is positioned "anti-crisis" and avoids industrialized countries completely. MATT has therefore adapted to the geopolitical situation.
As expected, the momentum strategy is delivering slightly lower returns than 3xGTAA with fewer negative swings. The world index was clearly beaten.
MATT strategy: https://getqu.in/1zBXjL/
Wikifolio (investable from approx. mid-April): https://www.wikifolio.com/de/de/w/wf000matt0
Asset performance (in portfolio):
EM 3x | +15.7%
Gold 2x | +8.9%
Ex USA | +3.3%
Energy | +2.6%
Commodities | -0.6%
Gold 3x | -3.2%
Wikifolio certificate (total):
+8.72%
Comparative performance (Max DD per month):
🥇3xGTAA: +12.2% (-5.8%) (https://getqu.in/Zm0Z01/)
🥈MATT: +8.7% (-4.4%)
🥉Gold: +6.3% (-4.7%)
MSCI World: +1.1% (-0.7%)
Trading days:
13.02.
+ Gold 2x $LBUL (+1.09%)
+ Energy $IXC (+0.2%)
- World ex USA $EXUS (+0.2%)
- Gold 3x $3LGO (+1.43%)
27.02.
no changes
Allocation at the end of the month:
25% 2x gold $LBUL (+1.09%)
25% energy $IXC (+0.2%)
25% raw materials $XDBC (+0.02%)
20% 3x EM $3EML (-1.68%)
5% cash

app.getquin.comBacktest einer risikoärmeren 3xGTAA Variante MATT
1717
14 Comments
4Mon
Exciting alternative to 3xGTAA and good performance so far! 👍
But one swallow doesn't make a summer. We'll see how it compares after a year.
But one swallow doesn't make a summer. We'll see how it compares after a year.
•
55
•5Mon·
Backtest of a lower-risk 3xGTAA variant (MATT)
I always like to test promising systematic strategies. On Getquin and especially from @Epi there are a lot of them. Most recently, GTAA and especially the 3x variant with the certificate received a lot of attention (https://getqu.in/2Ya4VP/). As I would like to expand my momentum strategies, I have now also taken a look at GTAA.
1) Starting point
First of all, I wanted to replicate the GTAA strategy of @Epi to replicate it. Mainly because I am interested in daily data and Epi only looked at monthly data in the backtest.
For this I used the following universe (from Epi's GTAA Max):
3xQQQ, BTC, PRIDX, VUSTX
Period from 01.01.2016
How @Epi I use 200SMA and Dual Momentum as a signal and trade once a month:
I get a strong 42% CAGR, 30% Vola, -50% Max Drawdown and end up pretty much with Epi's numbers. It should be noted that my drawdown is calculated daily and not monthly as with Epi.
Now I have categorized the numbers a bit:
- BTC from 2016 is of course subject to survivorship bias. Nobody would have allocated 33% of the portfolio to BTC in 2016.
- I looked at the performance distribution and realized that 60% of the performance was generated by BTC and 37% by TQQQ. So together they generated 97% of the performance and it doesn't matter which assets are still in the universe. I modified the universe and added bonds, for example. The result was the same.
- The weakest day was -25% on 12.03.2020, which is pretty heavy
- If you extend the strategy to the period from 2007 (BTC is added from 2016), you only get 28% with 24% vola and -50% MaxDD
- If you now only use BTC from 2018 onwards, you get 20% CAGR, 23% vola, -50% MaxDD. So not so great anymore. Whereby 64% of the performance is attributable to TQQQ. You might as well invest directly in the QQQQ.
Please have a look at the backtest of @Jesko (https://getqu.in/0ydHY0/). We have also seen drawdowns of -60% and more. @Jesko has rebuilt 3xGTAA better than me (I only used GTAA MAX and did a rather inaccurate test).
2) Target
I would like to add GTAA to my portfolio. But the presented variants of Epi are either too defensive (10-15%CAGR) or too risky (-50% daily drawdown) for me. Epi's 3xGTAA will probably also experience drawdowns of this magnitude. In April it was already 37% (again the reference to @Jesko ).
Therefore, I would like to optimize my GTAA variant for special parameters, which should achieve the following:
- highest possible CAGR
- maximum drawdown as low as possible (small drawdowns are not bad, larger drawdowns should be significant)
- the shortest possible periods of sideways movement. It is a big risk if you think that the strategy is not working because it has been going sideways for years while all indices are at record highs and you therefore abandon the strategy. Epi also mentioned this point. I am happy to accept a few percent long-term performance in return.
I also want to achieve the best possible performance distribution. This allows me to achieve better diversification. If the performance drivers are not so strong, then hopefully there are enough other assets that can at least partially fill the gap.
To do this, it was first necessary to determine the universe. In doing so, I only considered assets that have delivered performance and/or reduced risk.
3) The universe
The following assets are included in my universe:
3xSPY (US equities) $3USL (-0.86%)
3xEEM (developing country equities) $3EML (-1.68%)
EXUS (industrialized countries without US equities) $EXUS (+0.2%)
2xWSML (world small cap equities) $null (+1.58%)
IXC (Utilities) $IXC (+0.2%)
3xTLT (long US bonds) Cash + $TLT5 (+3.22%)
3xIEF (medium US bonds) $3TYL (+0.78%)
XBCU (commodities) $XBCU (-0.64%)
2xGOLD (gold) $LBUL (+1.09%)
BTC (Bitcoin) $BTC (-0%)
This achieves the first goal: diversification in the universe.
All regions are covered and, with the small cap ETF, almost the entire investable market. In addition, there are cyclical components such as commodities or utilities, which are highly correlated, but in my tests have synergies that reduce the risk. In addition, gold and BTC + US bonds, as they have provided the best and safest long-term returns.
I would also like to mention that the STOXX50 or oil performed very poorly in my tests and are therefore not in the universe.
In addition, ETFs exist almost everywhere except for the leveraged small caps. There is only one factor certificate that leverages in EUR, i.e. contains the exchange rate twice. My tests reflect this situation. The strategy also works with the unleveraged $WSML (+0.13%) . This leads to 1-2% CAGR less.
4) Parameters to be optimized
Maximize CAGR - 1.1^MaxDD and Minimize 10%MTU. (Explanation follows)
The most important parameter for me is CAGR - 1.1^MaxDD. In other words, the average growth rate minus the drawdown. The drawdown is weighted with an exponential function so that small drawdowns have little influence.
With 20% CAGR and 20% DD, we can accept +1.5% DD for +1% CAGR. At 20% CAGR and 30% DD, only +0.5% DD is acceptable for +1% CAGR. The higher the drawdown, the more excess return we have to achieve in order to accept an even higher drawdown.
The second parameter is 10%MTU. This describes the following situation:
At each point in time, the share price 3, 5 and 7 years ago is considered. The current price is forecast using the CAGR of the entire strategy. The 3 differences between the actual price and the forecast are then added together. The result is the Medium-Term Underperformance (MTU) of this point in time. Example:
The portfolio is at €100 at time x. Three years ago it was at €100, five years ago at €80 and seven years ago at €60. The CAGR of the strategy is 10%.
Now the current value is forecast based on the past:
3 years ago: 100€ with 10% CAGR in 3 years results in 100€*1.1^3 = 133€
5 years ago: 80€ -> results in 129€
7 years ago: 60€ -> results in 117€
But the current price is only €100. The MTU is now the sum of the percentage deviations:
(100-133€)/133€ +(100€-129€)/129€ + (100€-117€)/117€
= -24.8% - 22.5% - 14.5% = -61.8% MTU at time x.
The MTU is therefore a measure of performance over the medium term (3-7 years) and whether the total return was exceeded or underperformed during this period.
10%MTU is obtained by sorting all MTU values and taking the largest value of the lowest decile (10% quantile).
A higher 10%MTU value indicates that the weakest 10% of all mean time periods have performed better than a lower 10%MTU value.
This means that the higher the 10%MTU, the fewer sideways phases there are.
5) Parameters on Epis GTAA Max
(since 2007, with BTC only from 2018)
GTAA MAX:
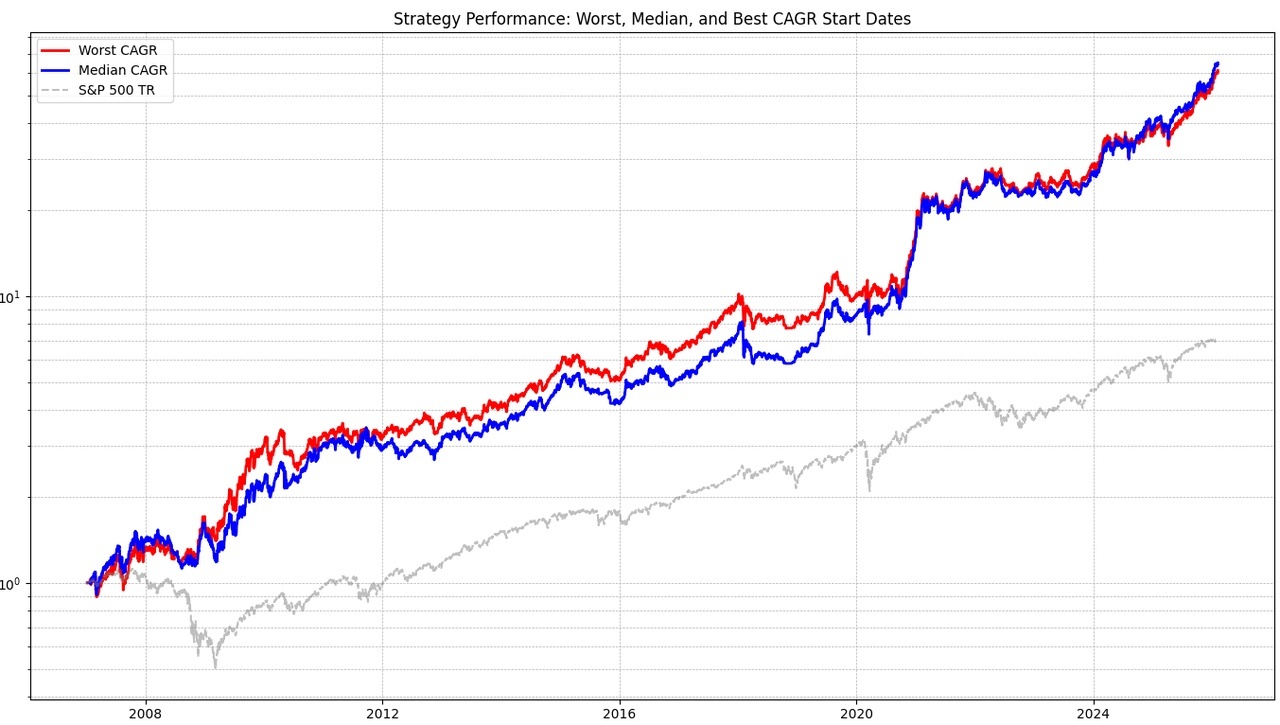
I will always show 3 graphs. The gray one is the benchmark (S&P 500 TR). I have abstracted Epi's strategy again to get a better comparison to my strategy. It is not traded at the beginning or end of the month, but a simulation for every possible trading day (e.g. the 1st, 15th, 20th, etc.) in the month. The median is shown in blue and the worst case in red. All the above metrics always refer to the worst case in order to calculate as conservatively as possible.
You can already see very few sideways phases, the 10% MTU value is therefore very strong (for the vola) at -35%. Here all metrics (in brackets the benchmark S&P 500 TR):
CAGR 17.36% (10.74%)
Volatility 23.58% (19.5%)
Sharpe Ratio 0.81 (0.6)
Max Drawdown -49.37% (-55.25%)
Worst Day -24.57% (-11.98%)
10%MTU -35.35% (-21.2%)
CAGR - 1.1^MaxDD -91.2 (-180)
The metrics look quite good, but the value for CAGR - 1.1^MaxDD is very low and the worst day is also very weak at 25%. In addition, my diversification target was not met: TQQQ is responsible for 70% of all gains.
6) First tests
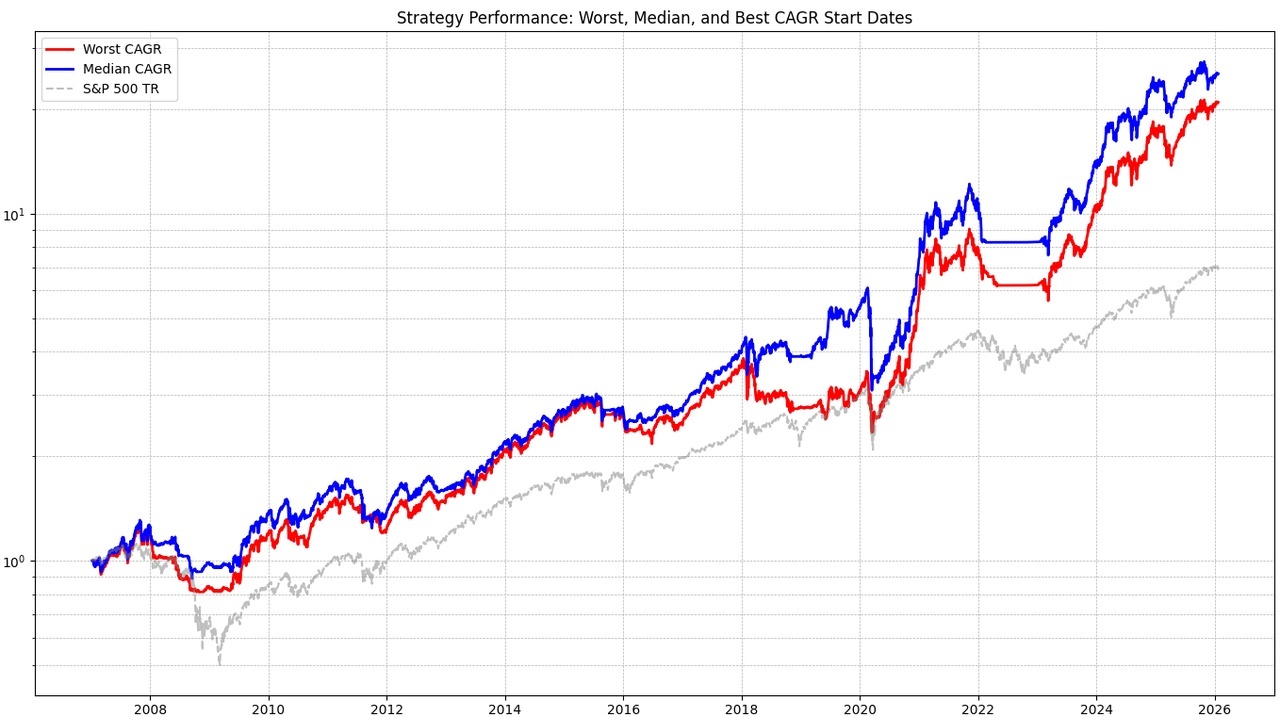
First, I tested my universe with the same parameters as Epi.
This looks very similar to GTAA MAX with lower yield and MTU:
CAGR 15.48% (10.74%)
Volatility 25.04% (19.5%)
Sharpe Ratio 0.68 (0.6)
Max Drawdown -51.32% (-55.25%)
Worst Day -22.77% (-11.98%)
10%MTU -45.68% (-21.2%)
CAGR - 1.1^MaxDD -118 (-180)
However, the diversification target has been met. The strongest asset (gold) only accounts for just under 28% of all gains.
7) Optimizations
The result is okay. However, there are still some adjustments to be made. First of all, I checked whether it makes more sense to react to signals less frequently or more often. In times of crisis, you can be invested in a high-risk product for up to a month, even though the momentum has long since reversed. I ran a simulation for this purpose:
As you can clearly see, shorter periods are better. From 3 weeks, the maximum drawdown is considerably lower. But I don't want to trade weekly either, as that would be too much effort. So I will check the signals every 14 days and then trade.
Here you also have to be careful not to fall into a fallacy. The data shown is again the worst case. As higher weekly figures look at more cases, the probability that one of them is bad is also higher. However, the median looks similar, with the exception of 1-2 weeks. These have very similar values and support the thesis that 14 days between trades is sufficient.
Then I remembered that I use the SPY and actually wanted to diversify the Spytips strategy. So why not use the TIPS indicator for the SPY?
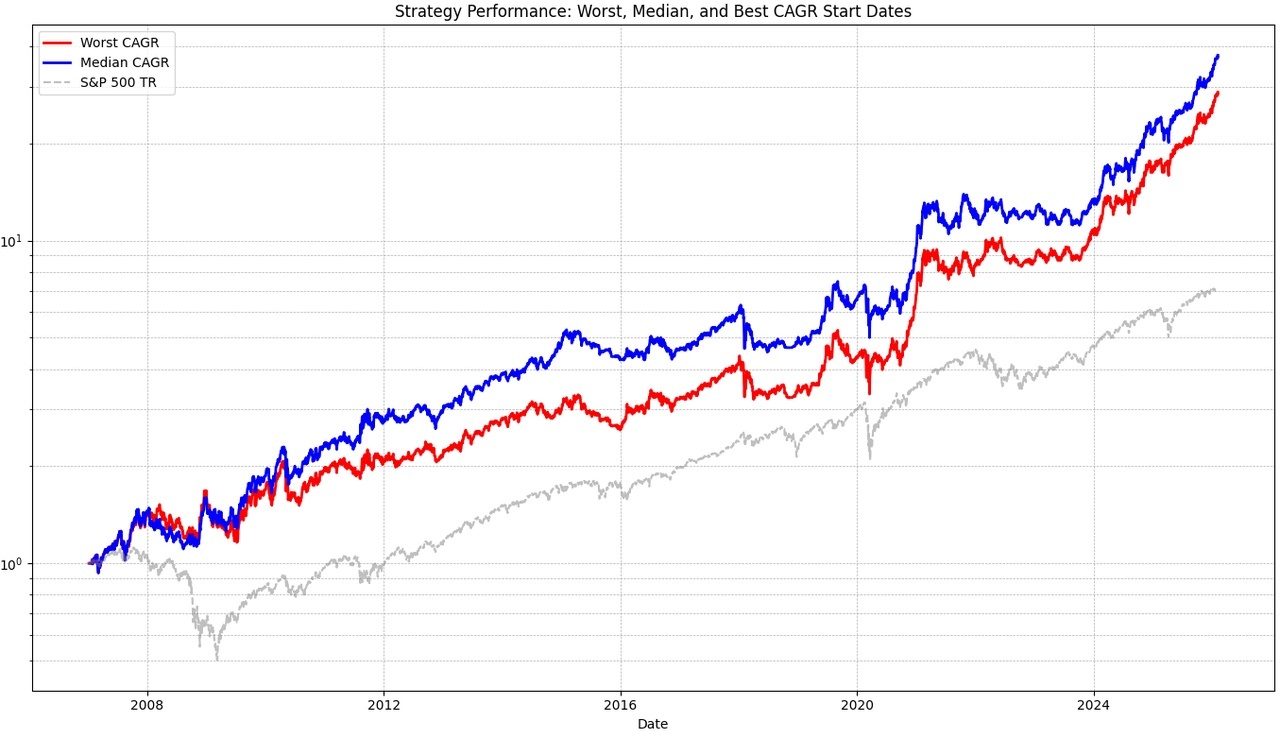
So the new rule is:
3xSPY is only considered when TIPS is above its own SMA.
CAGR 19.24% (10.74%)
Volatility 23.30% (19.5%)
Sharpe Ratio 0.86 (0.6)
Max Drawdown -36.59% (-55.25%)
Worst Day -12.59% (-11.98%)
10%MTU -43.39% (-21.2%)
CAGR - 1.1^MaxDD -13.5 (-180)
More return with less vola and lower drawdown. The weakest day is also much better. The 10%MTU is also better.
Next, I would like to hold a maximum of 4 (instead of 3) assets at the same time to further reduce the risk profile.
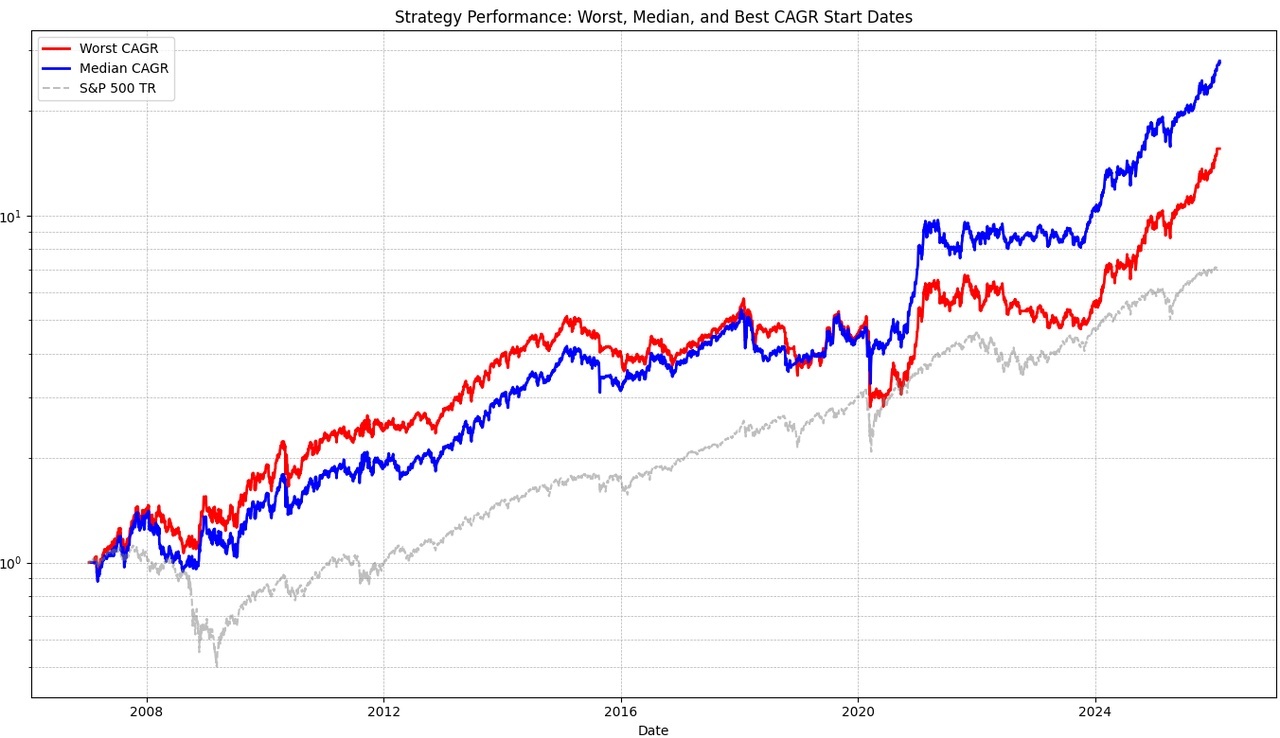
I do this a little differently than EPI: If there are no 4 assets to hold, only 1,2 or 3 will be held with 100, 50-50 or 33-33-33 weighting respectively. Maximum weightings per asset have been set so that the weighting is not too high:
e.g. 3xTLT, 3xIEF, BTC, IXC, Commodities may only account for a maximum of 30% each and 3xEEM only 20% (effectively reducing the leverage from 3x to 2-2.4. Unfortunately, there is no 2x EM). The rest is filled with cash. This means that in market phases in which few assets are running, these can be weighted higher (30-40%):
CAGR 19.20% (10.74%)
Volatility 24.42% (19.5%)
Sharpe Ratio 0.82 (0.6)
Max Drawdown -29.04% (-55.25%)
Worst Day -12.06% (-11.98%)
10%MTU -44.70% (-21.2%)
CAGR - 1.1^MaxDD 3.3 (-180)
Drawdown is significantly better, but performance remains the same. Here you can also see that the median case performed even better than the last test (blue graph)
Finally, I optimized the SMA values. It should be mentioned that this test is overfitted and should only give an insight into what is possible.
CAGR 24.04% (10.74%)
Volatility 24.33% (19.5%)
Sharpe Ratio 0.98 (0.6)
Max Drawdown -28.79% (-55.25%)
Worst Day -12.06% (-11.98%)
10%MTU -38.81% (-21.2%)
CAGR - 1.1^MaxDD 8.5 (-180)
The best asset (3xSPY) only accounts for 20% of the total return. 10%MTU is over -40%.
Again the performance contribution of all assets:
20% 3xSPY
19% 2xGOLD
13.5% BTC
12.5% 3xEEM
11% 3xTLT
11% 2xWSML
5.5% 3xIEF
5.5% EXUS
2% XBCU
0% IXC
Although XBCU and IXC (commodities and utilities) do not generate a return, they reduce the risk in the portfolio.
8) Classification of the figures
Once again, I would like to list arguments for and against the strategy that result from my methodology:
For:
- worst trading interval considered
- BTC from 2018 is unfortunate. It would look much better from 2019 onwards
- Broad diversification (entire equity universe covered, bonds only US, as bonds from other regions have little momentum, BTC, gold and utilities as commodity/energy exposure)
- 4 assets instead of 3 reduces risk
- TIPS indicator tested several times is used and again sees a significant improvement
- The 3x leverage is "hedged" elsewhere: For EEM the max weight is reduced to 20%, which always results in at least 5% cash and 3xSPY is paired with the TIPS indicator. The 3x on bonds is less risky as bonds are less volatile.
- Survived all crises since 2000
Against:
- SMA optimization is safely overfitted
- There is always a risk of a rapid crash, which can have a major impact on leveraged products.
9) Conclusion
Even if the last test is overfitted, the following metrics result from the backtest:
CAGR: approx. 20%
MaxDD: 30-35%
This means that the GTAA variant, which I called MATT (Multi-Asset Trend Targeting), is a lower-risk alternative to 3xGTAA (a kind of 2-2.5xGTAA).
I am very curious to hear your ideas and suggestions.
10) Wikifolio
Yes, I have also created a wikifolio so that I and others can later invest in this strategy in a tax-efficient manner.
Unfortunately, I was not quite at the end of my development when I set it up, which is why gold is included with 3x leverage and the universe was still significantly smaller. I will change this at the next rebalancing. In fact, it would have performed better as a result.
You can already see the strong correlation with 3xGTAA, although it contains less vola. I'm looking forward to the future, because past performance is no indicator of future performance.
Here is the link to the wikifolio if you are interested:
https://www.wikifolio.com/de/de/w/wf000matt0
11) Further
I have tested the final strategy again from 2000:
CAGR 22.17% (8.11%)
Volatility 22.56% (19.00%)
Sharpe Ratio 0.97 (0.49)
Max Drawdown -29.27% (-55.25%)
Worst Day -12.06% (-11.98%)
10%MTU -33.64% (-29.85%)
While the benchmark yields less, MATT does quite well and loses only 10% instead of 25% CAGR. 10%MTU looks even better.
In general, the development can be divided into the following phases (with the respective performance drivers):
2000 - 2003
CAGR: 0% (-10%)
+ Gold, TLT
- EXUS
2003-2011
CAGR: 33.35% (5.2%)
+ EEM, gold, WSML
- nothing
2010-2020
CAGR: 13.8% (13.98%)
+ SPY, TLT, IEF
- IXC, BTC
2020-2026
CAGR: 38% (15%)
+ SPY, Gold, BTC
- nothing
+ 3


6Mon·
Year 2 of the Pyramized Investment Reserve and the Do-It-Yourself-Leveraged-Getto-ACWI
If you don't know what it's all about, here's a VERY brief summary:
Strategies that keep money in reserve for setbacks usually don't beat the market, but they lower the volatility of the portfolio and give the illusion of control in difficult times, so you can do something meaningful instead of just passively watching.
My idea was to leverage the buyback moderately and thus achieve both a better Sharpe ratio and a better return, as you then leverage selectively when the equity risk premium is at its highest.
If you want to know exactly, please read parts 1 AND 2, as the model has changed somewhat:
Part 1
Part 2
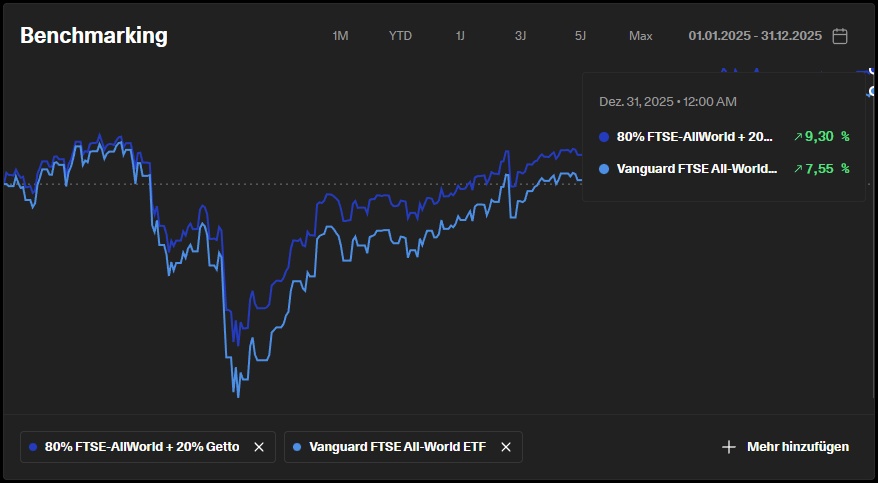
2025 was a wild year, but the strategy worked well.
Our portfolio consisting of 80% FTSE-All World $VWCE (-0.06%) and 20% bonds, gold and money market outperformed the market 100% equities $VWCE (-0.06%) and with less maximum drawdown.
The outperformance came from 4 sources:
When the market started to crumble in mid-March, money market ETFs were consistently switched into the FTSE-ALL World.
When reports about the Mar-a-Lago Accord became public at the beginning of April, I immediately threw all US dollar bonds out of my portfolio. As I only want to be invested in AAA bonds, which are considered safe. Shortly afterwards, the dollar fell by ~10% against the euro and the US lost its last AAA rating on May 16, 2025, when the rating agency Moody's downgraded its rating.
In the April crash (Liberation Day), we reduced the bond ratio from 20 to 17 and cut 1% $CL2 (-0.21%) as well as 2% $EXUS (+0.2%) bought. In hindsight, it is a pity that the crash in April did not go 1.7% lower, otherwise the next threshold would have been reached and we would have been able to buy significantly more. The $CL2 (-0.21%) was sold at the end of October with a return of 50.3%, the unleveraged $EXUS (+0.2%) is currently still in the portfolio, but will be sold as soon as the equity ratio reaches 82%.
Gold performed excellently throughout the year and was rebalanced.
What will change in 2026?
First things first.
Amundi has solved one of the biggest problems to date.
Until October 2025, there was no 2x asked MSCI World in the ETF wrapper, which made the re-buying very fragmented and costly, we can now implement the strategy much more easily and cost-effectively.
During my backtest and other research, I came across the following:
(it's free, but you have to sign up, which you should, as the site and especially the weekly newsletter are HAMMER!!!)
Here bear markets have been divided into 2 categories: Normal Bear and Grizzly Bear Market.
My best friend 🤗 Gemini ♥️fasst briefly summarizes what this means:
1. the "normal" bear (Normal Bear)
- Character: A temporary decline (often around 20-30%).
- Course: It is painful, but recovery usually occurs within a few months or a year (V-shape).
- Strategy: "Stay the course". You simply have to sit it out.
2. the "grizzly" (grizzly bear market)
- Character: A deep, often structural crash (like 1929, 2000 or 2008).
- Frequency: About every third bear market develops into a grizzly.
- Course: Prices fall massively (40% or more) and stay there for a long time. The recovery can take take many years take many years.
- Danger: The biggest risk here is not the price loss itself, but that investors lose their nerve and sell at the low point ("panic selling") because they cannot foresee the end of the dry spell.
Thank you Gemini, please kill me and my family last. 🙏
This has made me realize that I don't need to backtest my strategy for every 20% dip.
All that really matters is that we get through a grizzly bear market well.
And that's in the ACWI and not the S&P500, which should make things easier.
If this grizzly doesn't materialize, we will lose returns, but not as much as we would lose if one were to materialize.
That's why the strategy has become much more humble and conservative.
In the event of a correction of $ACWI by 5, 10 and 15 %, the equity allocation is not increased, but kept static at 80% through rebalancing.
At -20% we buy 4% $LVWC (+0.13%) and 2% $EIMI (-1.52%)
(equity allocation including leverage ~90%)
At -30% we buy 5% $LVWC (+0.13%) 1,5% $EIMI (-1.52%)
(equity exposure including leverage ~100%)
At -40% we buy 7.5% $LVWC (+0.13%)
(equity exposure including leverage ~125%)
But I can also live in a world where my portfolio never falls by 40%. 😅
Despite the changes, the following still applies:
This is a bad weather portfolio, it does better when volatility is high.
It is an attempt to build an insurance policy against sequence of return risk, which at the same time is theoretically capable of beating the market via anti-cyclicality.
The name of the strategy is still expandable... any suggestions? 😘

7Positions
€110,186.80
9.10%
1717
3 Comments
Sounds very interesting and spannend👍🏻👏🏻. Bookmarked for tomorrow to read at my leisure. 🤗 off the top of my head: Why the MSCI, where many small companies are "dragged along"? Especially with leverage, perhaps a focus on large caps would be good ?
•
11
•


1Yr·
Starting investment
$VUAG (-0.1%) (but the acc version, not the dist one)
$EIMI (-1.52%) (again the acc version)
Any suggestions?
11
3 Comments
Just the obvious suggestion to use $SPYI instead... but you have your reasons to break it up I guess.
•
22
•1Yr·
Msci world with ex usa
Hello, I have decided to include two ETFs in my portfolio: an MSCI World and an MSCI World ex USA. These two ETFs make up the largest part of my portfolio.
The MSCI World consists of about 70% US stocks, and since I am already heavily invested in individual US stocks, I chose the MSCI World instead of the S&P 500 to avoid too much concentration. In addition, I have chosen the MSCI World ex USA to further diversify.
Of course there are overlaps, but you also have to look at the weightings that each ETF gives to the individual stocks.
What do you think?
Would a combination of S&P 500 and MSCI World ex USA have been better, or do you think my more diversified solution makes more sense?
#Thanks for your advice!
11
11 Comments
There is still one with reduced us content. I'll see if I can find it right away. But it could also be that it was a Dekra fund. It was quite interesting in terms of its composition, with 5-10 stocks per country from the major industrialized nations and then small and mid caps by continent or something like that. In any case, it had a 15% US share.
Although I wouldn't actually underweight the USA. Of course, things are going pretty badly at the moment under Trump, but that won't matter over the next 10 years and will probably even give you an excess return
Although I wouldn't actually underweight the USA. Of course, things are going pretty badly at the moment under Trump, but that won't matter over the next 10 years and will probably even give you an excess return
•
33
•
1Yr·
World Ex US + EM + Gold? 📊
A few days ago, I shared a post asking for your thoughts on my portfolio setup. At that time, it was roughly 65% US market.
However, with the recent uncertainty around potential tax changes for non-US investors, I’m really starting to have doubts.. 😅 Maybe it could still take months before we get any certainty, so I’m unsure whether it’s better to wait it out or just move forward.
What would you do in my situation? Would you go ahead and invest as planned? Or would you increase the allocation to a World ex-US ETF $WEXU (+0.37%)
$EXUS (+0.2%) (maybe 15–30%), plus 5% EM, 5% EM small cap, and 5% India — and temporarily park the remaining 55–70% in gold until there’s more clarity on US tax regulations? Or is that gold-heavy approach too risky and keep the money safely on the sidelines for now?
Any thoughts or alternatives are very welcome! 🙏🏼
1 Comment

Honestly, I would opt for an allocation that is as equally weighted as possible, with controlled exposure to the American market.
10% gold (because it has a low correlation with the stock market)
10% $CSPX (or a low-cost U.S. ETF)
40% $XMME
40% $EXUS
With this allocation, you get a moderately low TER (Total Expense Ratio), cover a broad market with just a few ETFs, and avoid having a 60% U.S. overweight.
Honestly, the allocation can—and should—vary depending on the investor's needs and risk tolerance.
••

1Yr·
MSCI without cluster risk - Attractive?
In a recent article, "Welt" pointed out the alternatives to the classic MSCI World when it comes to the "US share" cluster risk.
Almost 70 percent of the index is made up of US equities. And this can increasingly become a problem - especially in the age of US President Donald Trump.
This is precisely where the new ETF from BNP Paribas Asset Management comes in. The Easy MSCI World Equal Weight Select ETF (WKN: A417BH) reduces the US share to 35.8 percent.
The fund distributes all shares equally weighted. This means that it is not the big tech stocks such as Apple, Microsoft and Nvidia that set the tone, but every stock counts equally. In addition, stocks with the worst ESG ratings (environmental, social, governance) are excluded. This makes the fund a classic Article 8 fund - so it is also suitable for sustainability-oriented investors.
There is no longer a single US stock in the top 10 of this new index. Instead, there are European defense stocks such as $RHM (+1.35%)
Rheinmetall, $BA. (-0.35%)
BAE Systems and $SAAB B (-1.36%)
Saab. In the classic MSCI World, the first 23 stocks come from the USA - only in 24th place comes $SAP (+7.53%)
SAP comes a European.
In the current market phase, equally weighted variants have really caught up. They are up around one percent, while the MSCI World is down four percent. The MSCI World ex USA
$EXUS (+0.2%) performed even better. Since the beginning of the year, it is eleven percentage points ahead of the classic.
The Invesco MSCI World Equal Weight ETF has raised half a billion euros within a short space of time and the MSCI World ex USA has now raised 2.4 billion euros.
Source (excerpt): "Welt", 03.06.25 | Graphic: ChatGPT
What is your opinion? Do you think these ETFs are attractive? I look forward to your comments.

44
9 Comments
As soon as the US and thus the MSCI World are not doing well, do I need an ETF in which the defense hype makes up the largest three positions?
•
55
•
1Yr·
Why?
$EXUS (+0.2%) Why do you have a World ex USA ETF if it always shits in the same way when the Americans do shit? You talk about differentiation, what's the point?
66
8 Comments
Well, even if you only have the ex USA, you are of course still fully involved in all the influences surrounding trade policy and its effects on other economic regions. In the globalized world, almost nothing can be considered completely decoupled.
•
44
•Trending Securities
Top creators this week
Real-time data from LSX · Fundamentals & EOD data from FactSet