- The Essen-based construction group has built up a significant lead; its shares have gained 190% in recent months, driven by rising infrastructure spending in defense and data center construction.
With a free float market capitalization of €7.2 billion, Hochtief is the leading candidate for promotion.
- The founding member from 1988, which was relegated to the MDAX in 2020 during coronavirus, is aiming to climb back up again. With a free float market capitalization of €8.1 billion, Lufthansa is even just ahead of Hochtief, but the Iran conflict makes its ascent uncertain.
June 2026:
Possible relegation candidates
According to Deutsche Bank analysts, these two stocks are the main candidates for relegation:
Porsche Automobilholding (SE) - Considered to be the main candidate for relegation; if Porsche SE leaves the DAX, it could remain in the MDAX permanently, as the company does not currently meet the EBITDA requirement (positive EBITDA in the last two financial years)
Irrespective of ascents and descents, BMW will gain significantly in weight in the DAX: The BMW Annual General Meeting approved the conversion of all preference shares into ordinary shares, which should increase the free float share by almost 20%.
BMW's index weighting could rise from 1.2% to around 1.5% - approximately € 70 million will flow into BMW shares from ETFs alone as a result.
Note: The final decision will be made on June 4, 2026.
Until then, market conditions may still change - the race between Hochtief and Lufthansa in particular is considered to be very close.
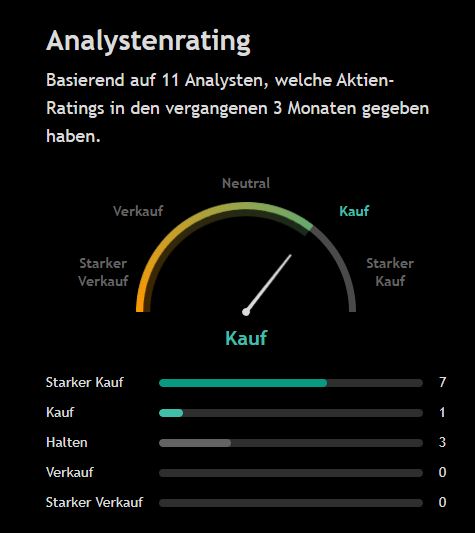
$RDC (-5,14%) The outlook is looking up again, the forecast has been raised, and analysts are also taking a more positive view of Shopapotheke after months of uncertainty.
With a 28% gain over the last 5 days , $RDC (-5,14%) pretty good 😉
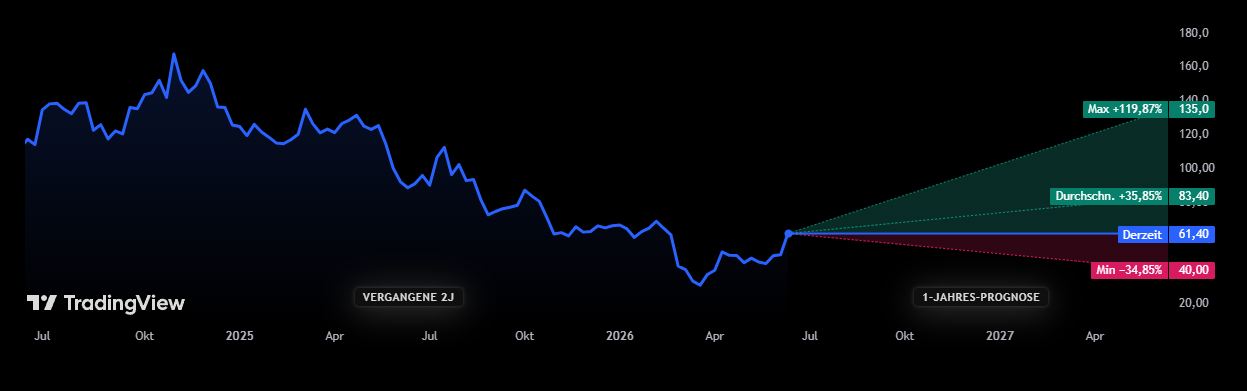
For example, Deutsche Bank has raised the price target to €102 and maintained its "Buy" recommendation.
Deutsche Bank Research has raised the price target for Redcare Pharmacy from €99 to €102 following higher targets for the current year and has maintained the "Buy" rating. This improved outlook translates to roughly 15 percent higher consensus estimates for the online pharmacy, wrote Jan Koch in a report released on Tuesday. He raised the estimate for adjusted operating profit (EBITDA) in 2026 by 12 percent./rob/bek/ajx
I wanted to ask what you think of Redcare Pharmacy $RDC (-5,14%) think? Does anyone have any more detailed information about the prolonged fall in the share price? The valuation now seems very, very low if you just look at the forecasts. Does anyone have an opinion? @Tenbagger2024 @Klein-Anleger @Multibagger
Edit: Thanks for all the opinions. This shows once again that you have to look at more than just the growth rates.
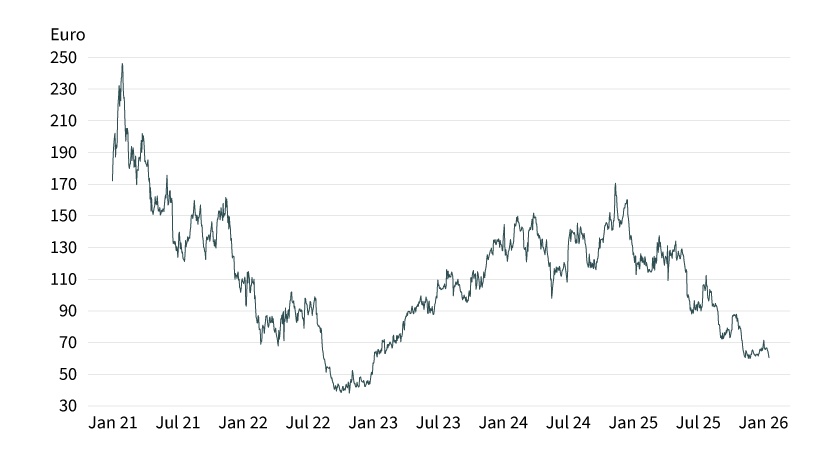
"Hello Mr. PikaPika, Here's my honest and direct opinion on Redcare Pharmacy (formerly Shop Apotheke): For me, this thing is currently a classic 'growth at any price' trap. Yes, sales are growing strongly (+24 % to almost € 3 billion), which looks great at first glance. But what is the point of growth if the bottom line is nothing? Here are the warning signs for me as to why I would be cautious: Growth without profit: the company is still in the red (approx. € -39 million net result). Even the nicely calculated 'adjusted' EBITDA is only a meagre 2%, the real EBIT margin is even negative. Burning money (cash flow): They are investing massively in logistics and automation. Although this is necessary, it means that the free cash flow is deep red (approx. € -87 million). This means that more money is currently flowing out of the company than in. The chart does not lie: the fall of over 50% is no coincidence. The market simply no longer has any patience for 'story stocks' that generate sales but no profits. Conclusion: If you want to bet on a turnaround and have strong nerves, you can gamble here. But if you are looking for quality, secure margins or even dividends, you are in the wrong place. For me, this is a 'no-touch' until the margin climbs sustainably above 5% and they prove that they can actually make money."
What do you expect from $HIMS. You have massively declining margins due to sharply rising marketing expenses and price cuts. There is also the threat of further regulatory intervention.
a technical long reaction at $RDC (-5,14%) ? The stock has been in a downtrend for some time and keeps forming new 52-week lows. Furthermore, it is sold quite short.
But in my opinion, the last price setbacks were exaggerated due to seasonal sales declines in August and it could be time for at least a leveraged counter-reaction. After all, the best months of the fall and winter are now approaching with many colds
What do you think about this @TomTurboInvest ? Do you see opportunities or more risks?
Could go down even further as the company drops out of the Stoxx Europe 600 Index. At the beginning of the week, analysts at Oddo BHF also drastically lowered their price target for the online pharmacy.
Someone is worried about dm's entry into the business. The first parcels have been sent out and people are probably afraid of dm becoming the market leader.
here is an overview of the latest developments at Redcare Pharmacy $RDC (-5,14%) formerly known as Shop Apotheke Europe.
📈 Key financial figures (as of Q2 2025)
Turnover (TTM): USD 1.33 billion
EBIT (TTM): USD -74.83 million
Adjusted EBITDA margin (Q2): 2.6%
Sales growth (Q2 YoY): +26,5 %
Current share price: approx. EUR 102.70
🔍 Analysis
Strengths:
Strong sales growth: In the second quarter of 2025, Redcare Pharmacy achieved impressive sales growth of 26.5% year-on-year.
Adjusted EBITDA margin: Adjusted EBITDA margin increased to 2.6%, the highest level in the last 12 months
Expansion into international markets: The International segment (Belgium, the Netherlands, France and Italy) grew by 26.2 % to EUR 135 million in the first quarter of 2025.
Challenges:
Unprofitability: Despite sales growth, the company remains negative in terms of EBIT.
Regulatory uncertainties: The pharmacy market is highly regulated, particularly in Europe, which poses potential risks.
Competitive pressure: The online pharmacy market is highly competitive, which can lead to pressure on margins.()
📌 Conclusion
Redcare Pharmacy shows solid growth figures and a positive development in international markets. The rising EBITDA margin indicates progress in profitability. However, the company is still in negative territory in terms of EBIT, which could continue to make investors cautious.
What do you think about the current development of Redcare Pharmacy? Do you see potential for sustainable profitability? $RDC (-5,14%)
In principle, the business model could work, albeit with low margins in the future. What bothers me personally is the high short ratio of over 10% of all outstanding shares. If the quarterly figures turn out to be significantly worse, you will immediately have a share price performance like that of $TTD. And to be honest, I don't fancy that.