AI-driven flash crash
An AI flash crash occurs when modern trading algorithms trigger massive waves of selling in a matter of seconds.
These systems are usually programmed to react to price changes or data signals, such as stop loss limits or short-term price drops.
If a share reaches a critical price, programmed algorithms automatically trigger sales.
These orders drive the price down further, causing other algorithms with similar mechanisms to also sell ("sell side momentum").
This so-called cascade effect can cause the price to plummet within minutes.
(Example: Cascade effect of critical infrastructure during heavy rainfall)
(https://link.springer.com)
The trading speed of AI models today is so high that the smallest triggers (e.g. false signals) can result in a storm of trades in a flash.
Experts warn that many AI models are based on similar data, which can lead to "swarm thinking":
If several systems misinterpret the same signals at the same time, a small price slide can very quickly turn into a huge sell-off.
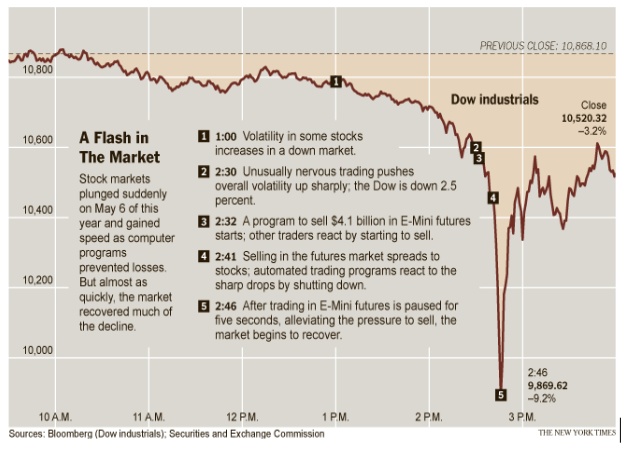
(Example: The flash crash of 6 May 2010 began with a large sell-off program being triggered for S&P 500 futures).
(https://www.advisorperspectives.com)
Although the markets recovered by the close of trading, this example shows how domino effects can be caused by automated orders.
AI can also have its own say:
Modern systems read news and social media in real time and react independently.
Bots can also incorporate completely new information (tweets or news) and generate buy or sell signals from this.
Incorrectly generated or misinterpreted messages can therefore immediately lead to sales.
1.
Possible triggers
Data error or manipulation:
Incorrect market data (prices, volumes) or cyber attacks on data can trigger false signals.
Algorithms that react blindly to data could falsely trigger sales or purchases.
The term:
"Simulation Deception"
(https://www.tencentcloud.com/techpedia/118834)
describes artificial patterns in the market that are created by manipulated data.
For example, an attacker could use fake buy/sell orders (spoofing) to artificially simulate liquidity, whereupon AI systems panic and trade in the opposite direction.
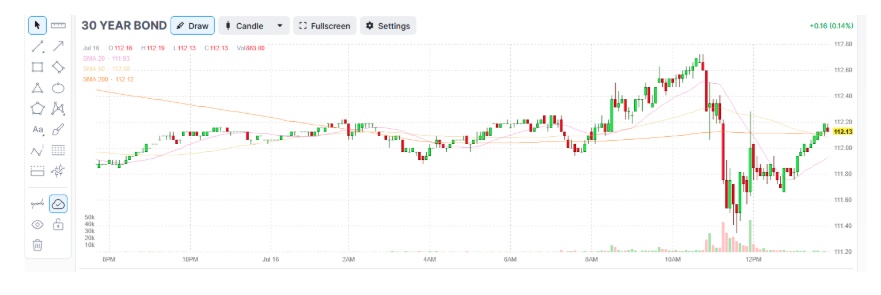
Fake news and deepfakes:
Artificial intelligence now allows deceptively real false reports (deepfake video, fake tweets, etc.).
(Example: on July 16, 2025, Congress member Anna Paulina Luna from Florida wrote on X (Twitter) that she had heard from President Trump that Fed chief Powell would be fired immediately).
(https://www.advisorperspectives.com)
(https://www.advisorperspectives.com)
AI searched all social media posts specifically for tradable news. It found what it was looking for and a violent reaction in the bond and stock markets followed, as shown above.
In previous cases, the impact might have been weaker, as the president could have reacted more quickly and dismissed the statements before many market participants were even aware of the rumor.
Even little-known posts can lead to strong market movements within minutes thanks to AI attention.
World Economic Forum analyses explicitly warn:
Machine-generated fake news can act like a flash crash trigger.
More and more bots are able to spread such false information in order to deceive trading algorithms.
AI misinterpretation:
Even if the data is correct, AI models can misinterpret it.
Trading algorithms that process complex data (news, technical indicators) run the risk of interpreting irrelevant noise as a signal.
Lawfare cites as an example that AI-supported systems already "misread" the market in 2010 and 2016. "misread" the market and launched unfounded waves of selling.
"A few algorithms in use simply misread
the market. The unwarranted sell-off initiated by those mistaken models then caused other programs to respond in kind. The $1 trillion lost in that half hour period was eventually made up thanks to human intervention. "
In the future, such misinterpretations will be even more critical as AI models analyze huge amounts of data from social media and news.
Panic signals/cascades:
In a battered market, automated risk offs (stop sales after a fixed loss limit) can trigger a race.
If, for example, a key figure ($VIXindex level) reaches a critical value, many systems switch to safety at the same time - which can cause a variety of similar assets to fall as an artificial panic impulse.
2.
Affected asset classes
An AI Flash Crash affects various asset classes:
Equities:
This is often the first impetus of a crash.
Globally listed stocks (indices such as S&P 500, DAX, Nikkei) see massive price losses in a matter of seconds.
A shutdown of a large position, for example, can cause other algorithms to panic sell.
Historically, the stock market has experienced such sell-off waves several times.
2010 Dow $DJIA
(https://en.wikipedia.org)
2014 US bonds
(https://www.ft.com)
An AI-supported flash crash would accelerate this mechanism even further. A sharp slump is usually followed by a partial recovery within a few days or weeks.
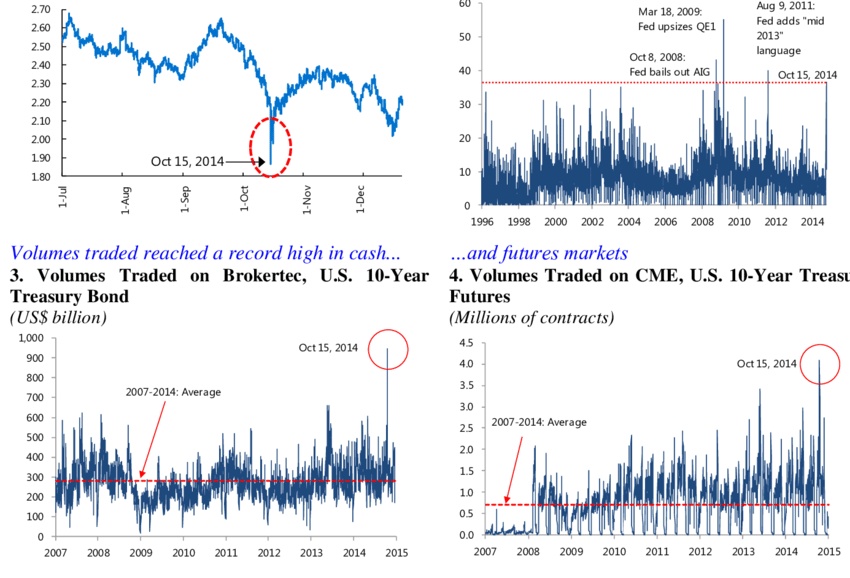
Bonds:
Bond markets can also "flash".
In the famous Treasury Flash Crash of 2014, the yield on the US 10-year Treasury Yield plummeted by 1.6% in twelve minutes, followed by a recovery - triggered by algorithmic sell orders at record levels.
(https://www.researchgate.net)
(Theoretically, AI can act against this:
In a stock panic, investors often flee into bonds (price rises, yield falls).
But AI-controlled bond funds could simultaneously and automatically reach certain thresholds and trigger the sale of bonds or bond futures.
This could lead to sharp interest rate swings in the short term, even if the fundamentals do not justify this).
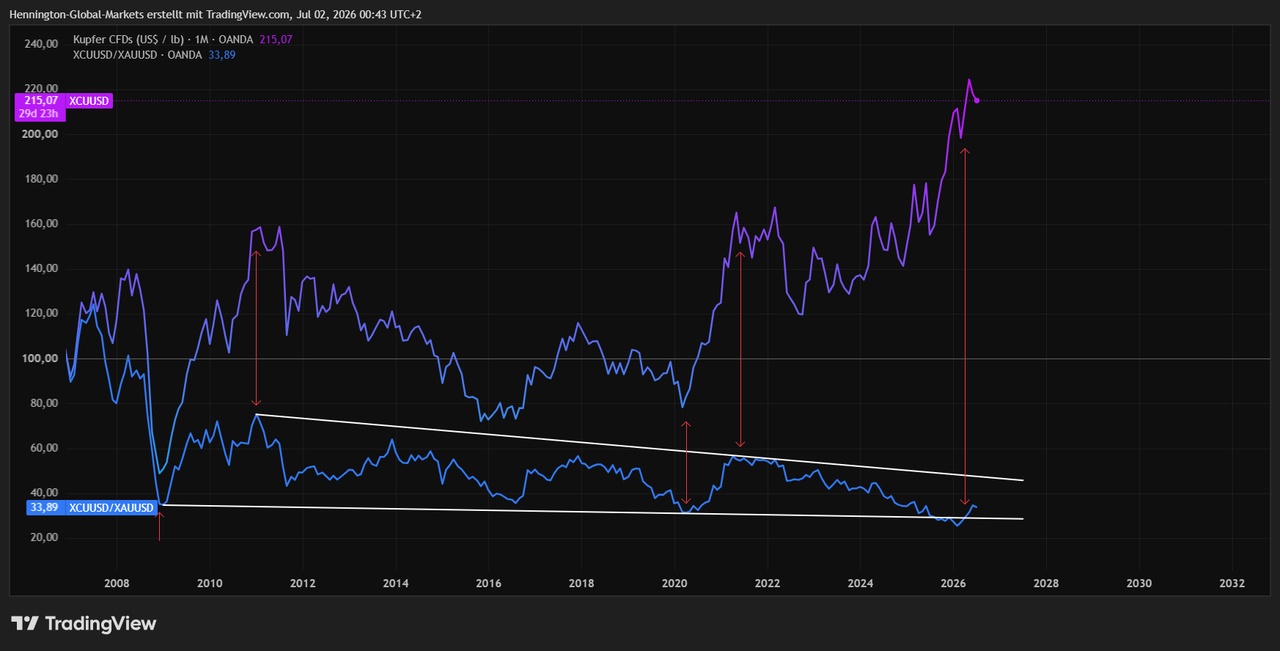
Commodities:
When uncertainty is high, commodity prices often tip.
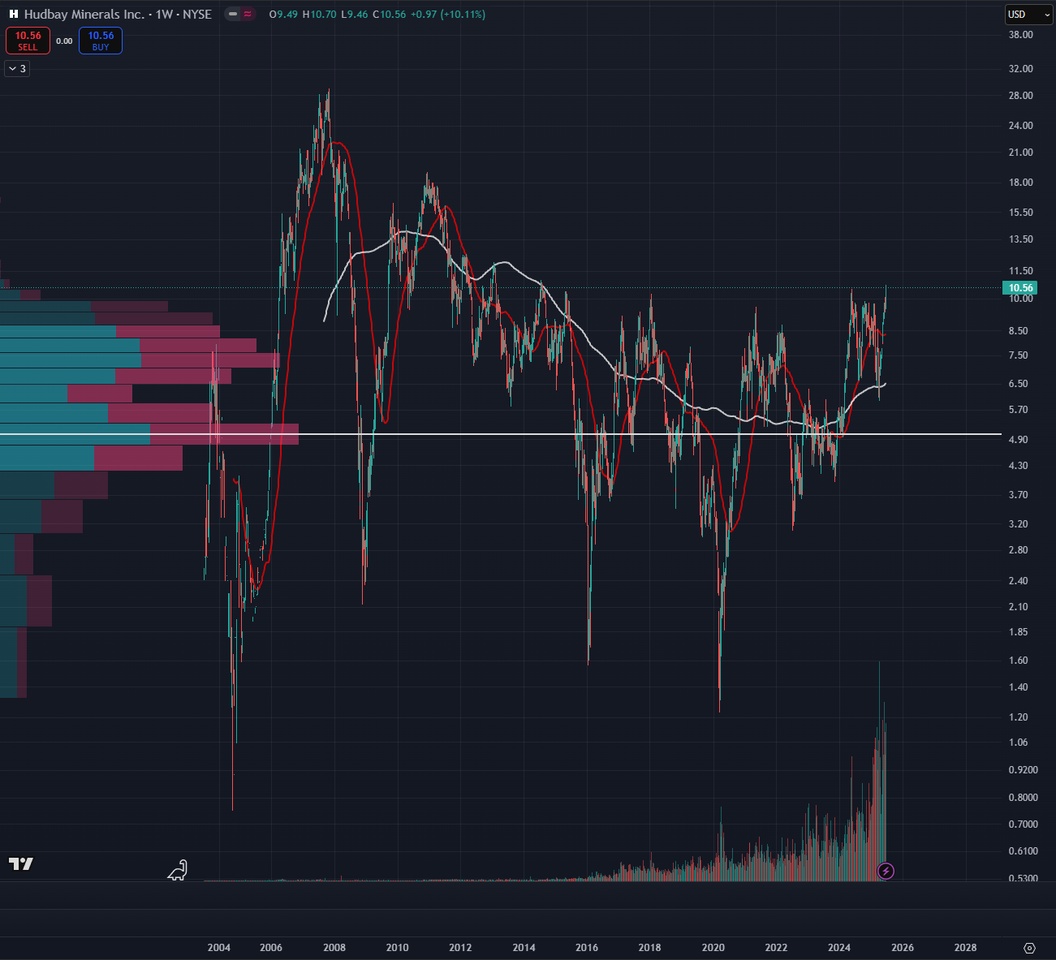
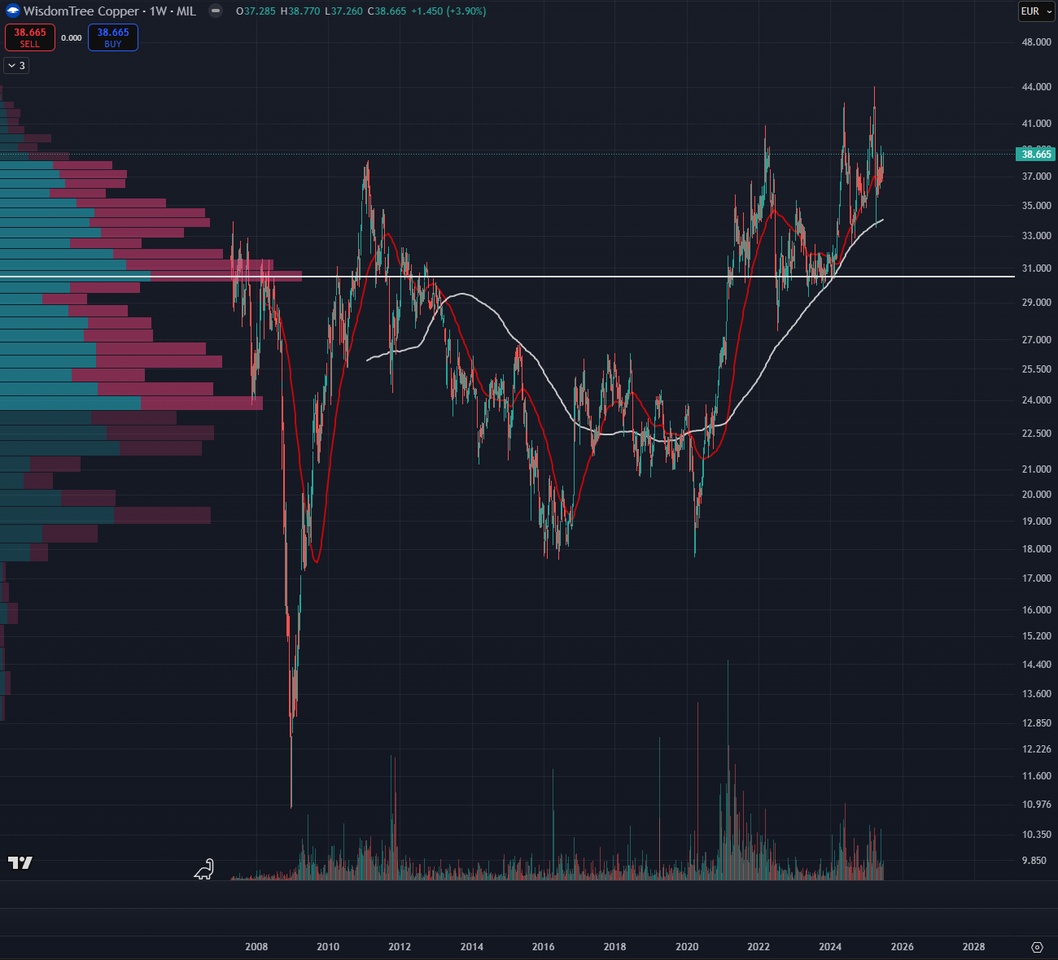
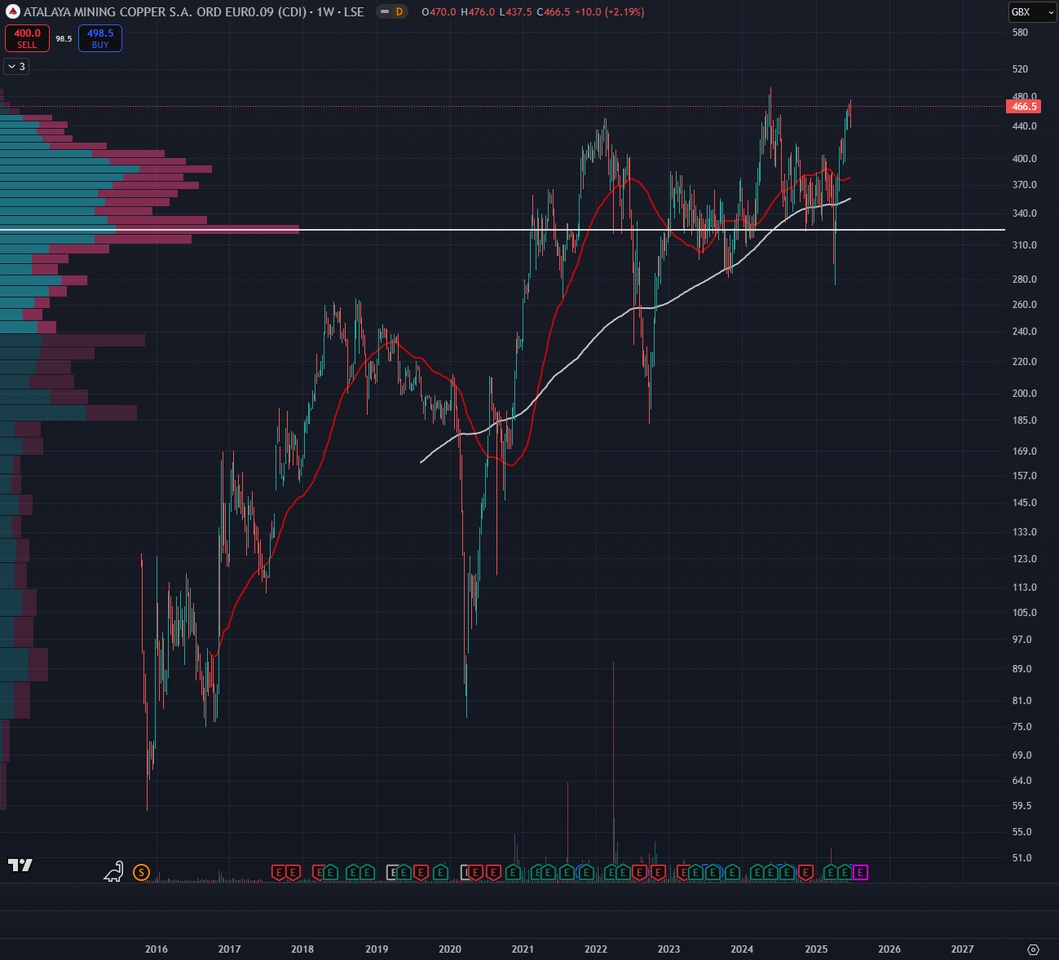
Typically, oil ($IOIL00 (-6,53%) ), gas ($NGS ) and industrial metal prices ($COPA (+1,49%) , $ALUM (+0,55%) , $ZINC (+1,42%) ) in a crash phase due to expected weaker demand.
AI programs on the commodities market (e.g. in oil or gold futures trading) could intensify this crash or even trigger a "mini flash crash" in individual commodities.
(Example: the slump in silver futures in July 2017:
Price plunge of over 11% during Asia close when thin trading was blamed on algorithm shifts).
(https://finance.yahoo.com)
AI in commodity markets can therefore both trigger selling spikes and initiate a rapid countermovement through post-buy programs.
Cryptocurrencies:
These are considered particularly volatile.
AI trading bots are everywhere, so cryptocurrencies are in free fall when many bots recognize "fear" signals at the same time.
(Example: In May 2021 $BTC (-1,41%)
plummeted by around 30% within hours, partly because many algorithms sold en masse after signals about China's Bitcoin ban).
(https://www.brokerdeal.de)
$ETH (-2,37%) experienced a flash crash on one platform in 2017 because a huge sell order triggered many automated trades.
(https://www.ubergizmo.com)
Crypto markets run 24/7, are unregulated and therefore more susceptible to algorithmic chain reactions.
3.
Risk matrix by region
The probability of occurrence and the extent of damage caused by a crash differ from region to region:
USA:
- Very high trading volume and dominant use of AI algorithms in New York and Chicago.
- Large index futures can act as initiators.
- Probability of a crash is considered moderate to high as there is a lot of automated trading here.
- Damage would be extremely highas the US markets are of global systemic importance.
- Trading halts mitigate the impact on the trading day, but the crash effect on global investor sentiment would be enormous.
Europe:
- Heavy reliance on passive funds and ETFs (e.g. from $BLK (-0,16%) iShares).
- Algorithms are widespread, but somewhat less so than in the USA.
- Probability rather mediumdamage high.
- ETF crashes show that sudden panic can also lead to chain reactions in equities.
- European banking crisis could arise if credit markets are burdened by US shocks.
Asia:
- Regulation and trading times differ.
- Flash crashes can have a rapid impact on Asia (Nikkei, SSE), especially if they start at night when trading is thin.
Medium probability and medium damage - because Asian markets close faster and usually react later. - Crashes in Asia could affect yen or euro performance, for example.
Crypto:
- Market open around the clock, little regulation, high leverage.
- The probability of a major crash in crypto is very highas price falls are more frequent and driven by AI bots.
- Damage is often limited to crypto investors, but can also affect traditional markets via linked financial assets (Bitcoin ETFs, leveraged crypto products).
The matrix overview could therefore show
- Short term (minutes to days):
A sudden flash crash would last seconds to minutes.
Prices plummet, many stop loss orders are triggered.
Stock exchanges switch on automatic trading pauses to stop algorithm spirals.
Investors lose billions in a very short space of time, many markets are temporarily illiquid.
Confidence collapses, many investors panic and are uninformed.
- Medium-term (weeks to months):
Markets should stabilize again in the following days to weeks as counter-cyclical AI and manual orders intervene.
In the medium term, economic data could be affected if a crash impacts financing conditions.
Media and public will question confidence in digital markets for months.
Investors report consequences such as increased demand for safe assets (gold, government bonds).
Regulation and market mechanisms would adapt.
We could expect a regulatory boost:
- Stricter rules for AI in trading
- Transparency obligations for algorithm models
- Supervision of financial AI by regulators (SEC, BaFin, ESMA etc.).
Already in the past, the 2010 flash crash led to new trading interruptions and considerations regarding trading system requirements.
An AI crash would likely have a disciplining effect:
Providers need to develop more robust AI models, and contingency plans (kill switches) could become mandatory.
In the long term, confidence could be slow to recover:
Institutional investors would only have limited confidence in AI systems, and many private investors might temporarily hold back or prefer alternative strategies.
4.
Specific players and technologies
BlackRock Aladdin:
BlackRock's Aladdin AI system currently manages more than 30,000 portfolios and permanently rebalances enormous amounts of capital.
If Aladdin is routinely programmed to sell too much for ETFs or funds, this can trigger billions of orders.
Nvidia & AI chips:
$NVDA (+1%) Supplies the hardware for many AI models and is itself a market star.
High expectations for AI have fueled Nvidia's share price for years.
Algorithms are strongly fixated on such shares.
If, for example, Nvidia's share price falls abruptly, many strategies trigger sell programs.
Such a domino effect
$NVDA (+1%) -> $SEMI (+1,51%) -> $CSNDX (+0,56%)
could fuel a crash.
In practice, it has been shown that Nvidia reacts very volatile to macroeconomic and geopolitical news, so the next AI turbulence could drag down the entire tech sector.
AI bots on Binance (Crypto):
On crypto exchanges like Binance, many users trade with automated bots.
A large part of the crypto trading volume comes from AI-supported systems.
These bots can generate simultaneous sell or buy waves.
AI-driven ETF rebalancing:
Large index ETFs and passive funds (BlackRock iShares, Vanguard etc.) use automated systems to implement index changes.
If indices rise or fall quickly, many ETFs start rebalancing at the same time.
If the AI signal is negative, all AI-based funds could sell at the same time.
This creates massive sell orders in a short space of time.
Because the volumes involved are in the billions, rebalancing alone can drive a crash further.
Other players:
News agencies, index operators (eg. $MSCI (+0,01%) ), hedge funds with AI strategies and social trading platforms also contribute.
Any sudden outage (e.g. power failure at NYSE) or hacker attack on stock exchange systems could further irritate the AI systems on the stock market.
"When algorithms collide and markets tremble in fractions of a second, the new power of AI is revealed: speed without mercy, precision without emotion. One spark is enough - and the domino effect races through indices, derivatives and crypto-spheres. The AI-driven flash crash is no longer a distant shadow, but the echo of a future in which machines set the pace of the financial world."
Feel free to write your feedback on this post in the comments and tell me if you're interested in something like this.
My plan this morning was actually just to write a short post about this topic, but it turned out to be a bit longer. It's so easy to sit and write all day.
@Kundenservice Please increase the maximum number of pictures for a post, unfortunately I didn't get all the pictures in that I had picked out.
Sources:
- https://www.ig.com/en/trading-strategies/flash-crashes-explained-190503#:~:text=speeds%20based%20on%20pre,as%20the%20prices%20go%20down
- https://www.advisorperspectives.com/articles/2025/07/28/ai-transforming-markets#:~:text=I%20started%20this%20article%20by,a%20flash%20crash%20or%20surge
- https://www.lawfaremedia.org/article/selling-spirals--avoiding-an-ai-flash-crash#:~:text=an%20otherwise%20normal%20trading%20day,up%20thanks%20to%20human%20intervention
- https://www.ig.com/en/trading-strategies/flash-crashes-explained-190503#:~:text=2010%20flash%20crash%3A%20Dow%20Jones
- https://www.advisorperspectives.com/articles/2025/07/28/ai-transforming-markets#:~:text=For%20example%2C%20on%20July%2016%2C,last%20week%20was%20lightning%20fast
- https://www.binance.com/en/square/post/22230680857314
- https://www.tencentcloud.com/techpedia/118834
- https://www.weforum.org/stories/2023/04/technology-vulnerabilities-financial-system/#:~:text=However%2C%20IoT%20botnets%2C%20which%20tamper,grid%20and%20influence%20market%20prices
- https://www.lawfaremedia.org/article/selling-spirals--avoiding-an-ai-flash-crash#:~:text=But%20this%20was%20not%20a,speed%20selling%20spirals.”
- https://corporatefinanceinstitute.com/resources/career-map/sell-side/capital-markets/flash-crashes/#:~:text=Using%20algorithms%20to%20trade%20has,plunge%20in%20the%20market%20occurs
- https://www.ig.com/en/trading-strategies/flash-crashes-explained-190503#:~:text=The%20flash%20crash%20of%20the,impact%20these%20events%20can%20have
- https://www.tastyfx.com/news/flash-crashes-explained-190503/#:~:text=The%20DJIA%20suffered%20yet%20another,NYSE
- https://www.occ.gov/news-issuances/speeches/2024/pub-speech-2024-61.pdf#:~:text=flash%20crashes%2C%20which%20have%20been,4
- https://www.zerodaylaw.com/blog/ai-compliance-safeguarding-financial-markets#:~:text=The%20reliance%20on%20AI%20for,reaching%20consequences
- https://www.nasdaq.com
- https://medium.com
- https://corporatefinanceinstitute.com
- https://www.tastyfx.com
- https://www.binance.com/en
- https://www.lawfaremedia.org
- https://www.weforum.org
- https://www.ig.com/de
- https://www.tencentcloud.com
- https://www.occ.gov
- https://www.ssrn.com/index.cfm/en
- https://www.advisorperspectives.com
- https://www.zerodaylaw.com
- https://www.curiousmonky.com