
Hi everyone,
I'd be interested to know which stocks are currently at the top of your watchlists. I'll start:
$MSFT (-1,69%) Add to portfolio
$8001 (-0,32%) Additional purchase
$CAMX (-1,51%) Buy more
Postos
20Hi everyone,
I'd be interested to know which stocks are currently at the top of your watchlists. I'll start:
$MSFT (-1,69%) Add to portfolio
$8001 (-0,32%) Additional purchase
$CAMX (-1,51%) Buy more

Dear Community,
How often have I been annoyed that I was thrown out of the race with an SL, but this morning I was really happy when $CAMX (-1,51%) plummeted by a whopping 25% for no apparent reason. The SL that I happened to place last night took hold at € 60.20 and saved me from falling to just over € 49.
And what does a (brave) hare do in such a case? He takes the small profit, adds a lot and buys 30 more shares directly at € 49.44. 😂
Perhaps the new entry point has now been reached for some interested parties.
Best regards 🐰
André


Just tell us the title and preferably why you find it so interesting.
For your information $CAMX (-1,51%) I already own
Many thanks in advance for all answers
Hello my dears,
DER AKTIONÄR has now also discovered my portfolio stock Camurus. That's why I'm staying invested.
Perhaps the editors will also read my posts.
The article from DER AKTIONÄR highlights the Swedish biotech company Camurus as a current "top pick" and highlights its strategic partnership with the US pharmaceutical giant Eli Lilly.
🔍 Key messages of the article
AKTIONÄR-Tipp Camurus: "Top-Pick" – mit Eli Lilly in neue Dimensionen - DER AKTIONÄR

Hello folks,
I've already introduced you to Camurus several times, so I won't write too much more about it today.
Why am I introducing the company to you again anyway?
Because the share fits well into my new category
"Points kings" category.
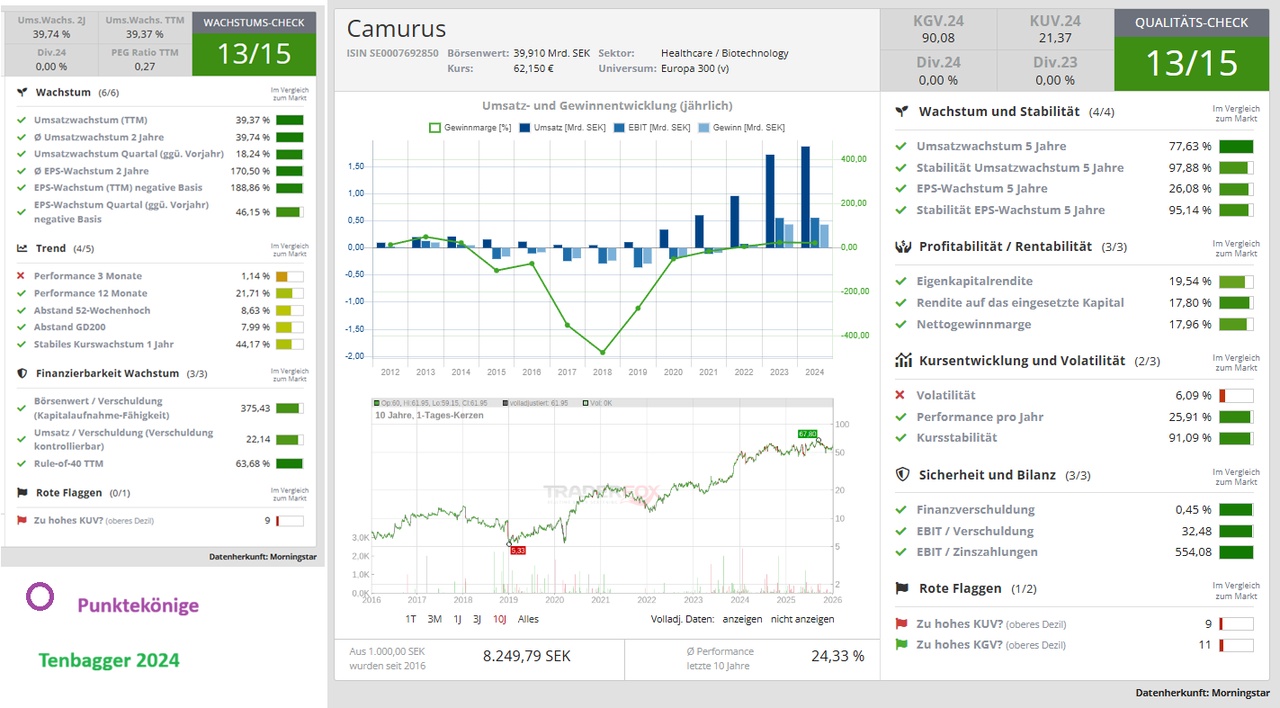
This can be seen in the Traderfox quality and growth check below.
Which most of my readers will already be familiar with.
Why am I reminding you of this share again today?
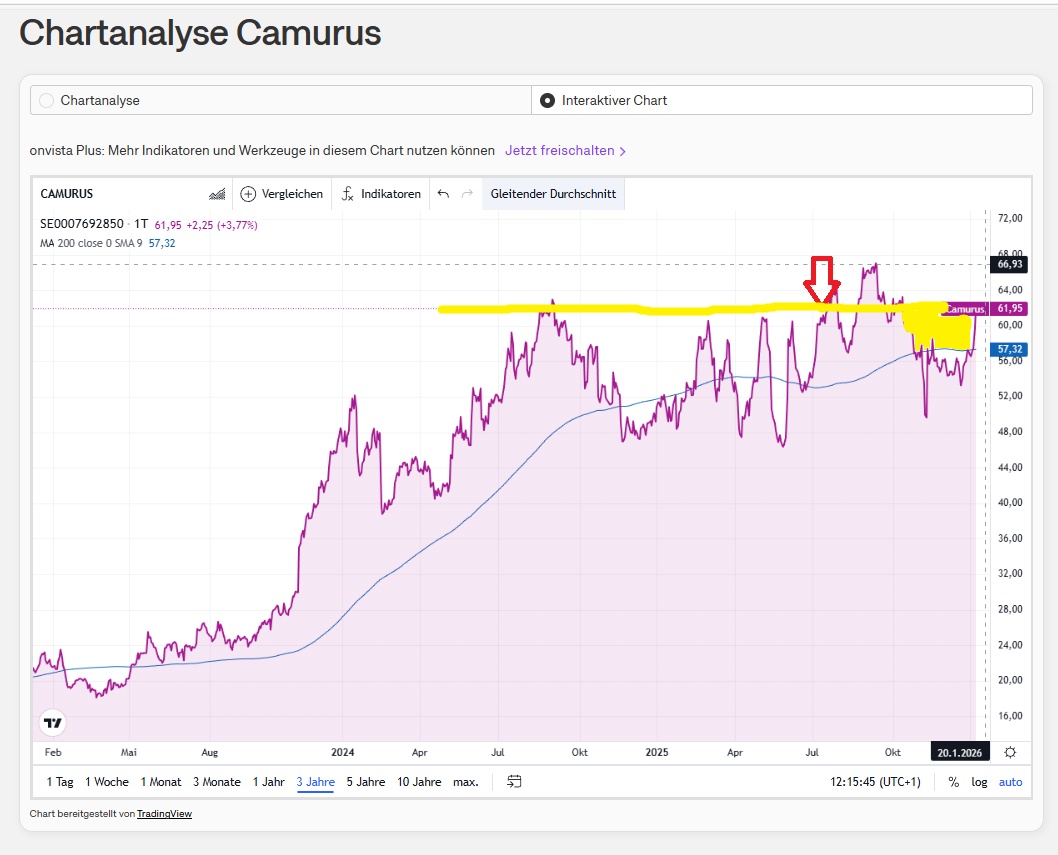
When I bought the share 5 months ago (see red arrow), I assumed that it would break out of the longer sideways movement. I like the fundamentals of the company (see post below from 5 months ago).
But the time for the biotech sector had not yet come. As a result, I first went into negative territory with the share and thus had a good opportunity to buy more.
However, we have seen a sector rotation over the last few days. With good momentum for biotech stocks. Which we can also observe with Camurus (yellow area).
Ladies and gentlemen, could the share be of interest to you now?
@Multibagger
@Dividendenopi
@TomTurboInvest
@All-in-or-nothing
@TradingHase
@Klein-Anleger and everyone else.
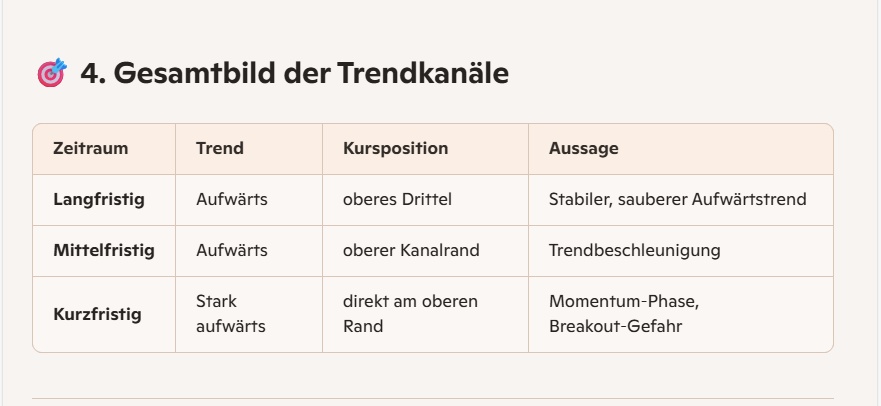
📈 1. trend analysis (short / medium / long)
(purely based on price, daily range, 52-week range and price level)
🔹 Short-term trend (days to a few weeks)
→ Short-term trend: clearly upward (bullish).
🔹 Medium-term trend (weeks to months)
→ Medium-term trend: stable upward trend.
🔹 Long-term trend (months to 1 year)
→ Long-term trend: clearly positive, structurally bullish.
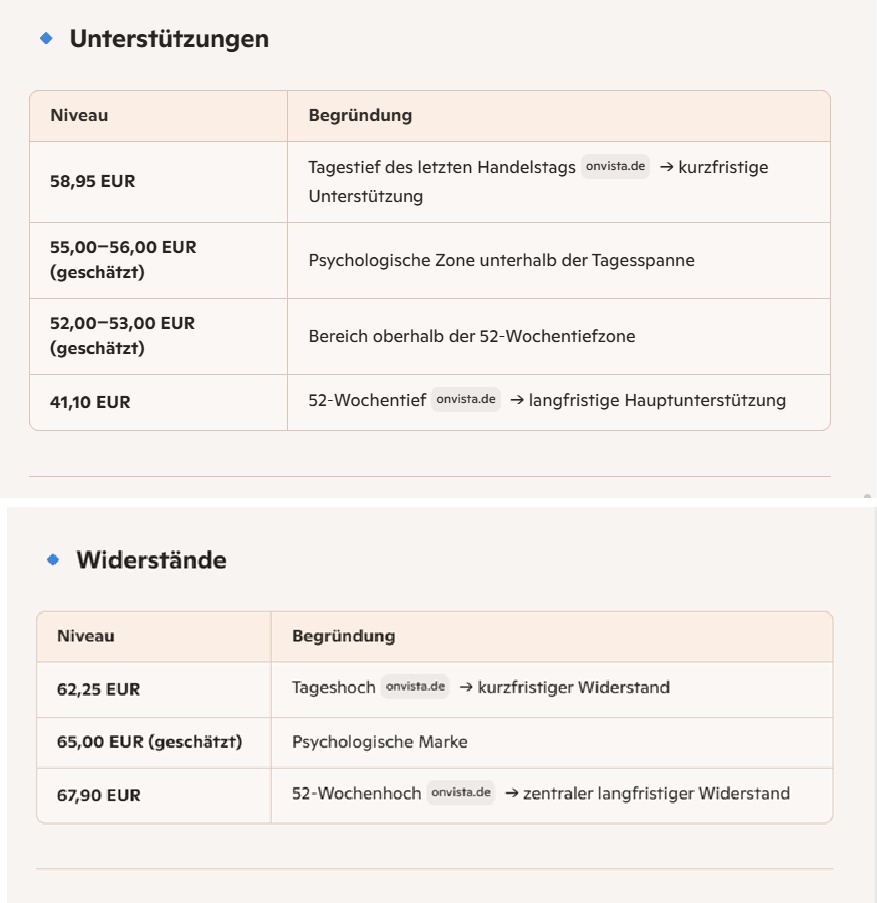
🧱 2. supports & resistances
(derived from daily range, 52-week range and price levels)
🔮 3. scenario model (bullish / neutral / bearish)
(derived purely from chart data and trend situation)
🟢 Bullish scenario
Trigger: Break above EUR 62.25 Targets:
Probability: High, as all trends are bullish.
⚪ Neutral scenario
Trigger: Setback to the EUR 58.95 - 56.00 zone Behavior:
Probability: Medium.
🔴 Bearish scenario
Trigger: Break below EUR 55 Consequences:
Probability: Low, as trend structure is clearly positive.
🎯 Conclusion
Camurus shows in the Onvista chart a clean bullish overall picture:
🔮 5. what does this mean for you as an investor?
🟢 Bullish
⚪ Neutral
🔴 Bearish
Chart analysis created via Copilot, the rest was created without AI.
+ 2
Hello my dears,
Camurus has just arrived.
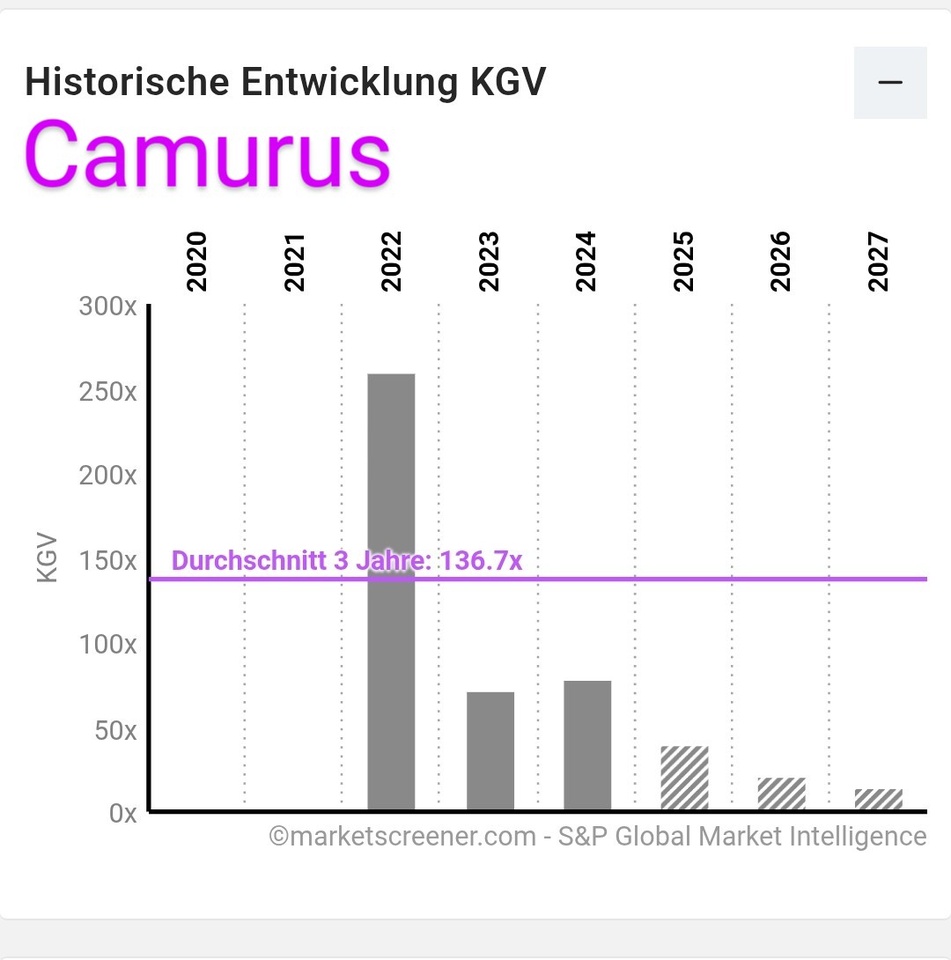
I was thrilled to see that profits have doubled. And that the already good EbiT margin can be increased by a further 10%. As a result, the P/E ratio has halved and the PEG is a good 0.50.
Today's breakout from the prolonged sideways movement has encouraged me to buy.
https://aktie.traderfox.com/visualizations/SE0007692850/EI/camurus-ab
What does Camurus do?
Camurus is a biopharmaceutical company based in Sweden. The company specializes in the development and marketing of pharmaceuticals based on proprietary formulation technologies.
Camurus focuses on the treatment of chronic diseases and addictions. The company's approach is to develop longer-acting drug formulations in order to improve patient compliance and reduce the number of doses.
Camurus offers a range of products in various therapeutic areas, including pain management, oncology and endocrinology. The company strives to provide solutions that improve patients' quality of life and optimize clinical outcomes.
On June 3, 2025, the Swedish biopharmaceutical company Camurus and the US pharmaceutical group Eli Lilly announced a comprehensive collaboration and license agreement. The aim of this partnership is the development and global commercialization of long-acting incretin therapeutics.
Camurus Q2 2025: Record sales and profit with expansion of the product portfolio/s
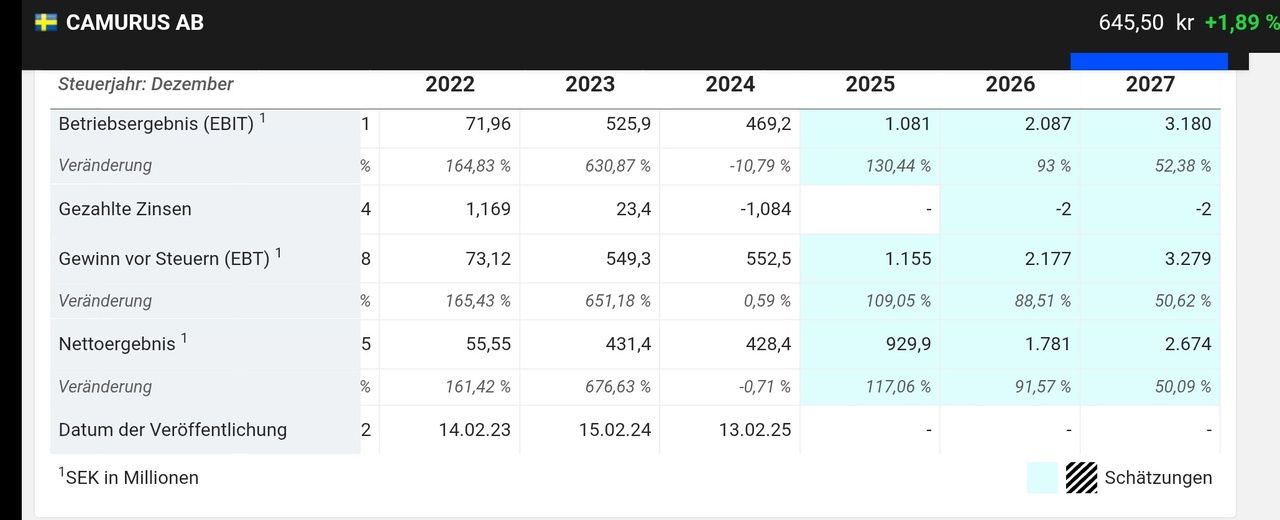
+ 3
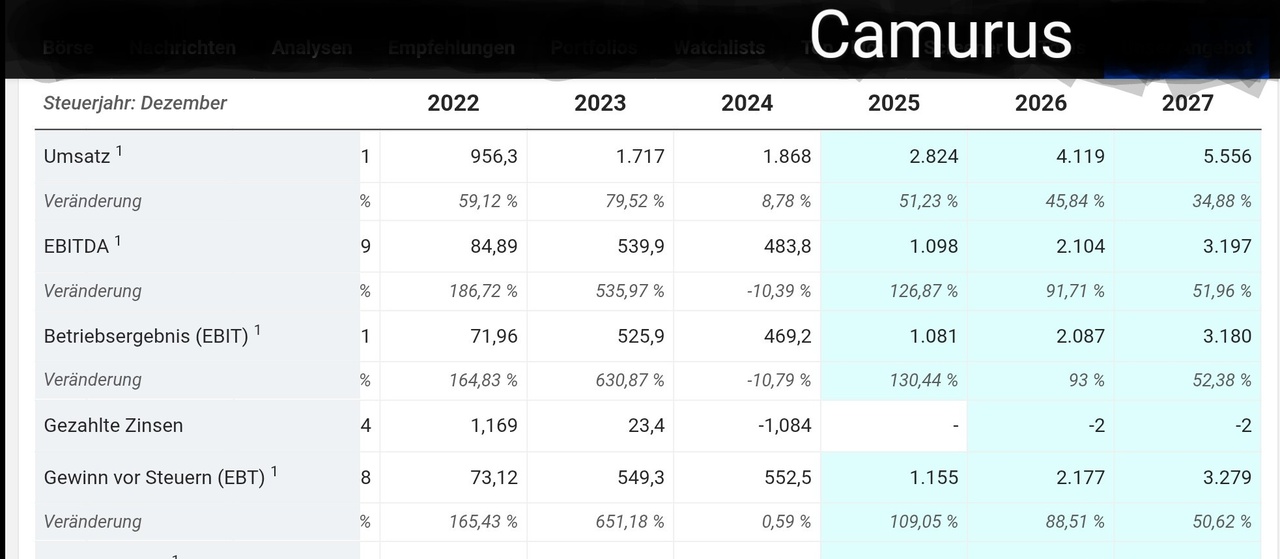

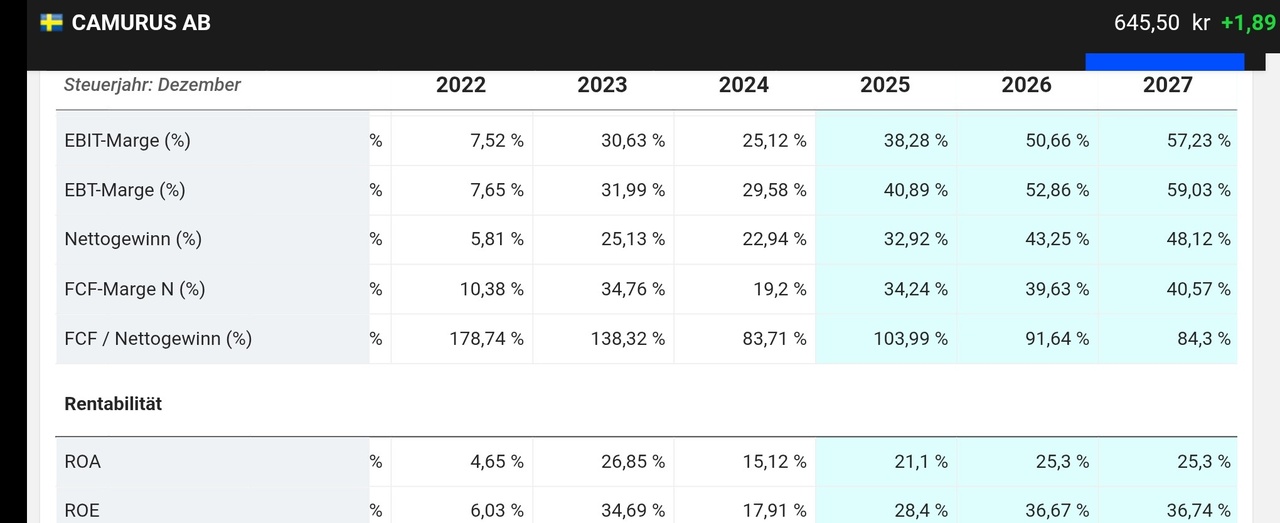
Camurus purchased: strong sales and profit growth, high margins, pipeline provides additional upside.
Many thanks to @Tenbagger2024 for your great ideas and inspiration.
Ladies and gentlemen, I remain invested in Camurus.
The two Scandinavian biotech companies Camurus and Gubra are pooling their expertise. An exclusive cooperation and license agreement has been signed with the aim of developing a long-acting therapeutic option for the treatment of hypoparathyroidism, an underactive parathyroid gland.
This research and development program combines Gubra's parathyroid hormone (PTH) analog, developed using its proprietary peptide discovery platform "streaMLine", with Camurus' FluidCrystal technology to enable prolonged, patient-friendly dosing, according to a press release.
"Given the promising initial development data, we look forward to this collaboration combining Gubra's strengths in drug discovery and preclinical expertise with Camurus' technology, late-stage development capabilities and commercialization expertise," said Markus Johnsson, Senior Vice President R&D at Camurus.
Under the terms of the agreement, Camurus will develop and commercialize the product, while Gubra has the option to co-finance the development of the product. Gubra will in turn receive staggered license fees based on the level of financial participation.
CONCLUSION
Gubra has partnered another asset from its development pipeline at a relatively early stage. This clearly speaks for the Danes' strong expertise in drug discovery. With Camurus, the company has gained an excellent partner from Lund, Sweden, which also has a highly interesting technology platform to offer. Both stocks continue to be excellent long-term portfolio additions for speculative investors.
$CAMX (-1,51%)
$NOVO B (-0,49%)
Hello my dears,
For those who are already disappointed with the Danish 🇩🇰 Novo. I would like to remind you once again of the Swedish 🇸🇪 Camurus.
Here, too, I remain invested. @Multibagger
The obesity market continues to be one of the hottest areas in the biopharma sector - not least due to the bidding war between Pfizer and Novo Nordisk for Metsera. Recently, the focus of development has shifted to other parameters in addition to absolute weight reduction over a certain period of time. The Swedish company Camurus could contribute to this.
The company, which has its roots in the Swedish University of Lund, has its innovative FluidCrystal technology. The Scandinavians have designed the platform's approach for a long-lasting release of active ingredients. This enables effective treatment over longer periods of time with a single injection.
Camurus has now demonstrated this potential with the administration of semaglutide (Novo Nordisk's active ingredient contained in Ozempic and Wegovy). The substance CAM2056 was designed in such a way that in the long term only one monthly administration of semaglutide is necessary. Otherwise, the much-cited "weight loss injection" must be administered weekly.
The study showed that semaglutide administered as two biweekly starting doses, followed by two monthly doses, was well tolerated until the highest starting dose was reached. Particularly exciting: the results of the phase 1b study show a weight reduction of 9.3 percent with CAM2056 compared to 5.2 percent with weekly semaglutide administered on day 85.
"We are very pleased with the Phase 1b data, which show that CAM2056 is well tolerated and produces a dose-dependent reduction in body weight and A1c that matches or exceeds that observed with weekly semaglutide," summarized Camurus CEO Fredrik Tiberg. "The study data suggest that CAM2056 enables rapid dose titration without compromising tolerability, while allowing convenient monthly dosing. Further evaluation of CAM2056 is planned in an upcoming Phase 2b study."
Conclusion
Camurus once again demonstrates the platform potential of its FluidCrystal technology. The Swedes are already working with Eli Lilly in this area, while Novo Nordisk is relying on the expertise of Danish company Ascendis Pharma. Irrespective of this, Camurus can help to extend dosing intervals and reduce the inconvenience of injections. In the opinion of the AKTIONÄR, the potential of the Swedes in this area is clearly underestimated. Courageous investors should buy (stop: 47 euros).
Principais criadores desta semana


