Can active management make sense?
Actively managed funds are such a thing, most do not beat their benchmark after costs. In addition, 95% of the return can be derived from the Fama-French 5-factor model.
If we define manager skill as the ability to exploit one or more of these factors better than the average investor, then it can make sense to buy into such management.
Is the Quantex team worth the money?
3.00 % front-end load
1.14 % management fee
1.50 % Ongoing charges
This has to be earned first.
The real problem is not that there are no above-average investors, but that they are only recognized after they have performed above average.
Whether it is easier to find good management or to learn the whole thing yourself probably differs greatly from person to person.
Here are a few points that, in my opinion, strongly suggest that Peter Frech and the Quantex team will be able to achieve above-average returns in the future:
1. outperformance despite headwinds
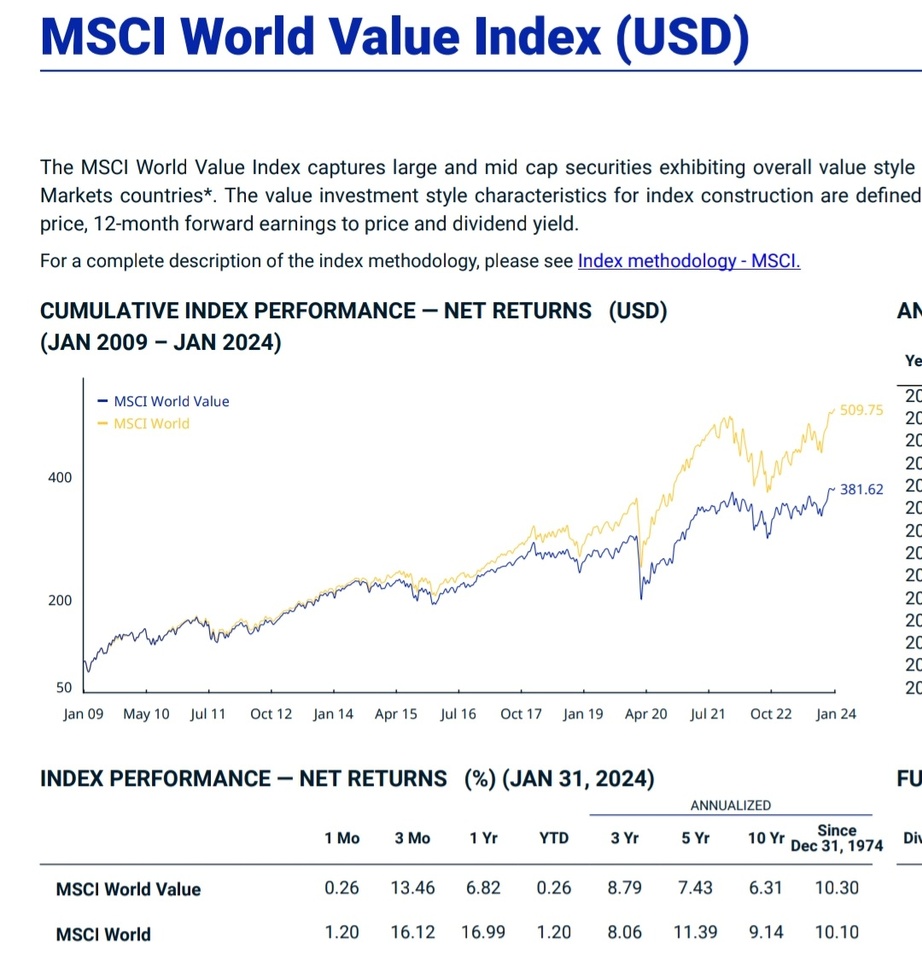
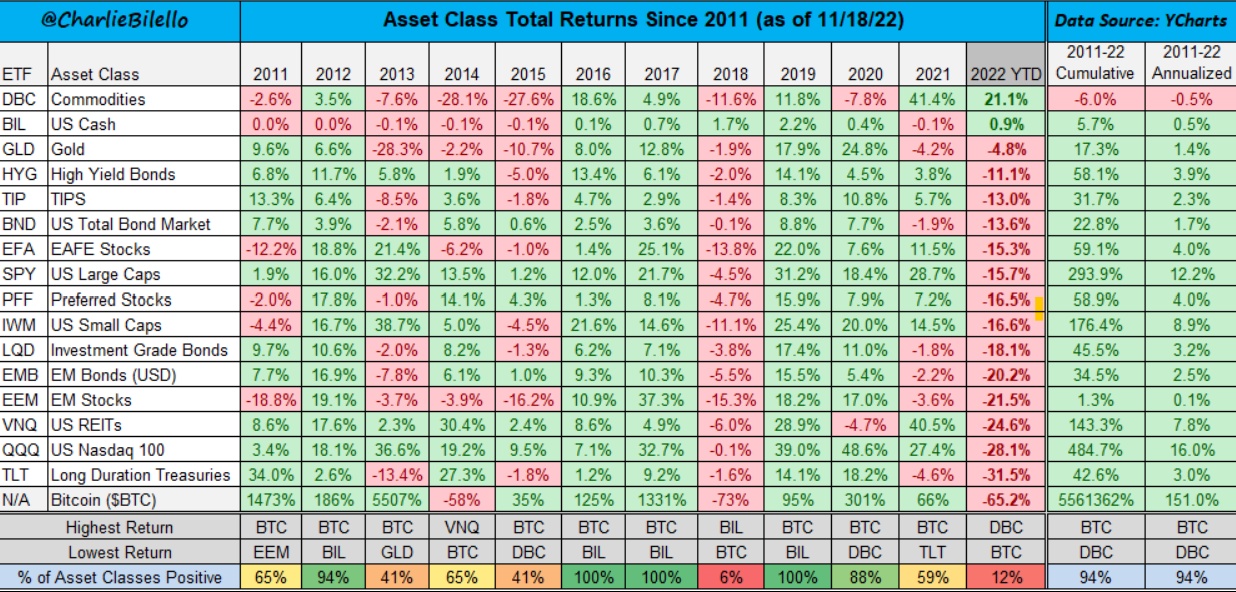
Since the fund was launched in 2008, market performance has been dominated by fast-growing tech companies and mega caps.
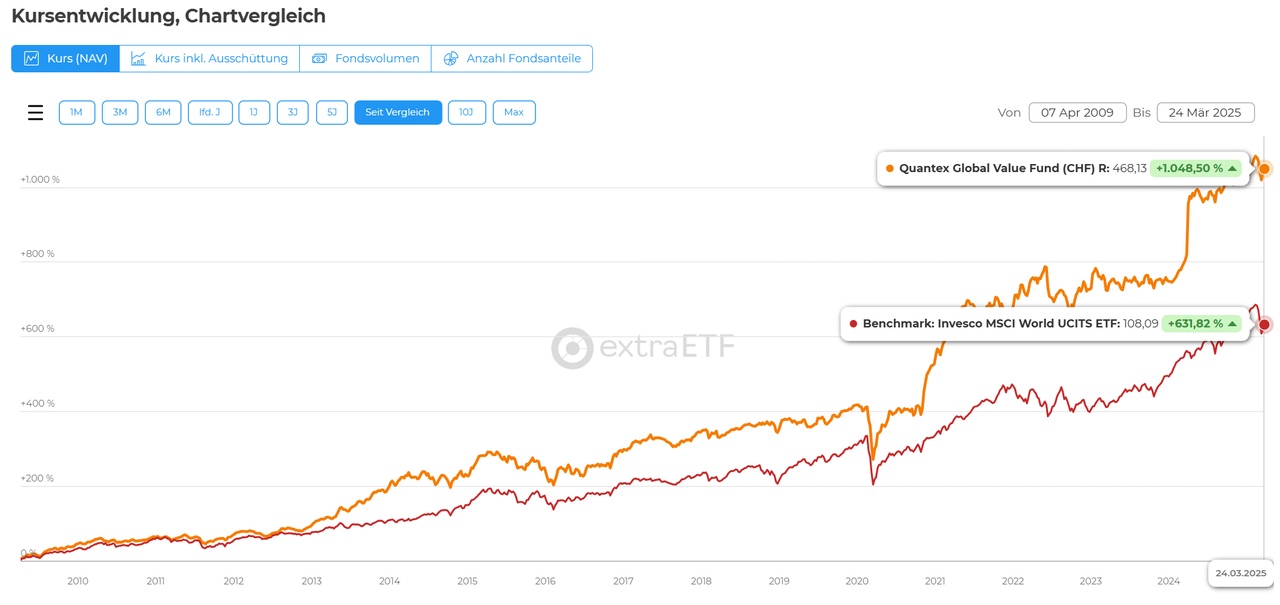
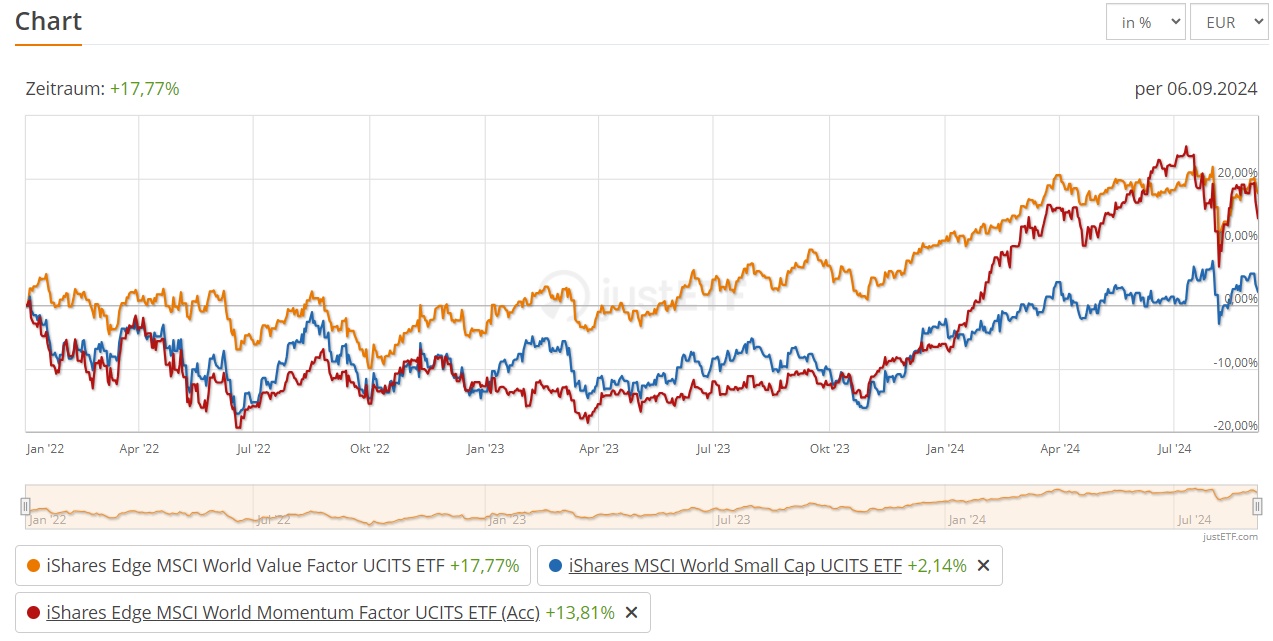
The MSCI World Value $IWVL (-0.2%) compared to the MSCI World $IWDA (-0.35%) has only generated just over half the return since its launch in 2014.
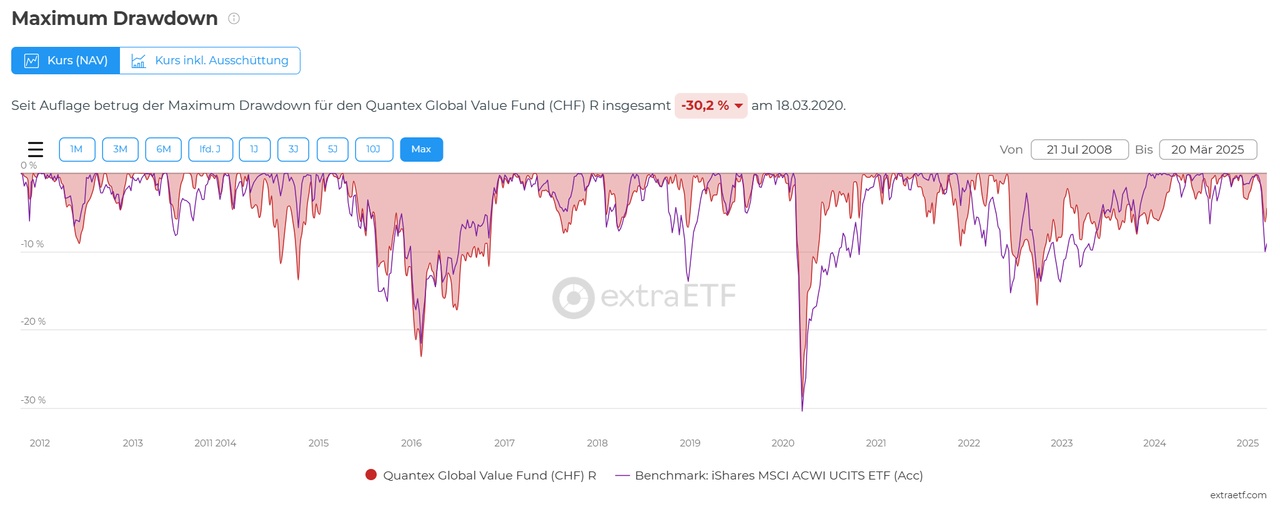
During this time, many value funds have been closed due to investor flight and minimum returns; the Quantex Global Value $SLCH6Z / $QGVU has not only beaten its benchmark (Bloomberg World Net Return) in the same period. It also outperformed the MSCI World.
2. professionals and not clowns
Quantex does not need to jump around on Instamm or be a guest twice a month on every financial YouTube channel in the DACH region.
It is primarily concerned with the funds and not with marketing.
3. profitable bears
Despite the outstanding performance, the fund management is extremely bearish. The risks are always seen first and acquisitions are usually made at such low prices that there is also a margin of safety.
Anti-cyclical companies from sectors and countries that have been overlooked or unjustly punished by the market are bought.
This strategy, based on the early Warren Buffett, has been implemented in a disciplined manner for almost 17 years now.
4. know your limits
Due to its success, the fund has reached a size at which it is capital constrained. The fund would have become too large to implement the desired strategy.
The same thing happened to Warren Buffett, who was no longer able to implement his value strategy uncompromisingly, as a result of which the returns also became lower.
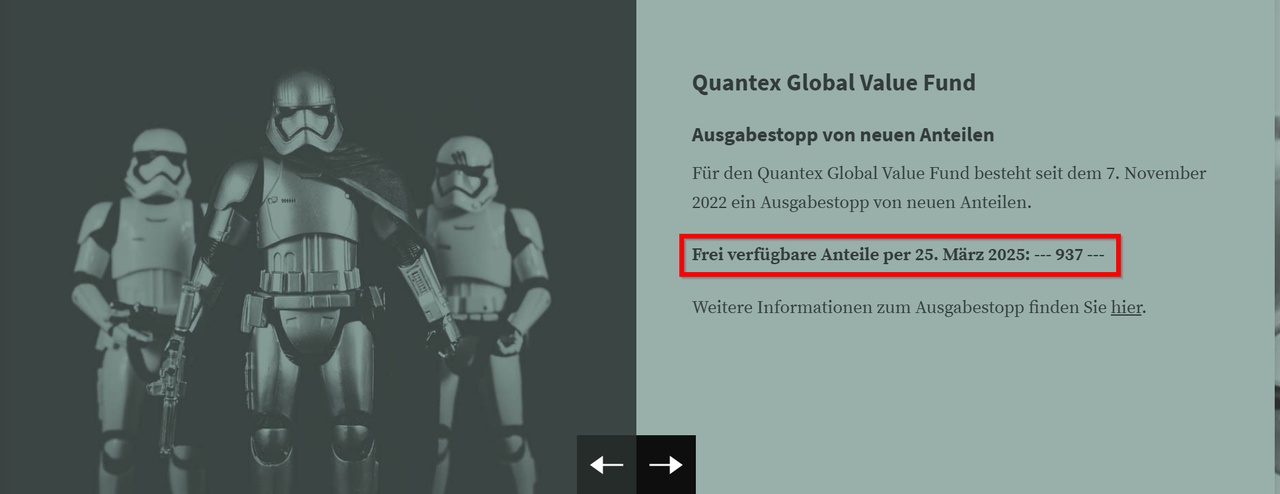
To prevent this from happening to Quantex Global Value, a freeze on the issue of new units has been in place since November 2022.
In other words, the interests of investors have been placed above maximizing the company's own profits.
Nevertheless, it is still possible to invest in the fund: If fund units are redeemed or sold, subscriptions are possible to the same extent. All subscriptions are processed on a first come, first served basis. There are no partial executions and individual subscriptions are either accepted in full or rejected.
rejected.
Just have a look at the Swiss Exchange (SIX), you will usually still find some there.
On the https://www.quantex.ch/ next to the stormtroopers you can also see the available shares. 😅
Criticism:
What I would also like to mention is that this fund is not for people for whom ESG criteria are important. Quantex invests completely amorally.
The portfolio is (as of today) heavily overweighted in fossil fuels, tobacco, alcohol and mining (i.e. the wet dream of @TaxesAreTheft )
You can never rule out the possibility that the management was simply lucky and the returns are worse going forward, which is why such a fund can only ever be an addition.
Conclusion:
In my opinion, the Quanex team has proven over the past 17 years that it is able to find undervalued stocks, sell them at fair value and do so at a similar risk to the market as a whole.
The counter-cyclical nature of the strategy makes the fund an excellent addition to portfolios that are dominated by world ETFs or have similar sectors and country weightings to them.
https://www.quantex.ch/de/anlagefonds/quantex-global-value-fund/chf-r/
If you want to get a first impression of the management, I recommend the webinar recordings and investor letters on the Quantex website.


