

Hi, does anyone have information why some ARK Etfs, e.g. the $ARKK (-2,4 %) can be sold at Scalable but not bought? Thanks for info

ARK Innovation ETF
ETP
ETP
Ticker: ARKK
ARKK
Price
Debate sobre ARKK
Puestos
15
1Año·
HennRes | Is the correction over?
1. economic fundamentals
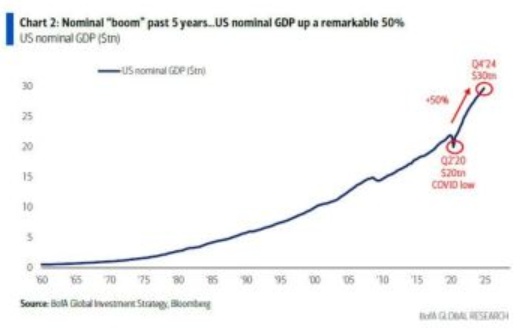
As shown in Chart 2 the nominale US-Bruttoinlandsprodukt has risen by around 50% in the last five years, from around USD 20 trillion to USD 30 trillion. This increase was largely driven by expansive fiscal policy measures, strong consumption and inflationary effects. However, current indications suggest that political demands for lower inflation and reduced government spending could weaken this "boom". An end to the pace of nominal growth could limit long-term peaks in government bond yields, the US dollar and speculative asset classes.
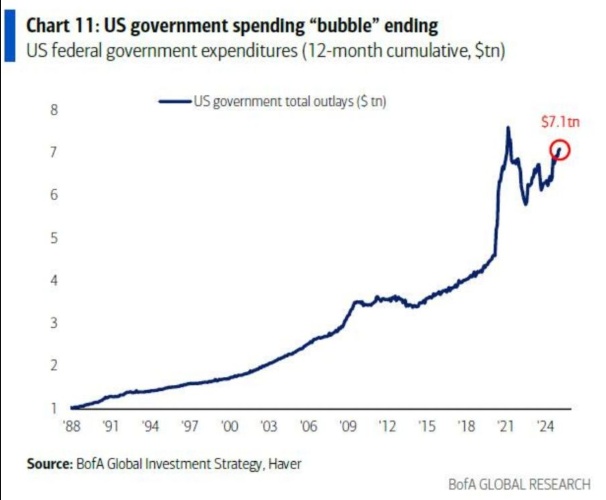
Government spending and budget structure (Chart 11 & Table 1)
Chart 11 shows that cumulative US federal spending over the last twelve months amounted to USD 7.1 trillion. Compared to European countries, it is noticeable that the US invests a significantly lower proportion of its budget in education (4%), while spending on healthcare (27%) and debt servicing (13%) is prioritized. European countries such as Germany and France, on the other hand, dedicate larger budget shares to social areas such as education (13% and 11% respectively) and pensions (24% and 25% respectively).
2. technical market signals
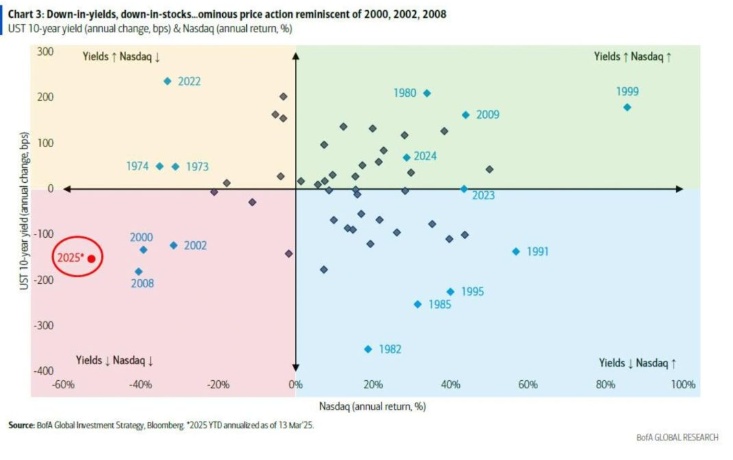
Simultaneous decline in bond yields and equities (Chart 3)
Chart 3 illustrates the current pattern of parallel declines in 10-year US government bond yields and equities. $NDAQ (+1,4 %) . Such down-in-yields/down-in-stocks phases have historically occurred in crisis years such as 2000, 2002 and 2008. A key indicator for observation is the XBD-Broker-Dealer-IndexAs broker dealers are closely linked to the financial markets, the index is an important indicator of the health of the fin sector and general market sentiment.
Correction of speculative "Bro Bubble" stocks (Chart 4)
Like Chart 4 shows, one particular group, including$NVDA (-2,17 %) , $TSLA (-3,99 %)
$META (-6,98 %)
$ARKK (-2,4 %) , has fallen by around 25% since January 20, 2024. These stocks had previously gained 55% between the US election and the inauguration in January. The current decline indicates a reduction in risk, i.e. a switch to defensive sectors.
Capital flows and buy-the-dip mentality (Chart 14)
Despite the market volatility, Bank of America retail clients recorded the third-largest weekly inflows into equities in March 2024 since records began (Chart 14). This shows that many investors continue to focus on short-term recoveries.
3. sentiment and position indicators
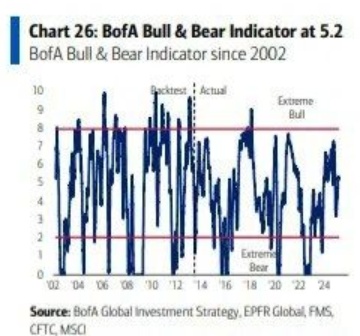
Mixed sentiment in the Bull & Bear indicator (Chart 25 & 26)
An aggregated sentiment indicator (Chart 25 & 26), which takes into account factors such as hedge fund positioning, credit market techniques and capital flows, is currently in neutral territory (5.2 out of 10). A fall in the indicator to 2.0 would historically trigger a buy signal.
Cash allocation and high-yield bond spreads
The average cash allocation in portfolios recently rose to 4%, which is close to the threshold of 4.1% (Chart 25). At the same time, the risk premiums for US high-yield bonds (HY-Spreads) are at 340 basis points. A rise to 400 basis points could mark a low point. HY spreads measure the difference between the yields on high-yield bonds (junk bonds) and the yields on safe government bonds (US Treasuries). Narrower spreads (lower values) indicate a higher risk appetite on the part of investors, while wider spreads (higher values) indicate increased risk aversion. If the cash allocation rises above 4.1%, this could signal that the correction has bottomed out and a recovery is imminent.
4. historical comparisons and scenarios
Political uncertainty and real yields (Chart 5 & 13)
The Chart 5 (NFIB-Unsicherheitsindex) shows that small US companies are increasingly expressing concerns about tax and regulatory policy. The NFIB Uncertainty Index measures the uncertainty of small and medium-sized companies in the USA with regard to economic and political factors. A rise in the index indicates that companies are increasingly concerned about future developments. At the same time Chart 13 illustrates the inverse correlation between US real yields (10-year) and gold prices, which positions gold as a hedge against falling real interest rates. When real yields fall (due to lower nominal yields or higher inflation), gold becomes more attractive. When real yields fall, gold prices tend to rise as investors look for safe investments.
Summary:
The current market correction shows characteristics of a typical technical correction, but is not yet complete. Decisive signals for an end would be
An increase in the cash allocation to over 4.1% (Chart 25),
HY spreads of 400 basis points (Chart 3),
A stabilization of the XBD broker-dealer index above 750 points (Chart 4).
Historical comparisons suggest that the $SPY (-0,71 %) reaches a potential support zone at around 5,300 points. Political decisions, particularly on monetary and fiscal policy, remain a critical factor
+ 5
5959
8 Comentarios
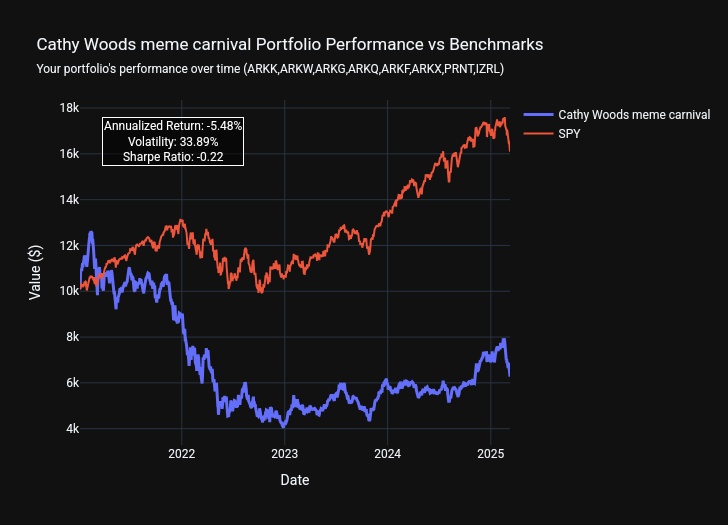
Some graphics are a bit blurry, no idea why
•
55
•


2Año·
🧩 Investing with Integrity - Investieren mit Integrität🧩
I’m passionate about finding Halal investments that adhere to Islamic finance principles, avoiding sectors like alcohol, gambling, and interest-based banking, which are considered unethical. 🚫🍷🎲💵
It’s not just about avoiding certain industries; it's about supporting growth in areas aligned with ethical values. Here are some standout ETFs that align with these principles and have outperformed the SPDR S&P 500 ETF $SPY (-0,71 %) over the past 5 years:
- ARK Innovation ETF $ARKK (-2,4 %) +160%
- Global X Lithium & Battery Tech ETF $LIT (-1,69 %) : +180%
- Global X Cloud Computing ETF $CLOU +140%
- Invesco QQQ Trust $QQQ (-1,73 %) : +130% / not 100% compliant
- Vanguard Information Technology ETF $VGT +130%
- Global X Genomics & Biotechnology ETF $GNOM +120%
- VanEck Vectors Semiconductor ETF $SMH (-2,79 %) +130%
- iShares U.S. Technology ETF $$IYW (-1,33 %) +130%
- First Trust Dow Jones Internet ETF $FDN +140%
- ARK Next Generation Internet ETF $ARKW (-1,72 %) +150%
These funds focus on technology, clean energy, and innovation—sectors that contribute positively to society. 🌍💡
📈 does ethical investing matter to you?
📈Spielt ethisches Investieren für Dich eine Rolle?
#Investing
#HalalInvesting
#EthicalInvesting
#Finance
#Technology
#CleanEnergy
#Innovation
$NVDA (-2,17 %)
$VAR1
$MC (-1,55 %)
$O (+0,87 %)
$MCD (+1,19 %)
$RHM (+0,78 %)
$PYPL (-0,27 %)
$AMZN (-1,67 %)
1111
7 Comentarios

mMn. for the most part bullshit.
It is forbidden to be involved in interest transactions, then again there is a softening of the rule up to what degree the companies may be "haram".
If you really set it up according to their rule, none of the companies or ETF's would be investable for Muslims.
The only winner here is $BLK with its $ISWD and 0.30% TER
•
55
•2Año·
Cathie Wood from Ark Investment Management ($ARKK (-2,4 %) ) has reportedly acquired a stake in Elon Musk's
AI startup
xAI acquired. This investment accounts for approx. 2% of the holdings of the Ark Venture Fund of the Ark Venture Fund. xAI has recently raised 6 billion US dollars in a Series B financing round raising a valuation of 24 billion US dollars achieved.
Previously, Ark had invested in OpenAI which accounted for approx. 4% and in Anthropicwhich accounts for approx. 5% of its asset allocation.

99
2Año·
Cathie Wood from Ark Invest ($ARKK (-2,4 %) )
has today 235k
Tesla ($TSLA (-3,99 %) ) shares today. Only last week it bought around 79k shares.


2Año·
Cathie Wood from Ark Invest ($ARKK (-2,4 %) ) has sold 79k shares of Tesla ($TSLA (-3,99 %) ) shares in Tesla.
2Año·
Bernstein ($STESX ) has raised the price target for Tesla ($TSLA (-3,99 %) ) from 150 to US dollars and rates it "underperform", citing declining demand as the reason, which is due to Europe and China.
Bernstein expects growth to be weak and growth is even being called into question for the coming year.
Bernstein has also lowered its estimates for deliveries in the first quarter and for the year as a whole.



4Año·
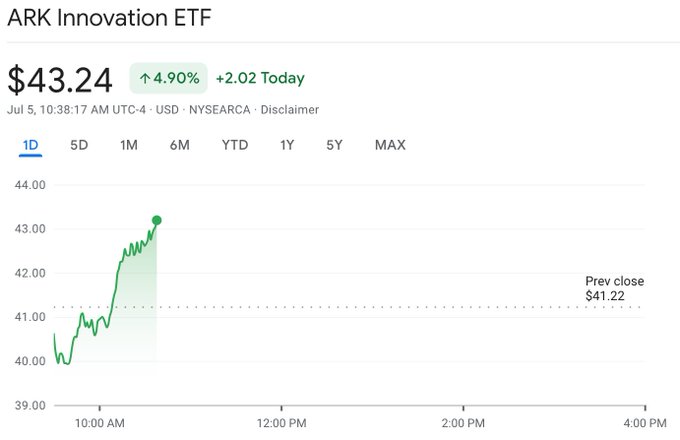
I hardly believe it - Cathie Woods Ark Innovation ETF made 5% plus today 📈
According to classic chart analysis, the breakout and retest has been successful. And it looks like a double bottom formation with a high volume candle in May, indicating significant buying pressure (not from retailers, but from institutions)....
Do you think Bottom is in or is this just a fake out? 👀
33
7 Comentarios
High short rate on unprofitable tech stocks -> shorts cover -> rally -> sell-off -> repeat or not?
•
55
•



4Año·
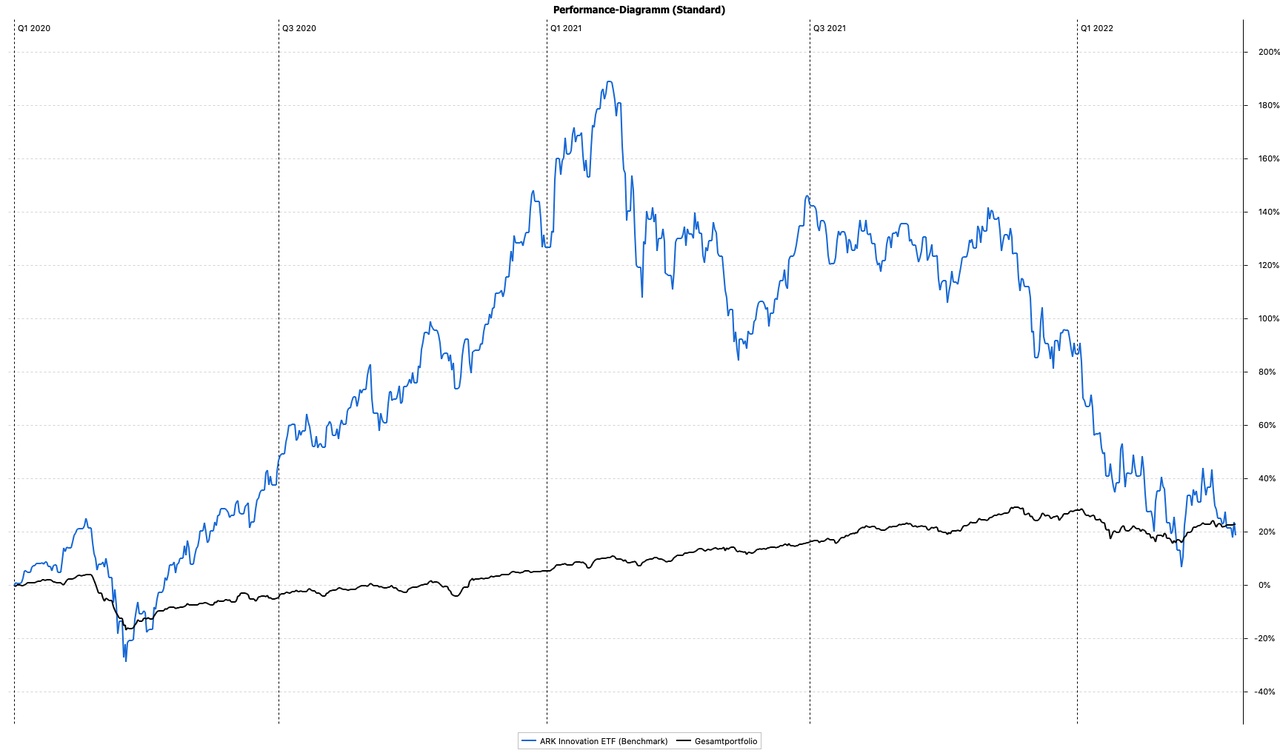
Where to buy SARK?
Source: finfo Newsletter $ARKK (-2,4 %)

8 Comentarios

4Año
ISIN is I think US19423L5654, you can trade via New York Stock 😅
•
33
•