$MMK (-0.83%) Sold just a month ago, but today the chart was too tempting to re-enter. A little home bias is a must 😂
Besides $MMK (-0.83%) also have $UBER (+0.59%) and $OUST have found their way back into my trading portfolio 😁

Posts
16$MMK (-0.83%) Sold just a month ago, but today the chart was too tempting to re-enter. A little home bias is a must 😂
Besides $MMK (-0.83%) also have $UBER (+0.59%) and $OUST have found their way back into my trading portfolio 😁
$ADBE (+1.12%) will be in my trading portfolio for a few days. $MMK (-0.83%) and $VER (+2.68%) were kicked out this evening, but a first tranche of Adobe will be added to the portfolio. Quite tightly hedged with speculation on a return to VWAP and above.
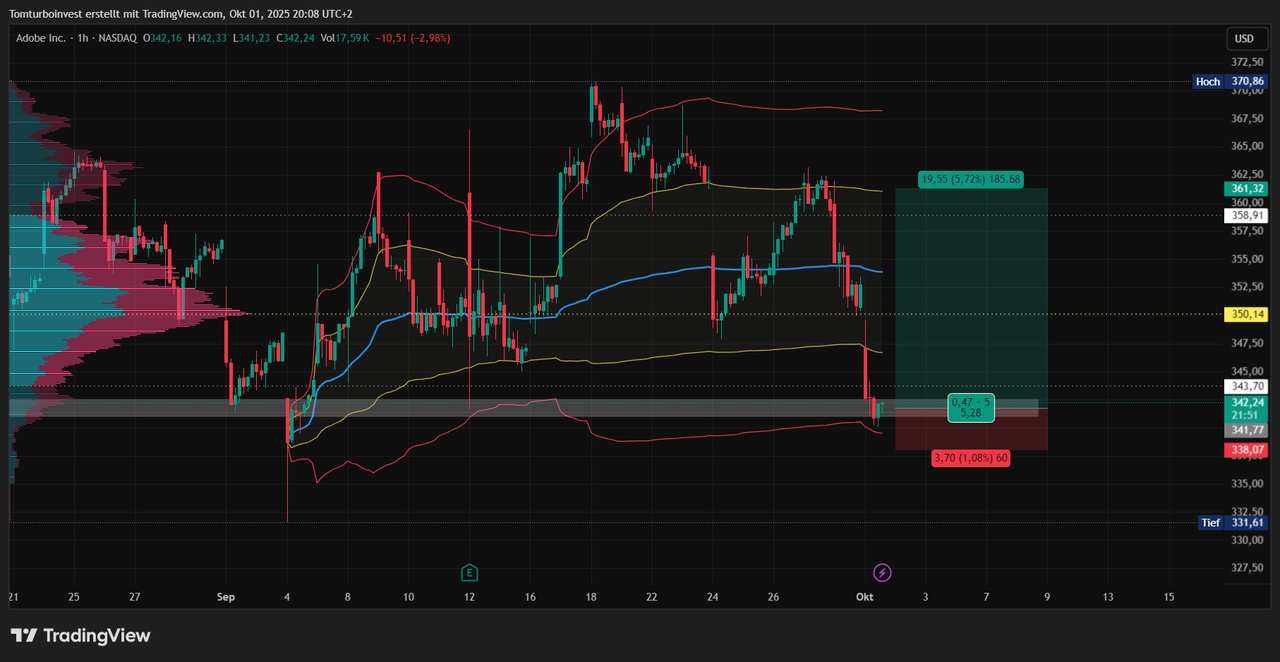

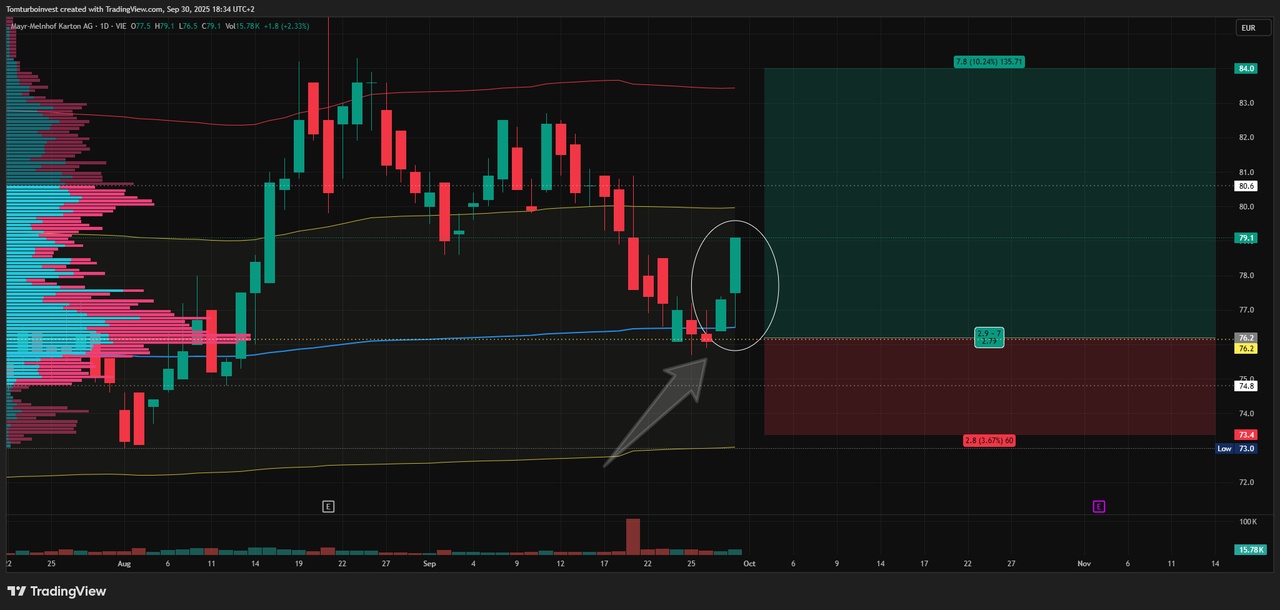
$MMK (-0.83%) As expected, the support at the VWAP has held - but but beware, this is always only about an increased probability - Nothing is fixed, and certainly not when trading!
But that's what it's all about, minimizing risk through increased probabilities. The SL is set just below the entry price, so the risk of this trade is almost eliminated.
Nice to see 2 "OUTSIDE BARS", i.e. 2 candles whose bodies are completely outside the previous candles. This shows strong buying interest, such strong trends often last 2-3 days. Let's see, maybe tomorrow there will be the first profit taking (TP1)
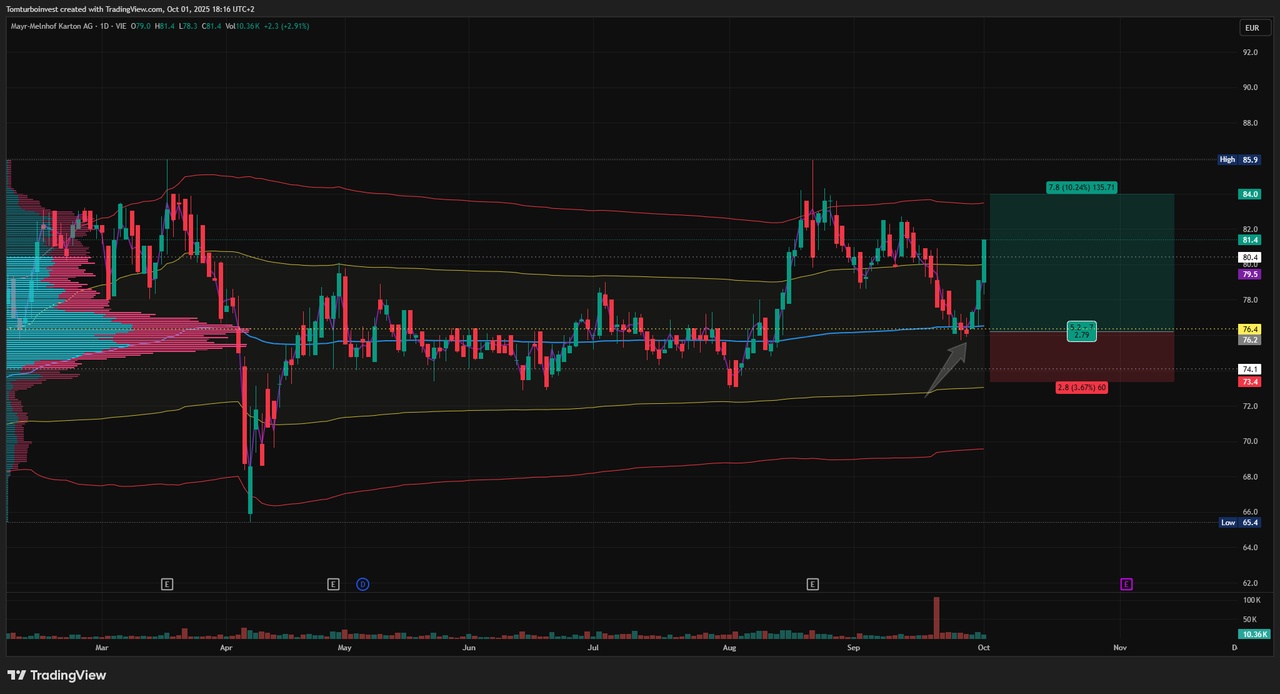
Edit 01.10.2025 Day5: After 3 days in a row with a strong rise, profits are hedged 😉
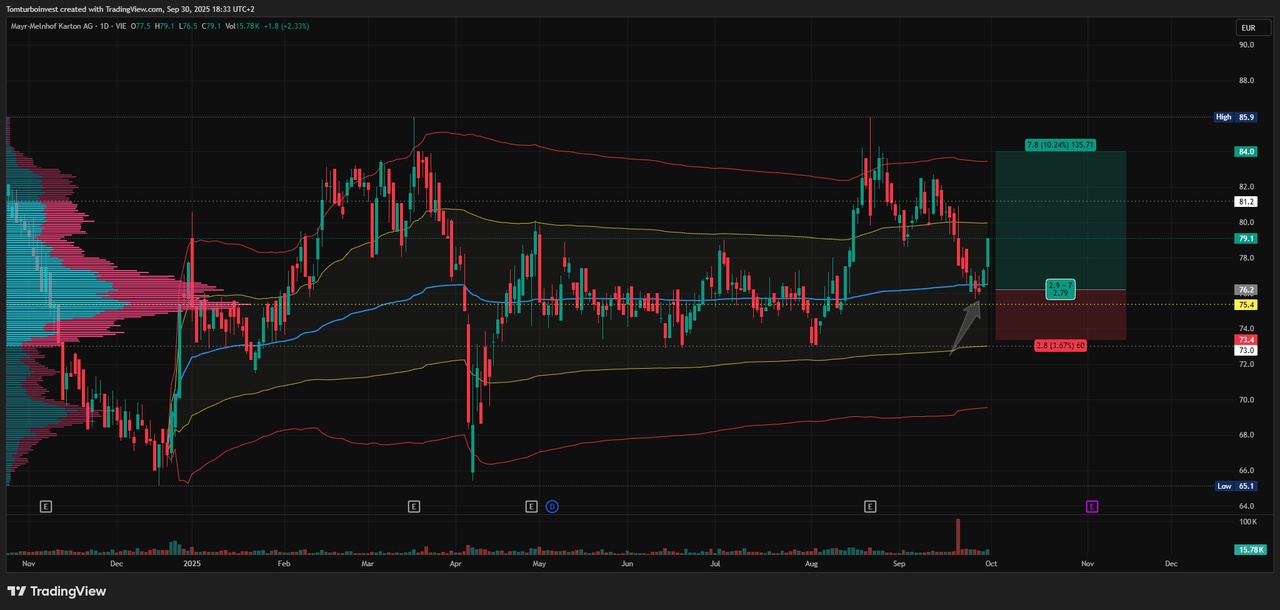
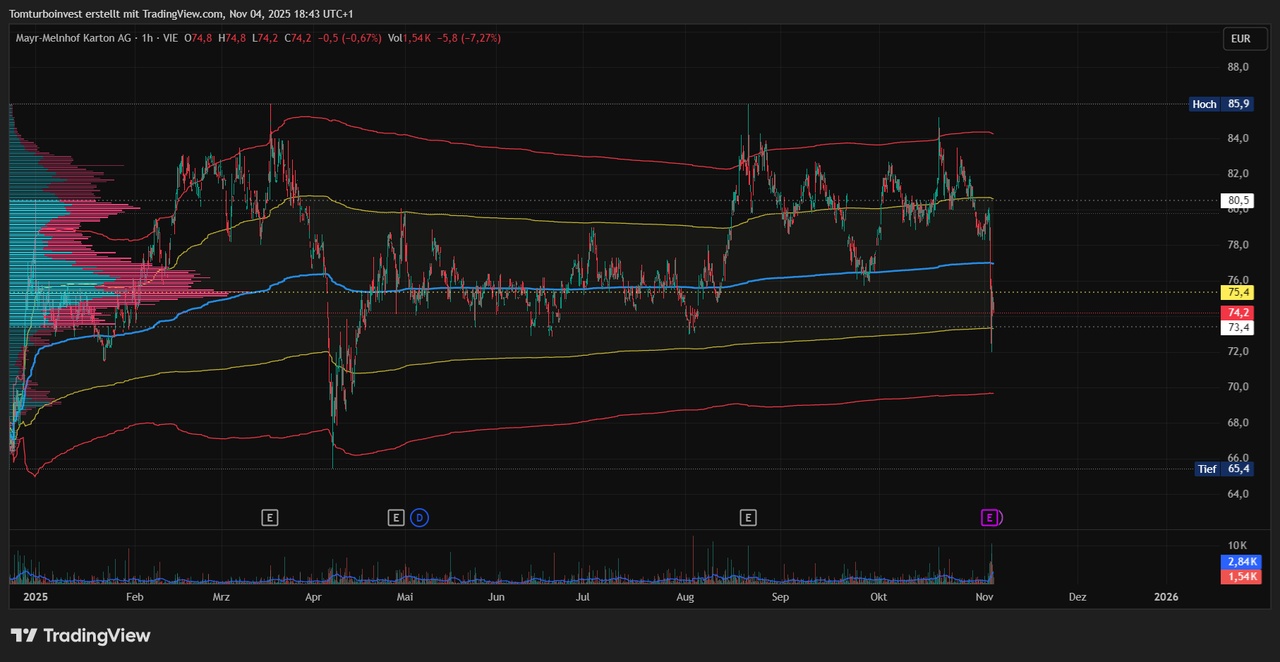
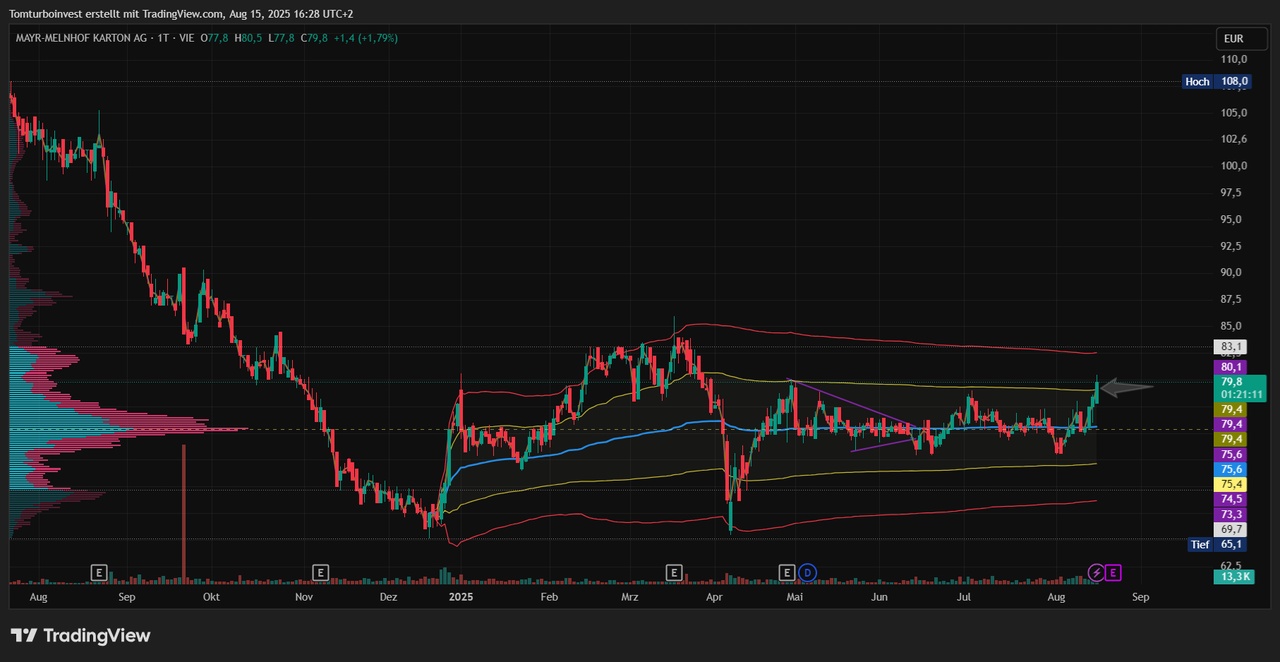
$MMK (-0.83%) I closed my swing trade position a good month ago. Today Mayr Melnhof approached the VWAP again, which was just right at the close of trading and I opened another position.
Certainly not a doubler or tenbagger as you can often read here these days, but a TP1 at +5% and TP at 10% fits well into my system 😉
The semi-annual review of the Austrian indices by the Index Committee results in a change in the ATX composition.
STRABAG SE $STR (-1.01%) and PORR AG $POS (-2.1%) will be newly included in the leading Austrian index, replacing Telekom Austria AG $TKA (+0%) and Mayr-Melnhof Karton AG $MMK (-0.83%) .
The composition of the ATX is based on two key criteria: the average daily turnover of a share on the stock exchange (liquidity) and the freely tradable share of the company on the market (free float capitalization).
https://www.wienerborse.at/news/wiener-boerse-news/strabag-porr-atx-092025/

$MMK (-0.83%) Patience was at an end today, MMK is not really gaining momentum. Whether the current global situation with tariffs and the like will increase the volume of cardboard packaging in the short term 🙄
At least the upper edge of the VWAP was in - every little helps 🤷♂️
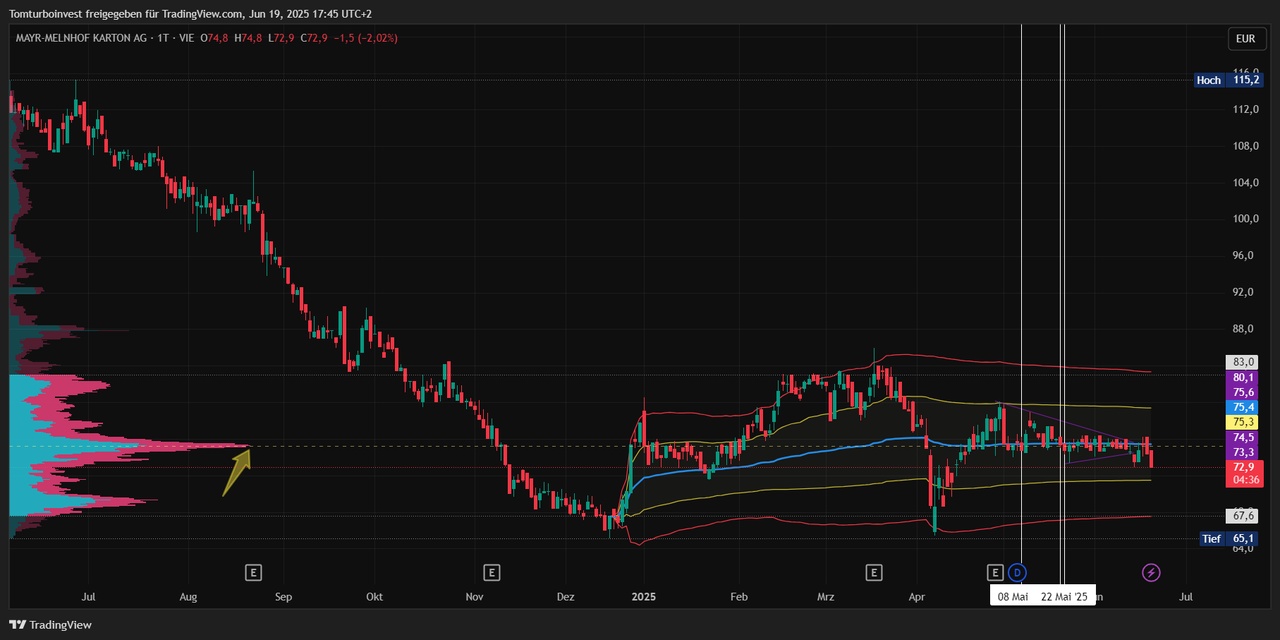
$MMK (-0.83%) Well, it's still "swinging" 🤪 Sometimes patience is the order of the day. In the course of May, I got in with 3 tranches (May 8, 21 and 22) around the VWAP. Not much has happened since then. The share price is still "orbiting" around the VWAP, which has been almost exactly at the volume high (POC) since April.
The MMK share price has been hovering around the VWAP since the beginning of 2025 and has been unable to break out of the deviation bands either upwards or downwards. The "egg" is getting tighter and tighter, but MMK does not really want to make up its mind. Let's see, time will tell 😁
The position is still being held - it is currently down slightly at -2.x%, but everything is still within the scope of risk management.

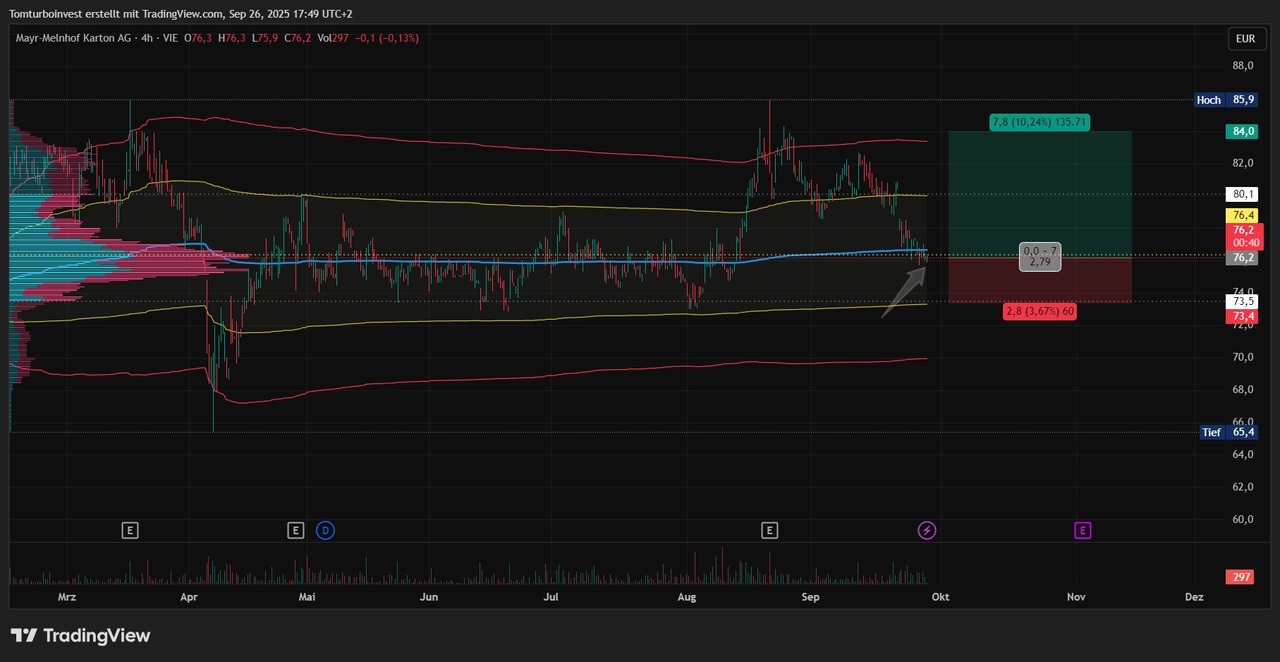
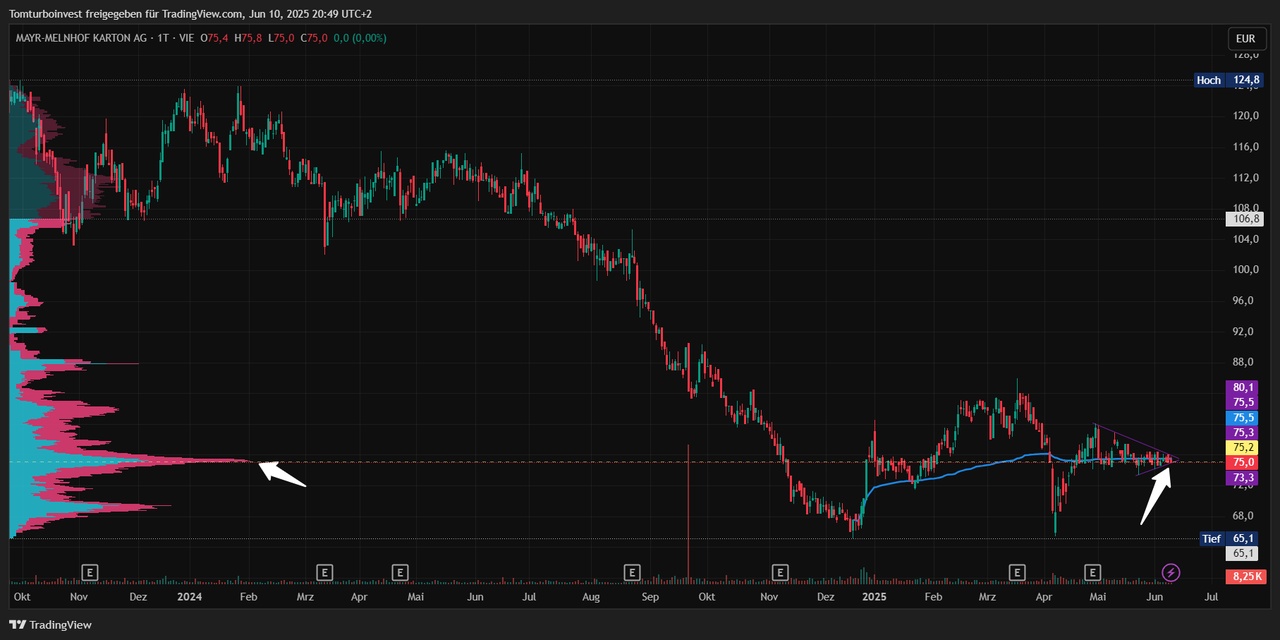
$MMK (-0.83%) is still stuck on the VWAP & POC, but the vola around the VWAP is getting smaller and smaller, let's see in which direction it will break out. Sometimes it takes a little patience. The price is still hovering around my entry at €75.31
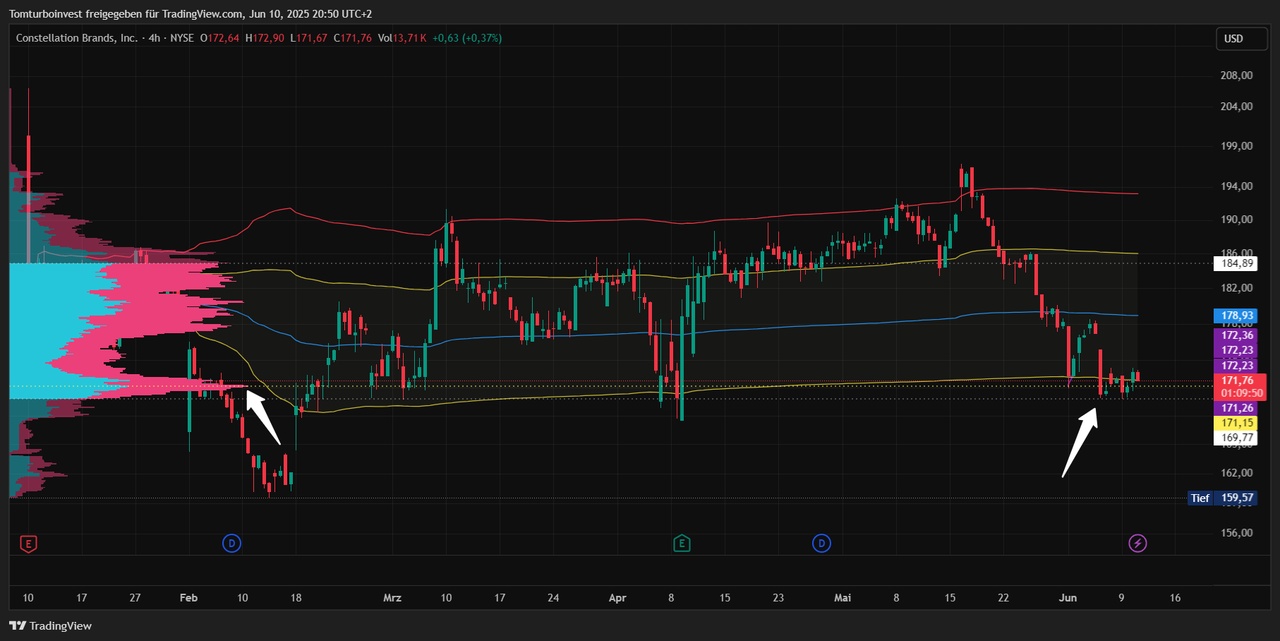
With $STZ (+0%) a similar picture, the price is also still at the POC and at the lower edge of the deviation1 of the VWAP.
@Multibagger Are you still in with your ticket, or has the dip washed you out below the edge?
My position stands at -3%, but that is still well within my risk. The first attempt to move away from the edge failed, but it still offers good support. I'll sit this out for a while 😅
Well, and then there's $UBER (+0.59%)
After trading Uber in the VWAP range several times over the last few months, I cautiously re-entered after the 2nd breakout from the range. But then it fell back further than I had expected. But I'm staying in for the time being - my -5% position isn't hurting me yet. It will be interesting to see how the next few days develop.
Conclusion: 3 current trades, one around 0%, two slightly in the red - nevertheless I have confidence in the setup around the VWAP. I'll keep you posted.

As always, first the link to the first post, where you will also find the links to all the other parts https://getqu.in/cbIOkg/
Today there are a few more details on the indicators from part 3 https://getqu.in/9XGYtO/
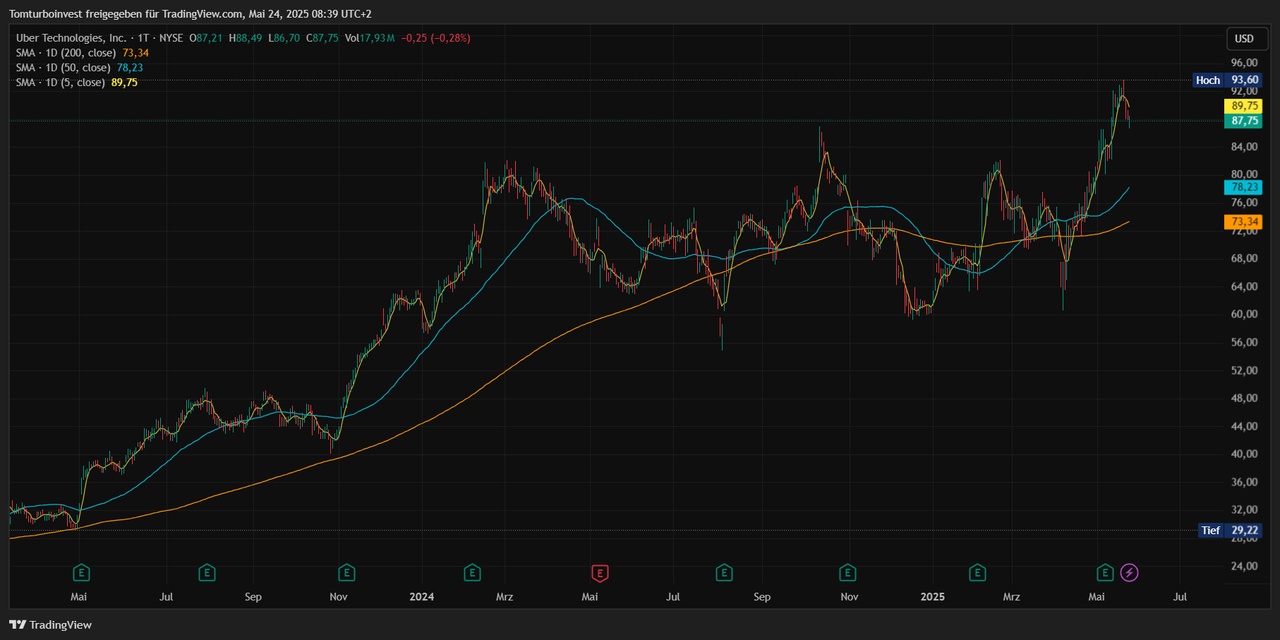
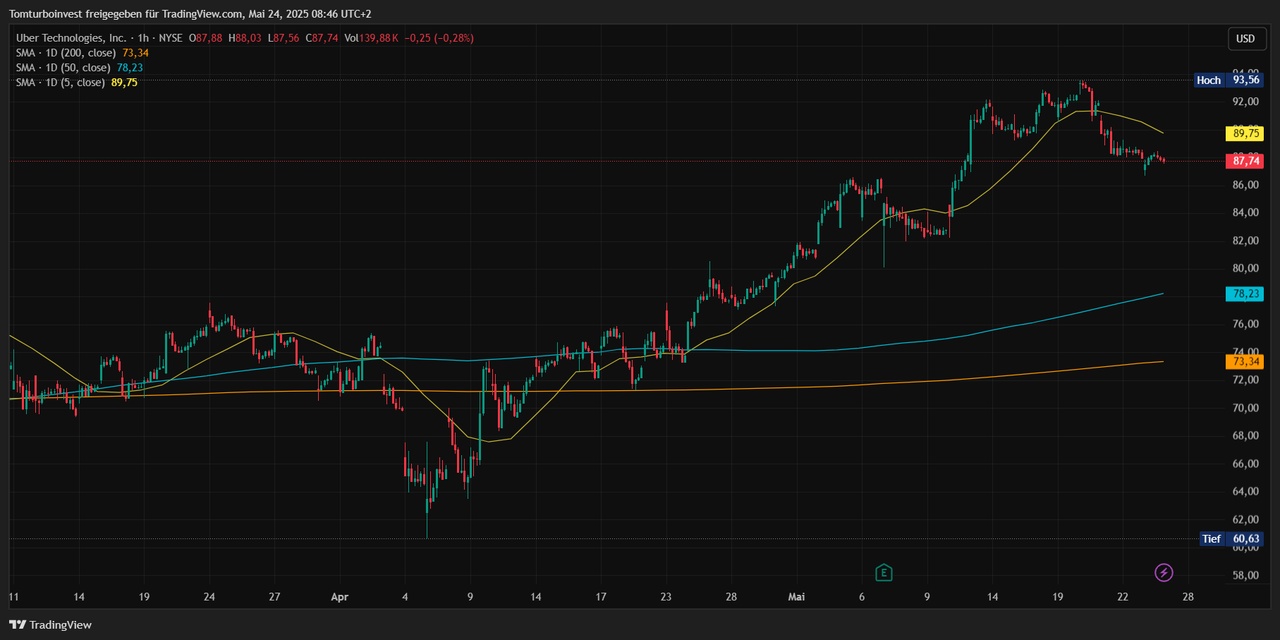
As described in part 3, I start my analysis with the SMA 200 / 50 / 5 daysto get an overview of the trend.
Example $UBER (+0.59%)
For me, an important setting for the SMA is that I always use the SMA regardless of my chart setting always on a daily basis. daily basis. This means that even if I have set the chart to weekly or 4h, it always shows me the SMA on a daily basis.
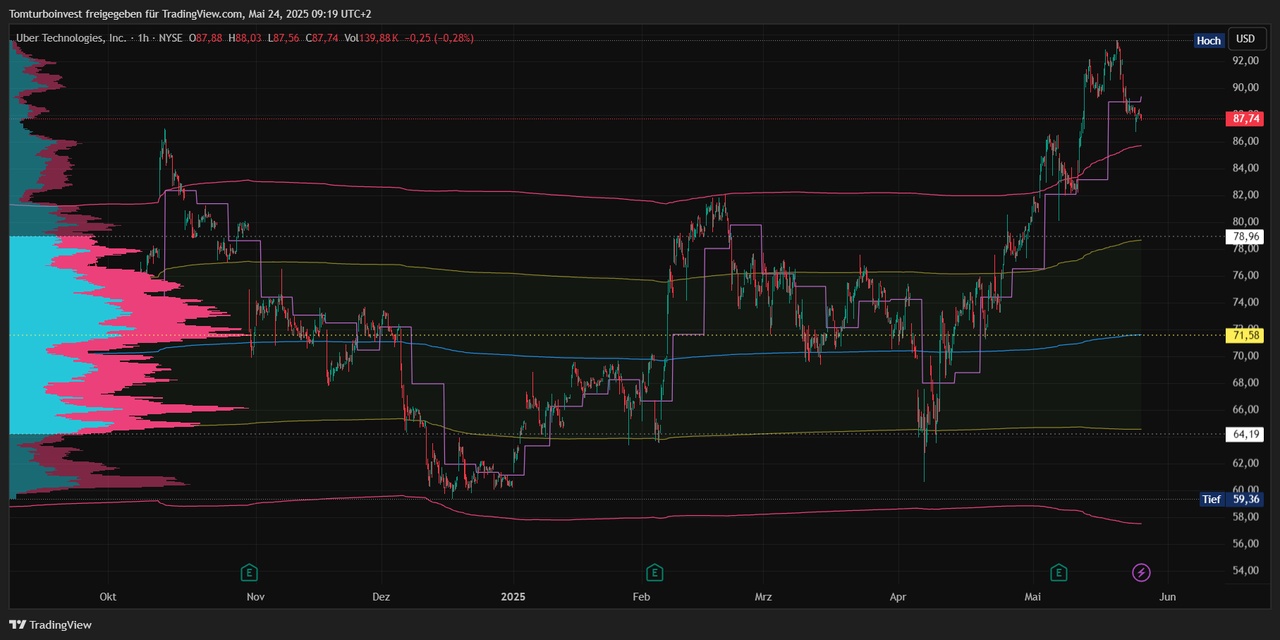
Example $UBER (+0.59%) 1h hour chart - but the SMA are still on a daily basis, not like the default setting, which always refers to the chart - then the SMAs would be calculated on a 200 / 50 / 5 hour basis!
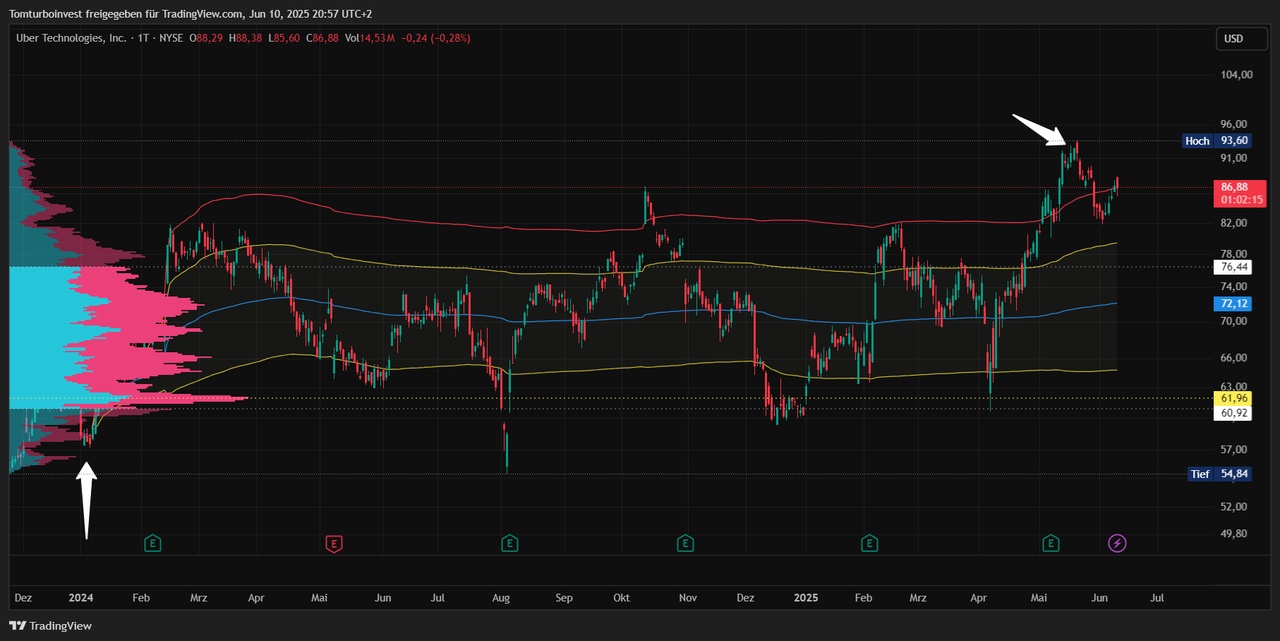
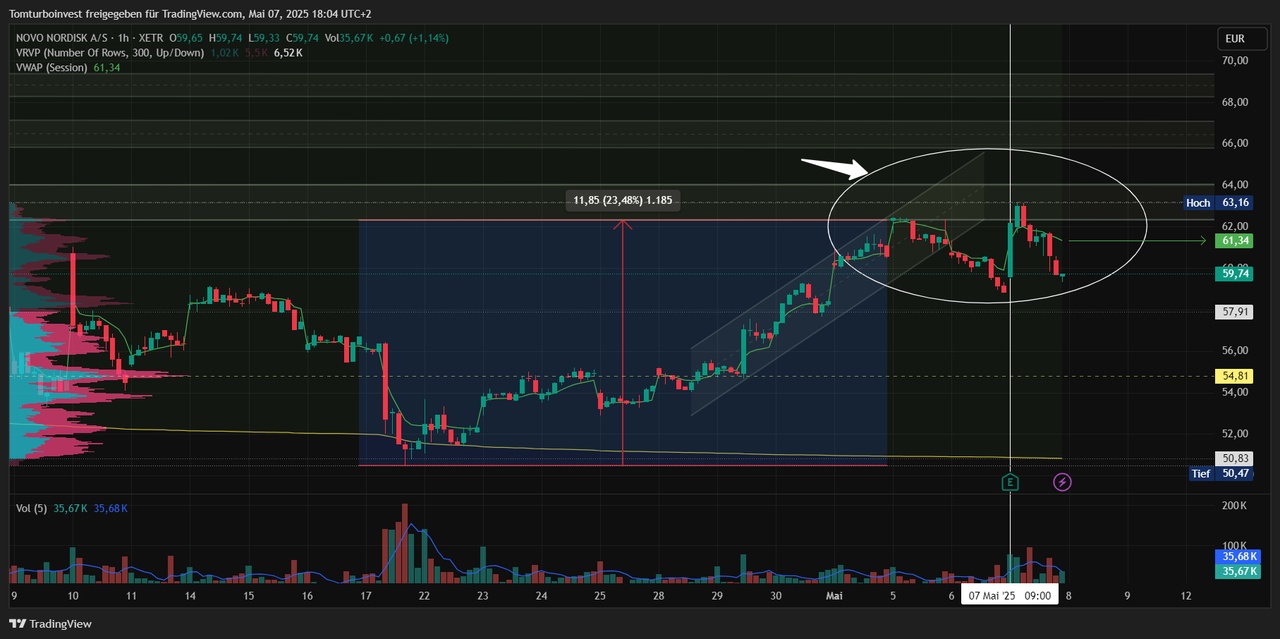
Next, I'll get the VRVP to see the volumes. I have set the chart to the range since Uber has been in an overarching sideways phase.
I can see the price area with the highest volume and the distribution where 68% of the volume has taken place.
My VRVP settings are as follows, I adjust the line size depending on the visible range - the larger the range, the larger the number of lines.
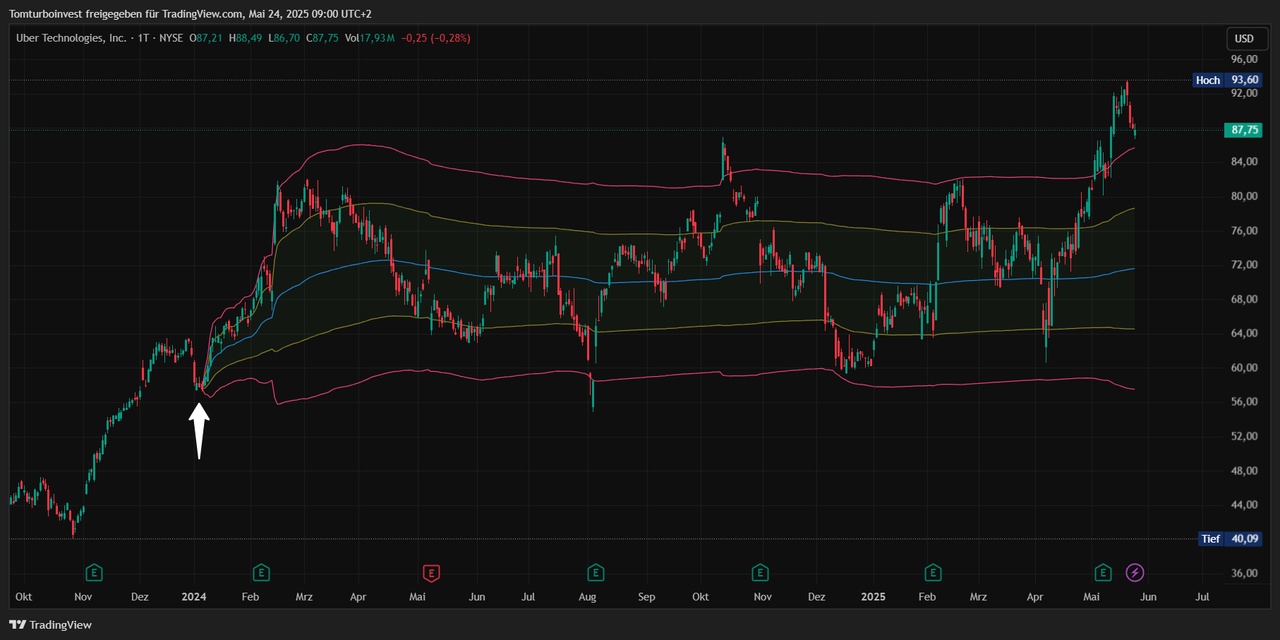
So, I now have a good overview of the trend after a few minutes.
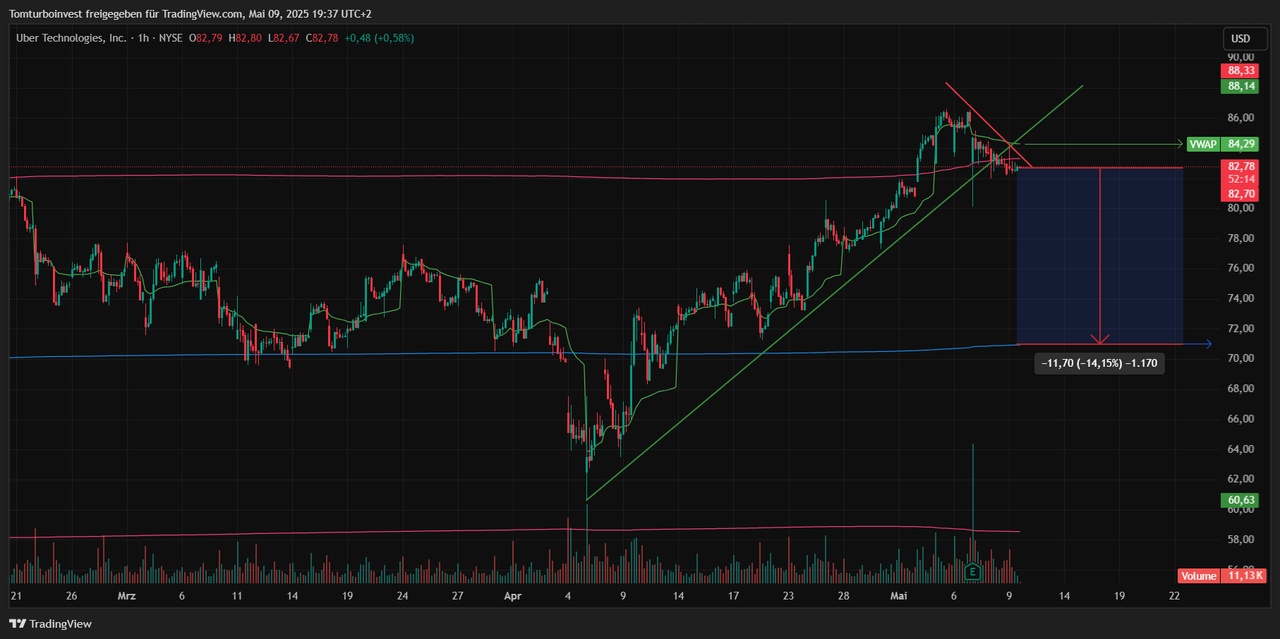
Now it's time to continue with the VWAP. My anchored VWAP I place it in a prominent position for me. In this case the last low before the start of the sideways phase. This is how I see the "DNA" of Uber - How does Uber behave in the statistical areas of the volume-weighted average price.
For my short-term trades, I zoom into the close range, but the anchored VWAP remains. I only switch to the 1 hour chart and the last few months.
The white circles then show potential entries and exits for me. The orange circles at the bottom show the earnings, there's always a lot of movement😁
Of course, I also look in detail at the price action, i.e. the candles per time unit.
In principle, this describes my main procedure for determining the buy/sell point.
That's it 🤷♂️ has been working for me for a long time with the outcome as described in part 2 https://getqu.in/TVNdpR/
Because of the overview, I have hidden the VRVP in the VWAP views, but I always leave it on for my analysis.
Example anchored VWAP with VRVP and SMA5 for the short-term trend
Example anchored VWAP with VRVP and VWAP on a weekly basisI can see where the VWAP of the current week has moved. It's also nice to see how and where the big volumes of the week have positioned themselves 😁
So, that's a bit more detail on my setup. As you can see, with a little practice and routing, you can analyze a stock in a short time. For me, such an analysis usually takes no longer than 10 minutes and I know whether a trade makes sense for me and where to place my buy and sell orders.
PS: I have found a clever script on TradingView for some of my stock screener filters. You can always display some criteria live - in the chart at the bottom right
You can find it under the indicators: Ticker Dashboard For Better Stock Selection
$ADYEN (-1.11%)
$MMK (-0.83%)
$MRK (+0.04%)
$KTN (-3.98%)
$BRBY (-1.45%)
$OMV (-0.55%)
$VER (+2.68%)
$BG (+1.1%)
$VOE (+1.12%)
$ZAL (-2.78%)
$VRTX (+0.29%)
$RDC (-5.53%)
+ 6

As always, first the link to the first post, where you will also find the links to all the other parts https://getqu.in/cbIOkg/
Thanks to the bad weather, the next part will be published before the weekend! 🌨🌨 Next week I'll be traveling for work from Monday to Wednesday - so long posts will be difficult. But maybe I'll be able to pick up some exciting insights from SAP & Amazon. 😊
I'm pretty busy, but if anyone happens to be at SAPPHIRE in Madrid... 🍻
Today I'll give you an insight into my trading setupbut first I'll briefly talk about the outcome bias. This is an important topic that can become a trap, especially at the beginning of trading.
Outcome bias
Outcome bias is the misconception that the quality of a trade is determined by the result. Anyone who enters into a trade on the straight and narrow and then makes a profit often thinks they have got the hang of it. I like to compare it to a casino: I bet on red, win and consider myself "strategic" 🤪😅
When trading, it is important to success or the strategy by the repeatability by repeatability. By clear rules. A strategic trade can lead to a loss. An intuitive decision can lead to a profit. Anyone who makes the latter the yardstick for their trading is undermining long-term success.
👉 Remember: In trading, it is not those with courage and luck who are rewarded in the long term, but the systematic ones!
This leads us straight to the first details of my setup.
What are my premises?
I have tried a few things, but for my trading behavior shares have proved to be the most sustainable with the best profit/loss ratio.
Over the years I have tried all kinds of indicators and oscillators. From RSI, MACD, Fibonacci, all possible trend lines, so that the actual chart progression was barely visible 🤪
Trading not just for the sake of trading. Quality before quantity, if it doesn't fit or if time is tight, then I don't trade for a week or two.
Now that you know that my focus is only on equities, I'll move on to stock selection. In my opinion, this is just as important as chart analysis and deriving entry and exit points.
What are my filter criteria for screening?
The daily range is the range between the daily high and the daily low, a large range facilitates short-term trading, e.g. intraday or only a few days
These two filters ADV and $VOL ensure the liquidity to get out of the trade at any time.
I am not a fan of penny stocks and very small market capitalization
I also like to trade around earnings, there's often a lot of movement.
In general, I like stocks that are moving in a sideways trend, or prices that are at the VWAP or at one of the outer edges of the deviation bands.
What are my indicators for chart analysis?
Attention ONLY for trend determination - is not used for entry/exit points!
Conclusion: I only use SMA and volume, no more, but also no less.
PS: A short "deepdive" on the indicators, the exact settings, etc. will follow in a separate post👆 https://getqu.in/Ka18zh/
In general, I always start my analysis on the stock's home exchange. First a quick look at the last 10 years in the weekly chart, then I continue with the daily chart looking at the last 2-3 years and then the close range of the last months or even just days, depending on how the time horizon of my trade is set up. In the close range, I also like the 4h, 1h or 15min chart. The whole thing is overlaid with the 3 SMAs 200 / 50 and 5 days for the short-term trend.
Once I have a good overview of the trend, I move on to the 2nd layout with VRVP and VWAP or aVWAP. I am always happy when significant volumes of the VRVP coincide with the VWAP or the bandwidths 1 and 2 of the anchored VWAP. According to my statistics, the success rate is highest here. Depending on which exchange I want to trade on, I then also set the chart to this exchange.
I could write endlessly about volume in connection with the VWAP, but that would go beyond the scope of this article. Volume highs, volume lows, POC, volume area, deviation bands 1 and 2, etc...
To see how I use these indicators, you are welcome to read my posts on $NOVO B (-8.33%) or also $UBER (+0.59%) to see them. Or also my short 5min analysis for $MRK (+0.04%) which I recently created for my compatriot @7Trader recently. You can find them all in the feed of my profile from the recent past.
Should I go into more detail on charts & inferences in my future trading posts? Let me know in the comments!
So, that's it again for today - have a nice week!
Click here for part 4
Top creators this week