Dear Quins,
Some of you have asked me to present the GTAA strategy that I often mention. I would like to try this now. Since the topic is a bit more extensive, I will leave it here with an overview explanation without detailed evidence and statistics. But if you are interested, I can write more articles about the different aspects later.
1. what is GTAA?
2. what are the asset classes?
3. what is the investment strategy?
4. what are the results?
5. what are the advantages and disadvantages?
6. conclusion
7. links
1. what is GTAA?
GTAA stands for Global Tactical Asset Allocation and was developed, among others, by the US fund manager Meb Faber in extensive quantitative studies (Links). I would classify this strategy as follows in the universally known:
The easiest way to invest in the capital market today is to buy individual stocks. The chances are high, the risks in the end also: Management mistakes, politics, disruptions, misvaluations (e.g. General Electric). For all the risks you can possibly get a decent premium, unfortunately you usually only know afterwards or you have to put an incredible amount of work into it.
In order to reduce the risks and the effort, you can buy several stocks that balance each other out or you can buy an index fund (e.g. S&P500). One goes, so to speak, one dimension higher, from point (= single stock) to line (= quasi infinite points). With index funds, however, one has not yet completely eliminated the risks: Mispricing, bear markets, political interventions are always possible (e.g. Ukraine).
So you can add another dimension (area) to your investment and spread the risk over different indices and countries (e.g. 50% USA, 30% EU, 20% EM). Stocks continue to form the basis, but no longer play a role in detail. However, there are always phases when all stock markets rise or fall (e.g. global financial crises 1929, 2009).
If one also wants to reduce this risk of the entire asset class of stocks, one has to go up another dimension and diversify across different asset classes, such as bonds, commodities, real estate, precious metals (e.g. Classic 60%stocks - 40%bonds portfolio, Ray Dalio's all-weather portfolio or Meb Faber's Global Asset Allocation). Thus, the space(!) of the classic (ETF) asset classes is measured out. These portfolios can significantly mitigate risk and volatility because the asset classes balance each other out. The downside, however, is that they also offset each other's gains, i.e. the expected return falls below the return of the index funds in the long run (2-5%pa risk premium).
This is the level and problem that GTAA addresses. The goal is to achieve the high returns of equity markets over the long term with the low risk and volatility of global multi-asset portfolios. To achieve this, the strategy adds another dimension to asset classes: time. So instead of permanently holding a once fixed allocation of asset classes, the risk should be spread over the different times. This means that, if possible, investments should always be made in the class that is currently on the rise (momentum), e.g. instead of permanently holding 60% equities and 40% bonds, 60% of the time fully equities and 40% of the time bonds are now held (roughly in this ratio the respective outperformance times are divided over the last 100 years, which is also the deeper reason for the classic, static 60-40 portfolio). GTAA now refers to a strategy approach that attempts to be invested in the strongest asset classes in the world at any given time through a clever combination of different asset classes and market timing models. (To further improve the risk-reward profile of GTAA, one can go one dimension higher. I already have an approach, but to develop it further myself, I still lack the appropriate knowledge and data).
So much for the basic idea. If you have read this far and are still interested, you are welcome to read on how to implement the whole thing.
2 What are the asset classes?
In the implementation, I follow the KISS principle (Keep It Simple, Stupid). GTAA should be as easy to follow as possible, customizable and low maintenance. Once the strategy is in place, 5 minutes of effort per month should be enough. Money is for life, not the other way around!
The first step is to find different asset classes that will later comprise the individual investment universe. This selection should be done very carefully and meet several conditions:
a) Overall, they should cover all asset classes and the entire world as far as possible (market diversification!).
b) The asset classes should be as uncorrelated as possible (risk diversification!).
c) The asset classes should be represented with the largest possible, liquid, low-cost ETFs (tradability!).
d) The asset class should ideally move historically in long, stable trends (timeability!).
Depending on the individual profile, this can be more or less ETFs. The simplest version is a "universe" of three ETFs: equity ETF, bond ETF, real assets ETF. More complex versions would split the classes into different markets with as little correlation as possible, e.g. equities: US, EU, EM, SEA, or even: tech, energy, healthcare, consumer, real estate, etc.... Likewise with bonds and real assets. Cryptos can also be added if needed. Meb Faber suggests 5 classes for the simplest variant (US equities, Rest of World equities, US bonds, US REITs, commodities), but also discusses further differentiated variants with up to 13 classes (link).
In my own research, however, I have found that more assets by no means always lead to a better total return. Decisive are trend strength and uncorrelatedness.
3. what is the investment strategy?
Once the individual investment universe, the global asset allocation, is determined, the "tactical" element follows: timing. There are fundamental timing strategies (interest rate indicators, intermarket analysis, etc.) and technical ones (Elliot waves, trend lines, etc.), but many of them are not very successful in the long run. In my opinion, the so-called "Dual Momentum", developed in 2011 by Gary Antonacci, is an exception.
"Dual Momentum" takes into account both absolute momentum of an asset against itself and relative momentum of an asset against others. This strategy can be applied to all sorts of asset classes and shows significant risk-reward advantages over simple B&H or market timing over the long term. Therefore, I think it makes sense to apply it to global asset allocation as well. This means: each asset is tested to see if it rises and if so, whether it rises more than the other assets in the individual investment universe. If the answer is positive in both cases, it is bought, otherwise it is sold. The specific parameters can be defined individually and should always be checked in backtests to see whether they achieve the above-mentioned goal (equity return with bond risk).
For simplicity, I have chosen an example with three classic asset classes and the following rules (link below):
(a) The investment universe consists of S&P500, Global Bonds and Gold.
b) The asset class that is bought or held is the one that has the highest sum of 3 and 12 month performance (strongest relative momentum) and at the same time trades above the 200 day average (positive absolute momentum). If no asset class is trading above the 200-day average, cash is held.
c) Trading takes place once at the end of the month. No stop loss.
4) What are the results?
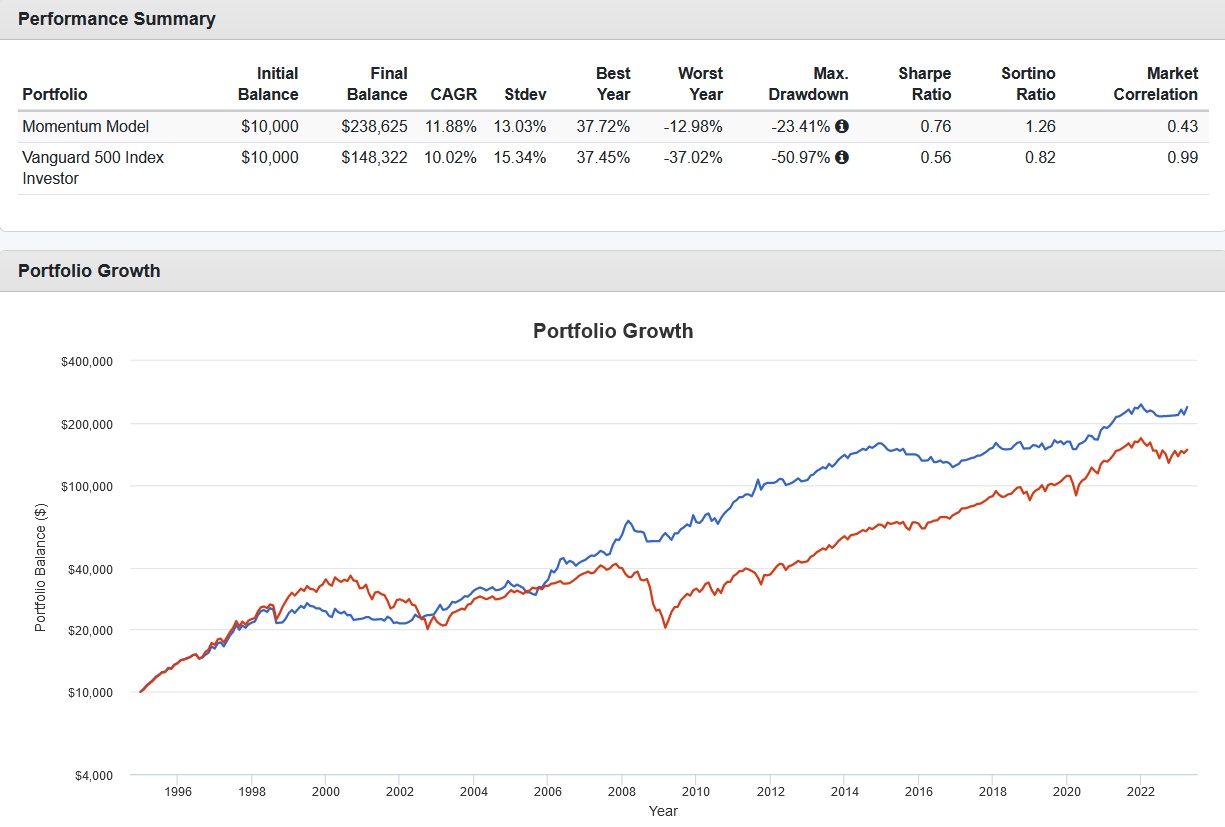
The benchmark S&P500 index has increased almost 15-fold or 10.0% p.a. since 1995 with a maximum drawdown of 51.0% (Sharpe Ratio: 0.56). See chart below.
Over the same period, the GTAA portfolio increased almost 24-fold or 11.9% p.a. with a maxDD of 23.4% (Sharpe Ratio: 0.76).
So the GTAA portfolio outperformed the S&P500 by more than 50% at less than 50% of the risk!
The performance curve is much flatter, i.e. less volatile. Of course, the whole thing can be further improved with other asset classes, other parameters (with me up to almost 20%pa at 20% maxDD since 2002 - you may search yourself!). But to illustrate the advantages and disadvantages of GTAA, the simple example is enough.
5. what are the advantages and disadvantages?
Advantages:
Emotionlessness: signals are delivered clearly, there is no influence of emotions on trading decisions. The low fluctuations of the portfolio facilitate stress-free implementation and concentration on more meaningful things in life.
Independence: The portfolio develops largely independently of the stock markets (market correlation: 0.43). The more even performance lowers the return sequence risk and enables better financial life planning. E.g., the lowered risk allows a much higher withdrawal rate at chapter preservation and thus financial freedom is much more achievable.
Simplicity: The strategy is comparatively simple and time-saving to implement. In the example, a whole 96 trading signals have been generated since 1995, i.e. on average about one signal per quarter. A check of the signal situation at the end of a month costs about 5min. The implementation in the form of a savings plan is easily possible.
Flexibility: The strategy can be adapted and optimized according to individual ideas, e.g. by further differentiating the asset classes or including favorite stocks, theme ETFs or alternative assets (Bitcoin). A variant pretty with the popular core-satellite strategy is also available! Likewise, the number of asset classes held in each case can be freely selected, e.g. instead of Top1, also Top2 or Top3. GTAA can also be combined with existing strategies, as an asset and risk control mechanism. Or it can be used as diversification of existing strategies (B&H, dividends, core-satellite...).
Disadvantages:
Social stress risk: there are prolonged periods of underperformance against the stock markets (in the example: two 5-year periods of 0% performance). Sticking with the strategy while everyone else is celebrating jubilant stock markets and not understanding what you are doing can be psychologically difficult.
Naivety risk: understanding the strategy and building it individually takes time and (basic) knowledge of asset classes, correlation analysis, statistics, etc. If you don't understand what GTAA can and cannot do, it's better to avoid it. A negative example are the wikifolios that simply blindly replicated Faber's GTAA approach, which is optimized for the US markets, and naively make modifications after poor performance that only make things worse in the backtest. Flip side: the complexity of building a GTAA portfolio combined with the simplicity of its implementation makes the strategy unattractive to professionals and laymen alike. Eventually there will be an ETF that implements GTAA, but that will take time.
Overfitting risk: when backtesting with the selected asset classes, there is a risk that the individual strategy will stop working just when it has reached its optimum. This risk can be minimized with correlation analyses, robustness tests and market knowledge, but it is probably not completely eliminable - as with any systematic strategy.
Taxes: In the example above, there is one signal per quarter, or about 4 complete shifts per year. Fortunately, trading costs are negligible nowadays and the big winners usually stay longer in the portfolio (up to 27 months in the example). But the relatively frequent sales with smaller gains and subsequent final withholding tax may well weigh on the overall performance. In my opinion, this problem can best be solved by a tax- and trading cost-free shell (e.g. Wikifolio or a favorable net policy) which, however, costs 0.2%-0.4% p.a.. Whether it is worthwhile, you have to calculate individually.
6. conclusion
GTAA has clear advantages over simple B&H strategies (higher returns, less risk). Whether these advantages outweigh the aforementioned disadvantages, which are more psychological and fiscal in nature, is something everyone must decide for themselves. In any case, studying this strategy significantly broadens one's view of financial markets and investment strategies.
Want to learn more about GTAA and its variants? Just ask in the comments. I can then address common or difficult questions in detail in further posts.
7. links
- Meb Faber on Global Asset Allocation: https://mebfaber.com/wp-content/uploads/2016/04/GAA-Book-1.pdf
- Meb Faber on GTAA: https://papers.ssrn.com/sol3/papers.cfm?abstract_id=962461
- Online Summary: https://www.finanzen100.de/finanznachrichten/boerse/multi-asset-timing-bringt-renditen-in-jeder-marktlage_H1331807279_10980735/
- Model Backtests: https://www.portfoliovisualizer.com/test-market-timing-model