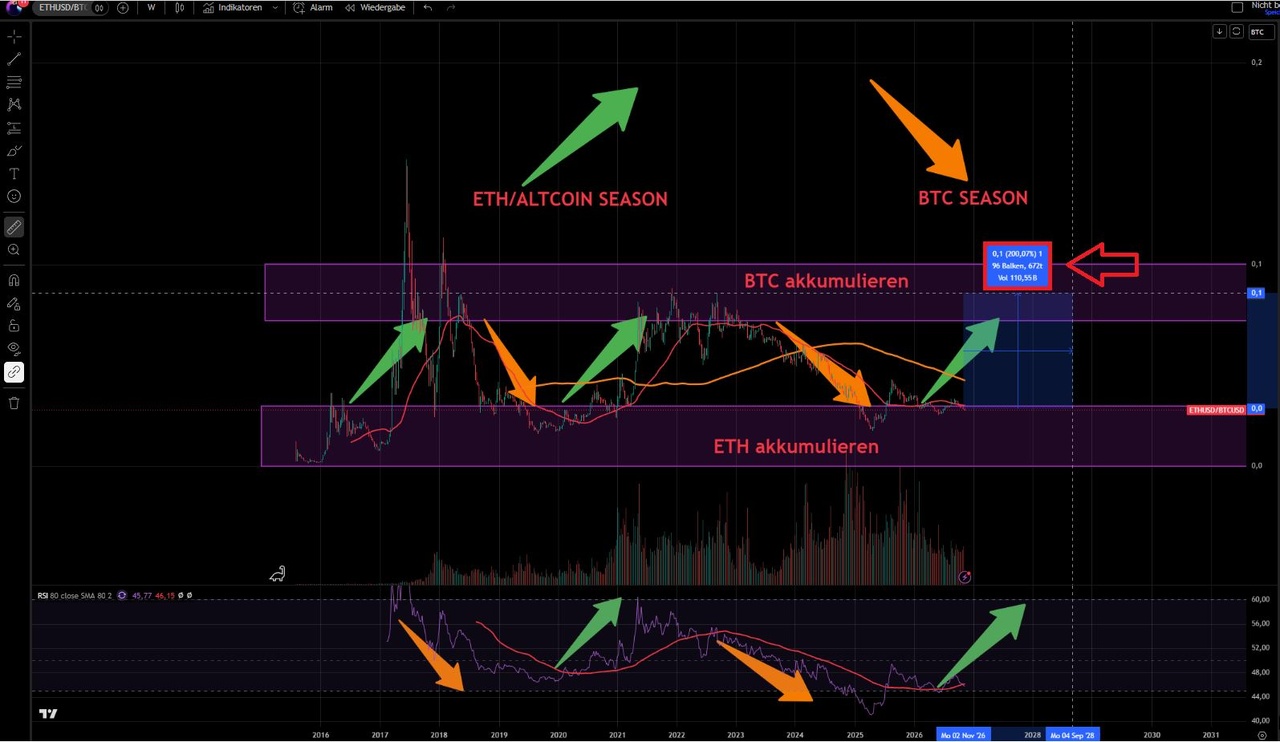
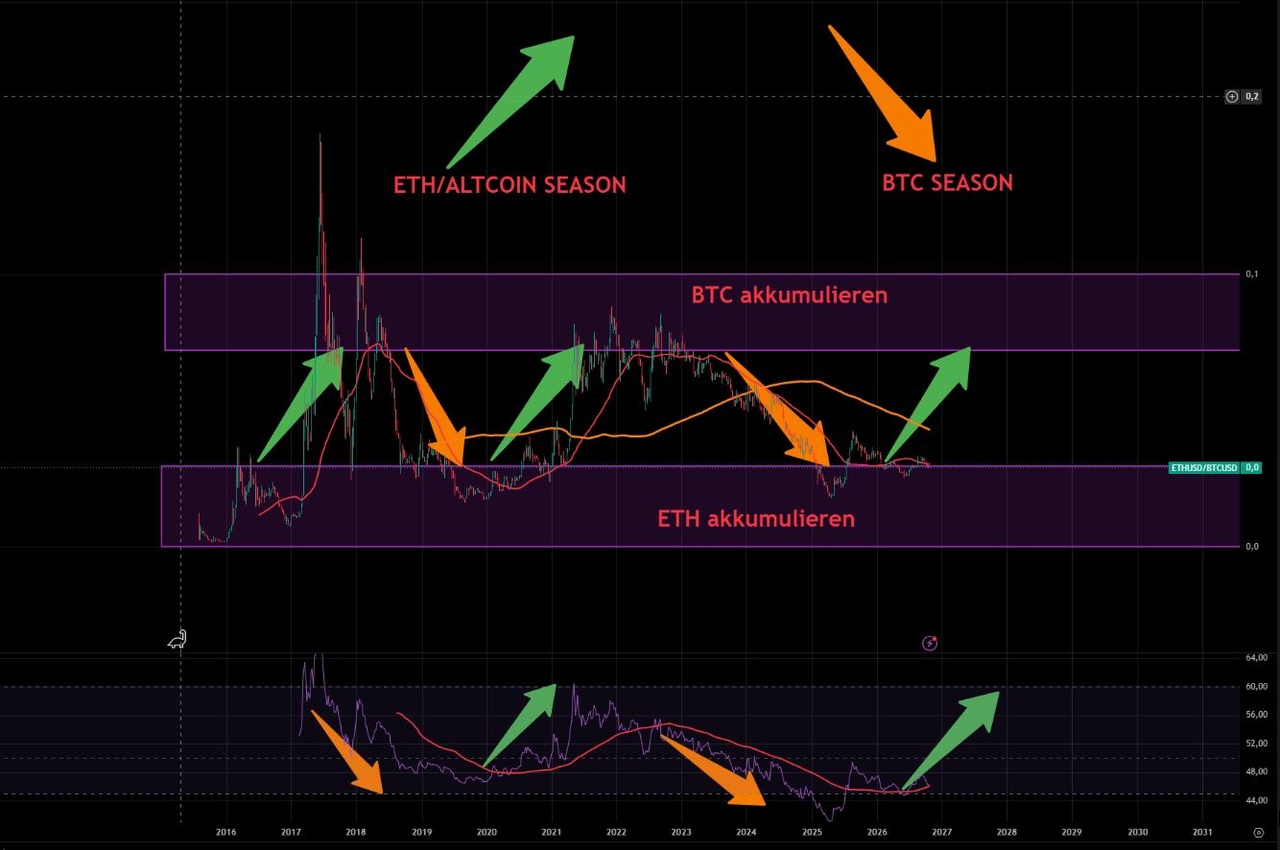
My mathematical calculation for the next crypto bull run, based on the assumption that $ETH (-0,57%) 3x $BTC (-0,9%) outperformed. I don’t think anyone can imagine ETH prices at $15,000 right now. Feel free to post your own calculations here as well.
The Chart Mechanics (Capital Rotation)
Historically, the ratio between Ethereum and Bitcoin has moved in fixed cycles between two extreme zones: the lower accumulation zone (“ETH accumulation”) and the upper distribution zone (“BTC accumulation”). After every multi-year downtrend, the ETH/BTC ratio has rebounded from the lower zone by around +200% (3x) .
The Calculation in Detail
- Starting point: Bitcoin at $80,000, Ethereum at $2,500. This currently results in a historically low ETH/BTC ratio of 0.03125.
- The outperformance (+200% / 3x): If the ETH/BTC ratio rises by +200% into the upper chart zone, as it has in previous cycles, the ratio will increase from 0.03125 to 0.09375.
Depending on how strongly Bitcoin itself gains in the next liquidity cycle (toward 2028/2029), this double leverage will result in the following scenario:
Conservative scenario (BTC +100% / 2x to $160,000):
$160,000 × 0.09375 = $15,000 per ETH (6x multiplier)
Chart scenario (BTC +200% / 3x to $240,000):
$240,000 × 0.09375 = $22,500 per ETH (9x multiplier)
Context & Investment Focus
Even if Bitcoin “only” doubles (+100%) in the next bull run due to its high market capitalization, a normal rebound of the ETH/BTC ratio to 0.09375 would be enough to push Ethereum to $15,000 . Fundamentally, this rotation is driven by increasing institutional tokenization (stablecoins, bonds, funds) on the Ethereum network.
Not investment advice 🐊