Geopolitical Easing Brings Relief to the Markets
The recent peace agreement between the U.S. and Iran ends the four-month blockade of the Strait of Hormuz. This alleviates the massive inflationary pressure that had still weighed on the Fed’s first meeting under Kevin Warsh. As risk assets and supply chains stabilize, geopolitical tensions are receding into the background; attention is now turning once again to massive investments in AI infrastructure.
Capital outflows weigh on $BTC (+0,62%)
in the short term
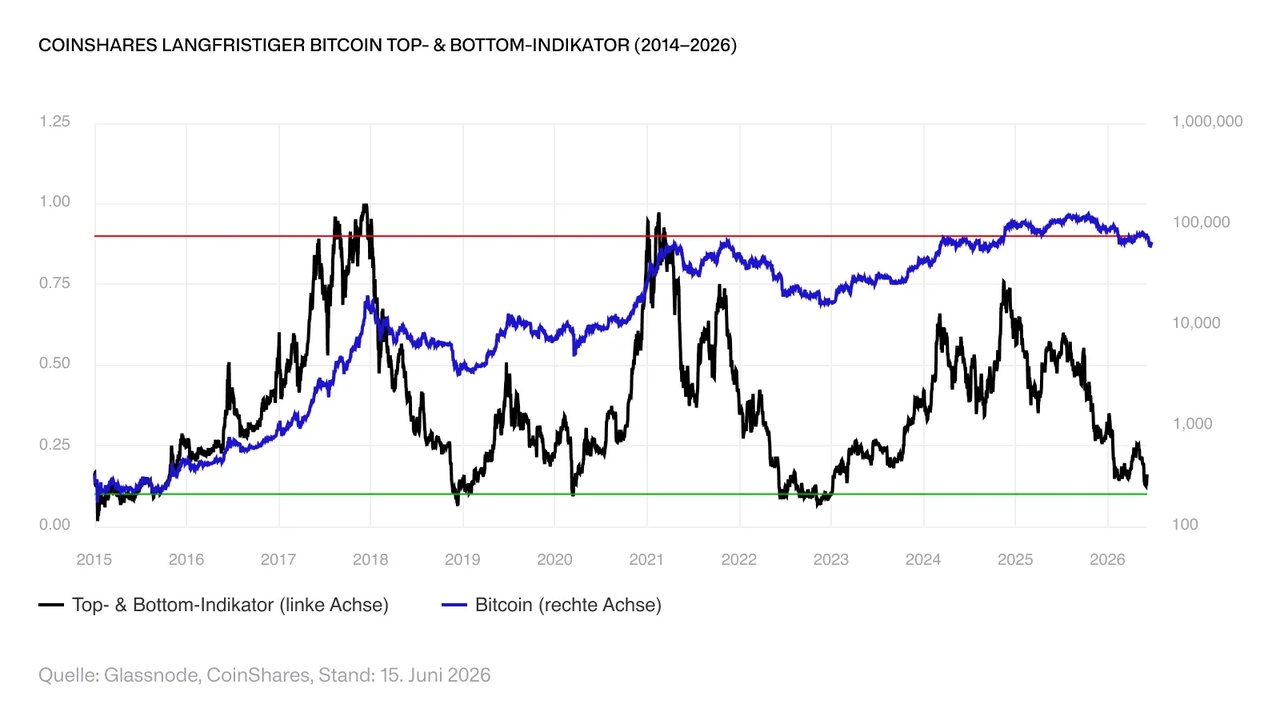
$BTC (+0,62%) , and the broader crypto market has recently come under pressure due to changes in monetary policy as well as high capital lock-up ahead of high-profile initial public offerings (IPOs). For the first time since the launch of the #bitcoinETFs—previous outflows were mostly the result of unwinding carry trades. Interestingly, our proprietary market indicator—which aggregates over a dozen individual signals—is approaching levels that have historically and reliably coincided with major market bottoms.
Falling inflation bolsters the $BTC (+0,62%)outlook
Going forward, the strongest driver of inflation is likely to lose momentum, while the spread of AI technologies could have a structurally deflationary effect in the medium term. This interplay is likely to $BTC (+0,62%) provide a noticeable tailwind in the coming months. Since an increasing number of financial advisors are also being authorized to recommend this to their clients $BTC (+0,62%) , the current market level offers an excellent basis for strategic positioning.