
Hello my dears,
to my company presentation of $SESG (-6,24%) SES there was a good addition in the comments from @Raketentoni . Which has its own screening system, so thank you my dear for keeping an eye on it again. And for telling us the dangers by name.
To make my work a little easier, I always use the TraderFox Scoring Systems.
I've already done a series on this called 🔴🟠🟡🟢🔵🟣Points Kings.
Here, however, I have only selected the green values, i.e. with a high number of points.
And in my company presentations, I only include the green scores.
So you can assume that if no scoring is inserted, it is a value in the yellow or red range.
So my question to the community is, would you also like me to add yellow and red ratings in future?
For classification, there are:
- Quality check
- Growth check
- Dividend check
- Robustness check
Many of you will have used the TraderFox Scoring and already use it yourselves.
Here you refer to the history.
This means
(related to the quality check)
- 🔴Red or 🟡yellow values do not necessarily have to be bad and may also offer greater opportunities. But they may not yet have a long history. Or perhaps they have only just become profitable.
However, you should assume that such stocks are less conservative and also carry a certain risk risk.
- 🟢 Stocks often have a longer history. And the companies have proven stability. In other words, they have shown that they can cope even in stormy times. They are often long-term runners and compounders.
And mostly companies with a moat.
We're talking about the greens here.
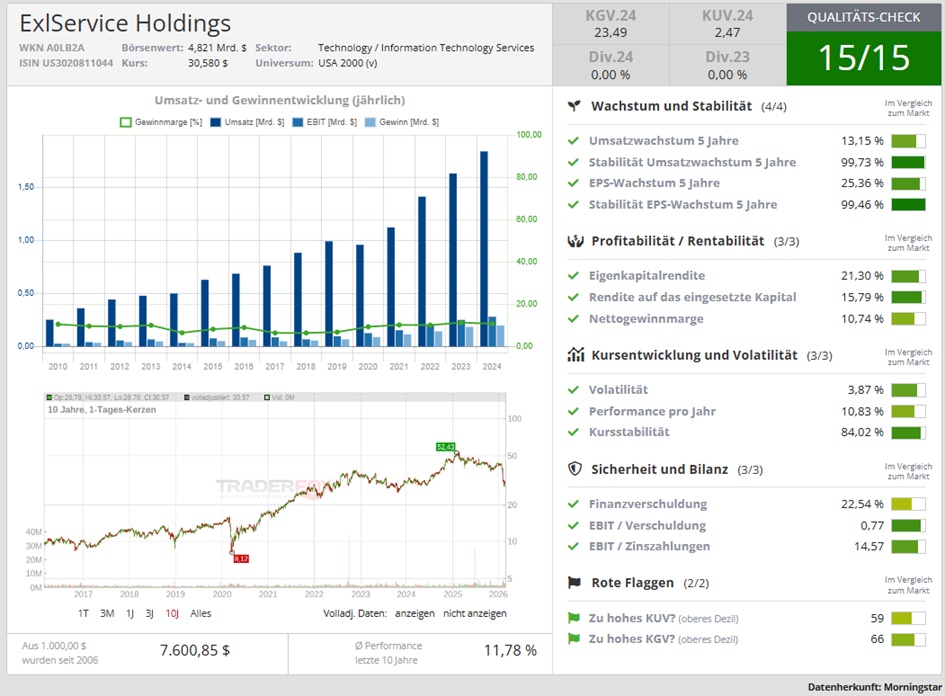
- My dears, the fact that the quality check is not a 100% guarantee is shown quite well by the example of $EXLS (+1,83%) Exl Service. The share gets top marks because it has delivered in the past. But it has now been hugely penalized by the figment of AI's imagination.
PS. All my company ideas are of course not stock recommendations. Everyone is responsible for themselves and must make their own decisions.
Quality check for shares (here again the exact explanation of the quality check)
×
The TraderFox quality check assigns up to 15 points to each share. We use key figures that have become established in finance to distinguish quality from junk. The special thing about our quality check is that the 15 criteria are always considered in the context of the rest of the shares on the market. According to the principle: a key figure is considered to be fulfilled if the company performs better than, for example, 65% of all other companies in the respective reference market. The quality check is intended firstly to help investors reduce the risk of investments and secondly to draw attention to outstanding investment opportunities.
The following are the key figures and threshold values used
Growth and stability:
- Sales growth 5 years; 50%
- Stability Sales growth 5 years; 65%
- EPS growth 5 years; 50%
- Stability EPS growth 5 years; 65%
Profitability and profitability
- Return on equity; 50%
- Return on capital employed; 50%
- Net profit margin; 50%
Share price performance and volatility
- Volatility; 50% (ranking reversed)
- Performance per year; 50%
- Price stability; 50%
Security and balance sheet
- Financial debt; 50% (ranking reversed)
- EBIT / debt; 25%
- EBIT / interest payment; 25%
Red flags
- P/E ratio too high?; 10% (ranking reversed)
- P/E ratio too high?; 10% (ranking reversed)

(No advertising for Traderfox)


