
You are probably all familiar with the 4-year cycle of $BTC (+1,77%).
The narrative goes like this: Every four years, the halving takes place, followed by a bull market with a price bubble, then a crash, then an accumulation phase - and then the whole thing starts all over again.
Halving -> bubble -> crash -> accumulation -> repeat
The community has always argued about the exact reasons for this cycle. Most think that it is related to Bitcoin halving every 4 years. However, some also assume that it is related to market liquidity, which also moves somewhat in a 4-year cycle. Additionally, the election of the US president is every 4 years, which usually means investing and money printing.
This could all play a role. I assume that, above all, human psychology also plays a role. If everyone follows the 4-year cycle and acts accordingly, it could become a self-fulfilling prophecy.
But what if the 4-year cycle never actually existed?
I have come across an exciting theory that I would like to present to you today. It comes from Dr. Stephen Perrenod - an astrophysicist and mathematician who has been working intensively on the mathematical laws behind Bitcoin. Only time will tell whether he is right in the end, but the reasoning is certainly exciting and I don't want to withhold it from you.
Where the 4-year cycle shows weaknesses
Let's first take a look at the major Bitcoin bubbles to date:
- 2011 - Bitcoin rose from around 1$ to 31$
- 2013 - Bitcoin rose to approx. 1,100$
- 2017 - Bitcoin rose to approx. 20,000$
- 2021 - Bitcoin rose to approx. 69,000$
Perrenod points out a problem here that is actually difficult to dismiss:
The 4-year cycle completely ignores the 2011 bubble. Only around 2.5 years passed between the creation of Bitcoin in early 2009 and the 2011 bubble - not four. The 2011 bubble is dismissed as an "early outlier event" in the 4-year cycle theory. However, the 2011 bubble was just as significant as those in 2013 and 2017.
And then we have 2025 - the year in which the 4-year cycle would have predicted a major bubble. The halving was 2024, so 2025 should be the big year after all...
Although there was a new all-time high of just under 126,000 dollars in October, it was a far cry from what everyone had expected. There was no bubble, there was no retail interest. There was a brief rise followed by a 30% sell-off.
The annual performance was even slightly negative at around -7% in dollar terms. This also broke the familiar traffic light pattern for Bitcoin 🟢🟢🟢🟢🔴 (3 years positive, 1 year negative).
One could therefore argue that the 4-year cycle with 5 possible data points did not work at least 2 times:
2011 doesn't fit in and neither does 2025.
Perrenod's theory: bubbles follow logarithmic intervals
I have already written a post about the Bitcoin Power Law in the past. Briefly summarized, the power law states that Bitcoin's price does not grow exponentially (like stocks, for example), but follows a power law in which the price rises approximately to the 5.7th power of the network age.
The reason for this lies in Bitcoin's nature as a network:
The value increases disproportionately with each new participant (Metcalfe's Law)
Perrenod builds his theory on this power law and draws an interesting conclusion from it:
If Bitcoin follows a power law, then the behavior is scale-independent.
This means that
If the age of the network doubles, the value of the network increases by a certain factor. For the next increase by the same factor, the age must double again: from 2 to 4 years, then from 4 to 8, then from 8 to 16 years and so on.
From this, Perrenod concludes that the large price bubbles should also be further and further apart - not at fixed 4-year intervals, but at intervals that roughly double.
To verify this, he examined the Bitcoin price data after removing the power-law trend using a Fourier analysis (a mathematical method for recognizing recurring patterns).
The result: a log-periodic distance parameter lambda of 2,07.
-> According to Perrenod's analysis, the time interval between the large bubbles roughly doubles each time.
Let's take a look at this:
Bubble -> 2011; Bitcoins age approx. 2.5 years
Bubble -> 2013: Bitcoins age approx. 4.9 years; distance to the previous bubble: ~2.4 years
Bubble -> 2017: Bitcoins age approx. 9 years; distance to previous bubble: ~4.1 years
Bubble -> 2027? Bitcoins age approx. 18.4 years; distance to previous bubble: ~9.4 years
The pattern is indeed striking: 2.4 -> 4.1 -> 9.4 years.
Perrenod argues that this is not a coincidence, but a mathematical regularity known in physics as "discrete scale independence". This behavior can be found in earthquakes, in fluid turbulence and even in the structure of spiral galaxies - everywhere there the lambda parameter is also in the range around 2.
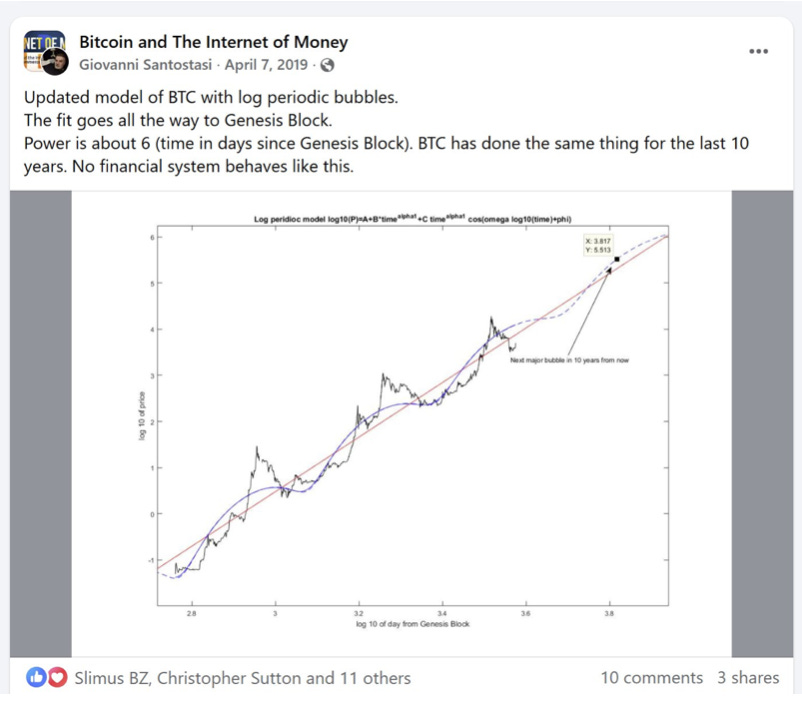
The physicist Giovanni Santostasi already predicted in 2019 - over 6 years ago - using a similar model that the next major peak would not come until the end of 2026 / beginning of 2027. And his prediction that 2025 would not bring a bubble has been confirmed:
But then what was 2021?
If, according to Perrenod's model, the fundamental bubbles are 2011, 2013, 2017 and then again ~2027 - what was the 2021 bubble?
His explanation: a so-called "first harmonic" - comparable to an overtone in music. Anyone who plays an instrument is familiar with this: there is the fundamental tone and overtones that occur between the fundamental tones. According to this model, Bitcoin's bubbles would also have a fundamental mode (the large bubbles) and smaller harmonic oscillations in between.
The distance between the harmonics corresponds to the square root of lambda (√2.07 ≈ 1.44). If we multiply the age of the 2017 bubble (8.95 years) by 1.44, we arrive at 12.89 years - which corresponds almost exactly to the end of 2021.
If this is correct, it would also explain why the 2021 bubble seemed "somehow different" or "weaker" to many - it would not have been a fundamental bubble, but a lower energy harmonic.
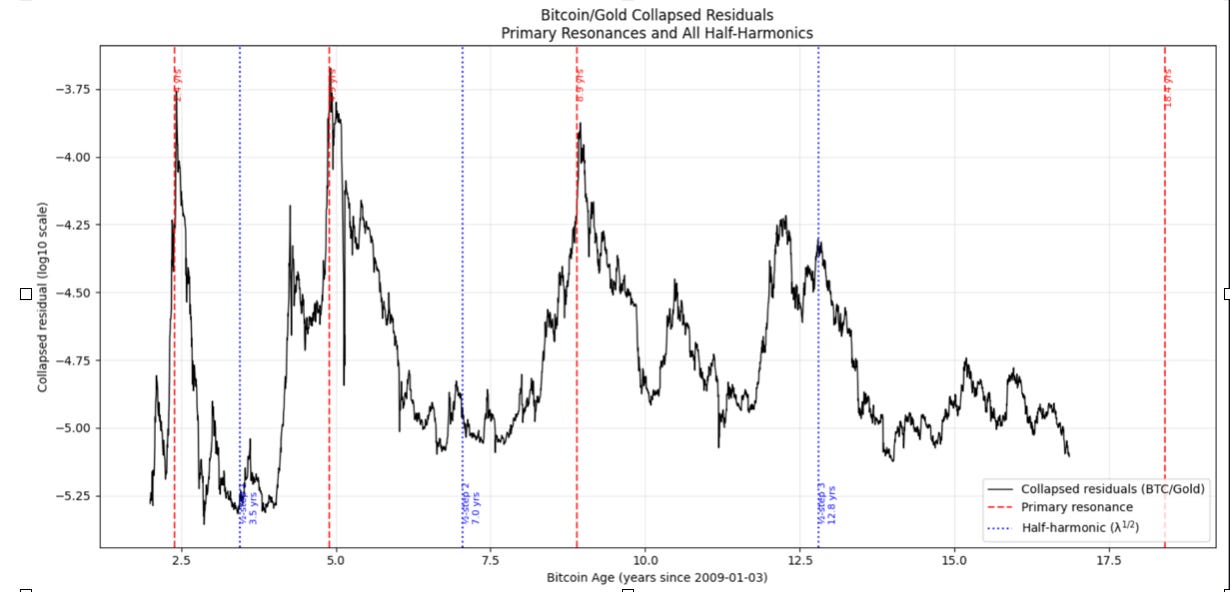
In the picture you can see the fundamental peaks (red) and the harmonic intermediate oscillations (blue).
What if you compare the two models?
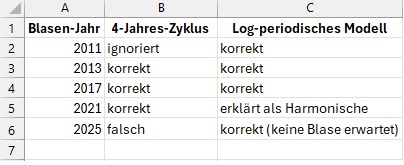
At least historically, the log-periodic model seems to be able to explain all five data points - the 4-year cycle has problems with two of them.
According to Perrenod, the average temporal prediction error is also significantly better with the log-periodic model at around half a year than with the 4-year model at over a year.
If Perrenod is right,
the next fundamental peak would be expected sometime between Q4 2026 and Q2 2027. However, according to this model, the bubbles are getting smaller and smaller relative to the trend. It is therefore possible that the next "peak" will be less dramatic than in the past.
Conclusion
Whether the 4-year cycle never actually exists cannot, of course, be said with absolute certainty at the present time. With only a handful of large bubbles, the database is still thin - both for the 4-year cycle and for the log-periodic model.
What we can say, however, is that Perrenod's theory provides a coherent, mathematically sound explanation as to why 2025 did not bring a bubble - and why this was not to be expected in the first place. The argument that bubbles are distributed logarithmically and not linearly is consistent in itself and is based on laws that can be observed in many systems in nature.
But as is always the case, models work until they no longer do.
I find Perrenod's theory exciting, but I wouldn't overestimate it either. However, if there really is another upward exaggeration in 2027, you could argue that he is right and that the 4-year cycle has been disproved. I would say: let's be surprised. The theory at least provides a bit of hopium in the bad market situation :D
You can find the original article on the theory here:
https://stephenperrenod.substack.com/p/why-is-there-no-bitcoin-bubble-in
What do you think?
Grüße✌️


