After my first post on humanoid robots received a lot of positive feedback, I went into more detail. I later added my favorites in each sector.
In-depth analysis of the value chain, including shovel manufacturers and potential hidden champions
New category: Secondary Key Sectors (Sales, Marketing, Financing)
Additionally: Top 25 companies worldwide, as well as the Top 10 in Europe and the Top 10 in Asia
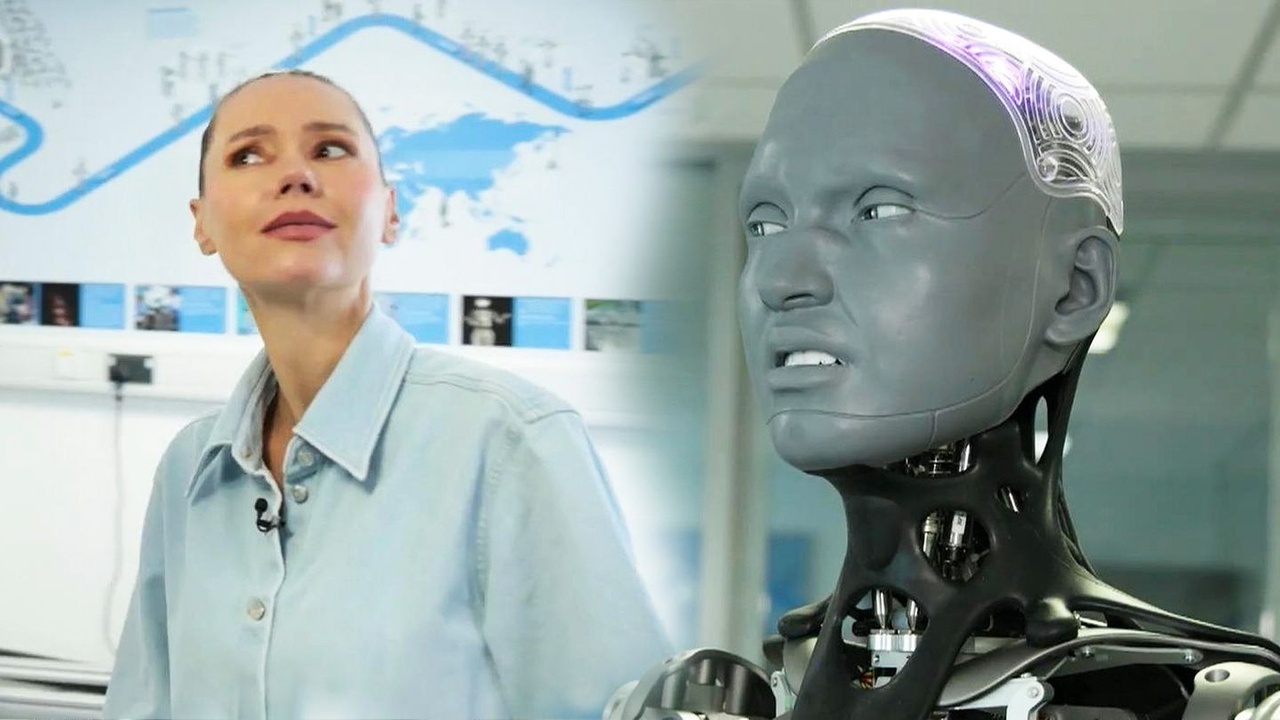
To help newcomers get up to speed, I’ve included a video link. This will give you an idea of just how far the development of humanoid robotics has come today.
https://www.stern.de/panorama/wissen/humanoider-roboter---wie-reagiert-er-auf-beleidigungen--35996156.html
Thank you for your attention and support 🙏
🌐 1. Humanoid Robot Value Chain (with hidden champions)
1. Research & Chip Design
$ARM (+2,3%) ARM (UK) – CPU IP, energy-efficient processors
$SNPS (+1,67%) Synopsys (US) – EDA software, chip design
$CDNS (+2,93%) Cadence (US) – EDA & Simulation
$PTC PTC (US) – Engineering software, CAD/PLM
$DSY (+2,66%) Dassault Systèmes (FR) – 3D design & digital twin
$SIE (+2,11%) Siemens (DE) – Industrial software & lifecycle management
$ADBE (+1,56%) Adobe (US) – Design, AR/UX
ANSYS (US) – Multiphysics Simulation – Acquired by Synopsys
Altair (US) – CAE, Simulation, Digital Twin – Acquired by Siemens
$HXGBY (+3,38%)
Hexagon (SE) – Measurement Technology & Simulation
$AWE Alphawave IP Group (UK) – High-speed chip IP for AI/robotics
1. Synopsis, 2. Siemens, and 3. Adobe are my top three picks in this sector
2. Manufacturing Technology & Equipment
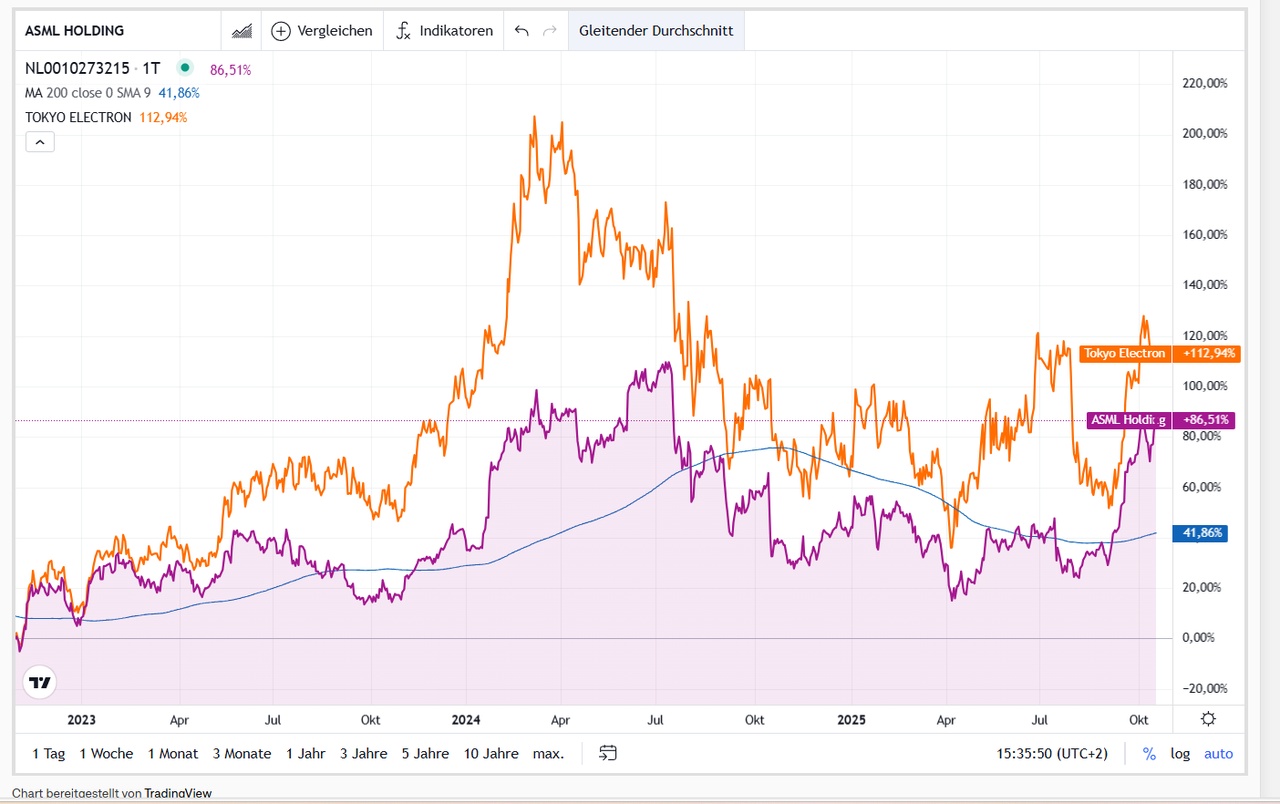
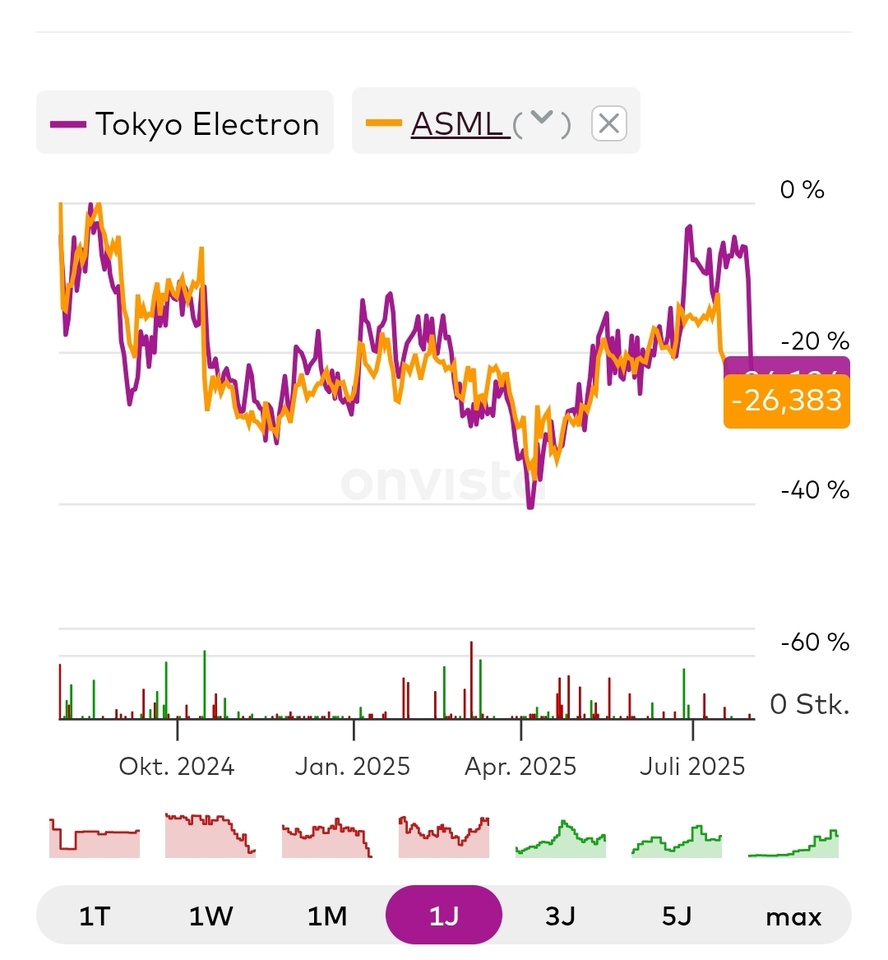
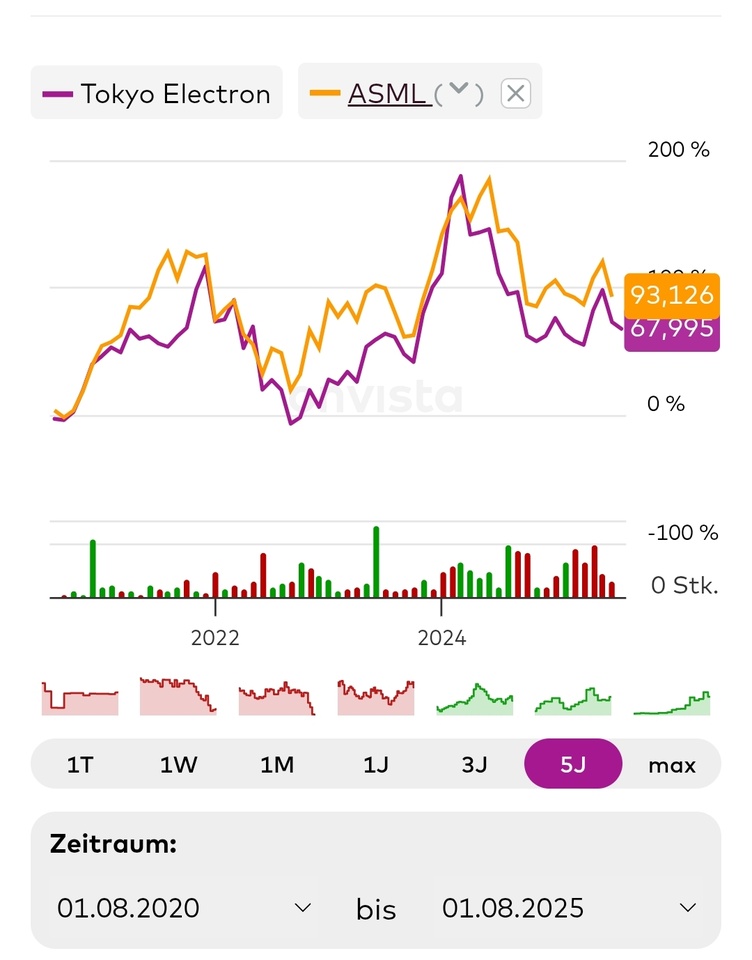
$ASML (+2,12%) ASML (NL) – Lithography (EUV)
$AMAT (+2,89%) Applied Materials (US) – Semiconductor Equipment
$8035 (+1,02%) Tokyo Electron (JP) – Wafer manufacturing
$KEYS (+1,6%) Keysight Technologies (US) – Measurement Technology
$6857 (+0,62%) Advantest (JP) – Chip Test Systems
$TER (+2,72%) Teradyne (US) – Test systems + cobots
$6954 (+2,9%) Fanuc (JP) – Industrial robots, CNC
$CAT (+1,41%) Caterpillar (US) – Autonomous Machinery
$KU2G KUKA (DE) – Industrial Robots
Comau (IT) – Automation – Not publicly traded
$ROK Rockwell Automation (US) – Industrial automation
$JBL (+1,71%) Jabil (US) – Contract Manufacturing (EMS/ODM)
$KIT Kitron (NO) – European EMS/ODM manufacturer
$AIXA (+0,11%) Aixtron (DE) – Deposition systems for compound semiconductors
$LRCX (+2,88%)
Lam Research (US) – Etching/deposition systems
$MKSI (+1,76%)
MKS Instruments (US) – Plasma/vacuum technology
$ASM (+1,06%)
ASM International (NL) – Deposition systems
1. ASML, 2. Keysight Technologies, 3. Fanuc are my top 3 in this sector
3. Chip Manufacturing (Foundries)
$TSM (+1,41%) TSMC (TW) – leading foundry
$SMSN Samsung Electronics (KR) – foundry + memory
$GFS (+1,8%) GlobalFoundries (US) – specialty chips
$INTC (+0,88%)
Intel Foundry Services (US) – new Western foundry player
$981
SMIC (CN) – Largest Chinese foundry
$UMC
UMC (TW) – Power, RF, and embedded chips
1. TSMC, 2. Intel, 3. Samsung Electronics are my top 3 in this sector
4. Computing & control unit (“brain”)
$NVDA (+0,33%) Nvidia (US) – GPUs, AI chips
$INTC (+0,88%) Intel (US) – CPUs, FPGAs
$AMD (+1,98%) AMD (US) – CPUs, GPUs
$MRVL (+2,9%) Marvell (US) – network chips
$MU (+1,8%) Micron (US) – Memory
$DELL (+1,56%) Dell Technologies (US) – Edge & Infrastructure
Graphcore (UK) – AI chips (IPU) – not a publicly traded company
Cerebras (US) – Wafer-Scale Engine – not a publicly traded company
SiPearl (FR) – European HPC chip – not a publicly traded company
1. Nvidia, 2. Marvell, 3. Micron are my top 3 in this sector
5. Sensors (“Senses”)
$6758 (+2,65%) Sony (JP) – Image sensors
$6861 (+2,73%) Keyence (JP) – industrial sensors
$STM (+3,31%) STMicroelectronics (FR/IT) – Sensors, MCUs
$TDY Teledyne (US) – optical/infrared sensors
$CGNX (+1,7%) Cognex (US) – Machine Vision
$HON (+1,2%) Honeywell (US) – Sensors, Security
ANYbotics (CH) – Autonomous sensor fusion – not a publicly traded company
$AMBA (+2,89%) Ambarella (US) – Video & computer vision SoCs for real-time image recognition
$OUST
Velodyne Lidar (US) – Lidar sensors – acquired by Ouster
$AMS (+2,39%)
OSRAM (AT/DE) – optical sensors
1. Teledyne, 2. Keyence, 3. Ouster are my top 3 in this sector
6. Actuators & Power Electronics (“Muscles”)
$IFX (+1,58%) Infineon (DE) – Power Electronics
$ON (+1,88%) onsemi (US) – Power & Sensors
$TXN (+1,38%) Texas Instruments (US) – mixed-signal chips
$ADI (+1,76%) Analog Devices (US) – Signal Processing
$PH Parker-Hannifin (US) – Hydraulics/Pneumatics
$MP (+1,44%) MP Materials (US) – Magnets
$APH (+1,51%) Amphenol (US) – Connectors
$6481 (+1,36%) THK (JP) – Linear guides & actuators
$6324 (+2,33%)
Harmonic Drive (JP) – Precision gearboxes & servo drives for robotics
$6594 (+1,12%)
Nidec (JP) – Electric motors
$6506 (+2,55%)
Yaskawa (JP) – Drives & Robotics
$SU (+2,36%)
Schneider Electric (FR) – Energy & Control Solutions
$ZIL2 (-0,16%)
ElringKlinger (DE) – Battery & Fuel Cell Technology, Lightweight Construction
1. Parker-Hannifin, 2. MP Materials, 3. Infineon are my top 3 in this sector
7. Communications & Networking (“Nerves”)
$QCOM (+1,84%) Qualcomm (US) – Mobile Communications, Edge AI
$ANET (+1,84%) Arista Networks (US) – Networks
$CSCO (+1,47%) Cisco (US) – Networks, Security
$EQIX (+0,77%) Equinix (US) – Data centers
NTT Docomo (JP) – 5G/6G carrier – not a publicly traded company
$VZ Verizon (US) – Telecommunications
$SFTBY SoftBank (JP) – Carrier + Robotics
$ERIC B (+2,21%)
Ericsson (SE) – 5G/IoT infrastructure
$NOKIA (+2,63%)
Nokia (FI) – 5G/6G for Industry
$HPE (+1,61%)
Juniper Networks (US) – Networking – Acquired by HP
1. Arista Networks, 2. SoftBank, 3. Cisco are my top 3 in this sector
8. Energy
$3750 (+2,04%) CATL (CN) – Batteries
$6752 (+0,53%) Panasonic (JP) – Batteries
$373220 LG Energy (KR) – Batteries
$ALB (+1,75%) Albemarle (US) – Lithium
$LYC (+2,51%) Lynas (AU) – Rare Earths
$UMICY (-0,6%) Umicore (BE) – Recycling
WiTricity (US) – Inductive charging – not a publicly traded company
$ABBN (+2,52%) Charging (CH) – Charging infrastructure
$SLDP
Solid Power (US) – Solid-state batteries
Northvolt (SE) – European batteries – not a publicly traded company
$PLUG
Plug Power (US) – Fuel cells
$KULR (+2,75%)
KULR Technology (US) – Thermal management & battery safety for mobile systems
1. Albemarle, 2. CATL, 3. Panasonic are my top 3 in this sector
9. Cloud & Infrastructure
$AMZN (+1,25%) Amazon AWS (US) – Cloud, AI
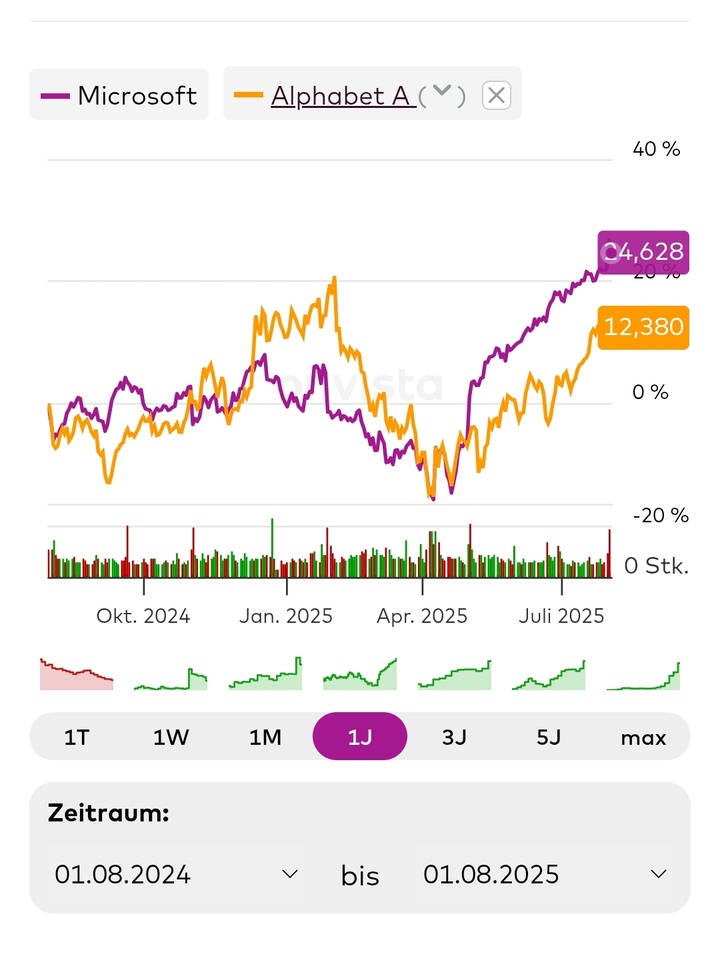
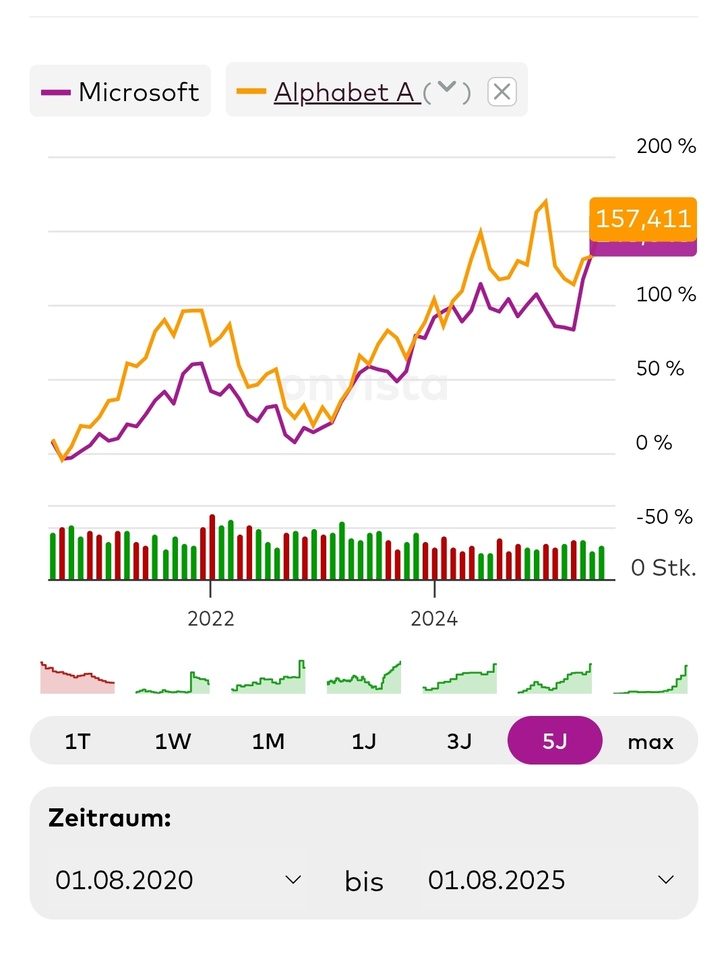
$MSFT (+1,36%) Microsoft Azure (US) – Cloud, AI
$GOOG (+1,12%) Alphabet Google Cloud (US) – Cloud, ML
$VRT (+2,14%)
Vertiv Holdings (US) – Data Center Infrastructure (UPS, Cooling, Edge)
$ORCL (+2,31%)
Oracle Cloud (US) – ERP + Cloud
$IBM (+1,15%)
IBM Cloud (US) – Hybrid Cloud + AI
$OVH (+8,55%)
OVHcloud (FR) – European Cloud
1. Alphabet, 2. Microsoft, 3. Oracle are my top 3 in this sector
10. Software & Data Platforms
$PLTR (+1,24%) Palantir (US) – Data Integration
$DDOG (+0,45%) Datadog (US) – Monitoring
$SNOW (+1,48%) Snowflake (US) – Data cloud
$ORCL (+2,31%) Oracle (US) – Databases, ERP
$SAP (+5,28%) SAP (Germany) – ERP systems
$SPGI S&P Global (US) – Financial/Market Data
ROS2 Foundation – Robotics Middleware – Not publicly traded
$NVDA (+0,33%) NVIDIA Isaac (US) – Robotics development – part of NVIDIA
$INOD (+1,92%) Innodata (US) – Data annotation & AI training data
$PATH (+1,34%)
UiPath (RO/US) – Robotic Process Automation
$AI (+0,85%)
C3.ai (US) – AI platform
$ESTC (+0,77%)
(NL/US) – Search & Data Analytics
1. S&P Global, 2. Palantir, 3. Datadog are my top 3 in this sector
11. End-user applications / Robots
$ABBN (+2,52%) ABB (CH/SE) – Industrial robots
$6954 (+2,9%) Fanuc (JP) – Industrial Robots
$TSLA (+0,79%) Tesla Optimus (US) – humanoid robot
$9618 (+0,35%) JD.com (CN) – Logistics robots
$AAPL (+0,06%) Apple (US) – Platform & UX
$700 (+2,16%) Tencent (CN) – Platform & AI
$9988 (+0,85%) Alibaba (CN) – Logistics & Platform
PAL Robotics (ES) – humanoid robots - not a publicly traded company
Neura Robotics (DE) – cognitive humanoid robots - not a publicly traded company
$TER (+2,72%) Universal Robots (DK) – cobots - part of Teradyne Corporation
Engineered Arts (UK) – humanoid robots – not a publicly traded company
$ISRG (+1%) Intuitive Surgical (US) – surgical robotics
$GMED (+0,16%)
Globus Medical (US) – surgical robotics (ExcelsiusGPS platform)
$7012 (-2,11%) Kawasaki Heavy Industries (JP) – industrial robots, automation
$CPNG (+1,26%) Coupang (KR) – logistics end-users
$IRBT
iRobot (US) – consumer robotics (e.g., Roomba); not humanoid, but features navigation and sensor fusion
Boston Dynamics (US) – humanoid & mobile robots—not a publicly traded company
Hanson Robotics (HK) – humanoid robots (Sophia)—not a publicly traded company
Agility Robotics (US) – “Digit” humanoid robot—not a publicly traded company
1. Apple, 2. Tencent, 3. Alibaba are my top 3 in this sector
🛠 2. Cross-sector enablers (shovel manufacturers) – featuring hidden champions
Raw Materials & Battery Materials
Albemarle · Lynas · Umicore
$SQM
SQM (CL) – Lithium
$ILU (-1,37%)
Iluka Resources (AU) – Rare Earths
$ARR (+10,35%)
American Rare Earths (US/AU) – New supply chains
My top pick in the sector is Albemarle
Manufacturing Technology
ASML · Applied Materials · Tokyo Electron
$LRCX (+2,88%)
Lam Research (US) – Plasma/etching processes
$ASM (+1,06%)
ASM International (NL) – ALD equipment
$MKSI (+1,76%)
MKS Instruments (US) – Plasma/vacuum technology
My top pick in the sector is ASML
Quality Assurance
Keysight · Advantest · Teradyne
$EMR (+1,38%)
National Instruments (US) – Measurement technology – from Emerson Electric Acquired
$300567
ATE Test Systems (CN) – Test systems
$FORM (+2,69%)
FormFactor (US) – Wafer probing
My number one in the sector is Keysight
Motion & Drive
Parker-Hannifin
Festo (Germany) – Pneumatics, Soft Robotics - not a publicly traded company
Bosch Rexroth (DE) – Drives, Controls - not a publicly traded company
$6481 (+1,36%)
THK (JP) – Linear guides
My top choice in the sector is Parker-Hannifin
Sensors/Imaging
$TDY Teledyne
$BSL (+0,94%) Basler (DE) – Industrial cameras
FLIR (US) – Thermal imaging sensors – Acquired by Teledyne
ISRA Vision (DE) – Machine vision – not a publicly traded company
My top pick in the sector is Teledyne
Magnets & Materials
MP Materials
$6501 (+3,66%)
Hitachi Metals (JP) – Magnetic Materials
VacuumSchmelze (DE) – Magnetic materials – not a publicly traded company
$4063 (-1,78%)
Shin-Etsu Chemical (JP) – Specialty materials
My top pick in the sector is MP Materials
Chip Design & Simulation
Synopsys · Cadence · ARM
$SIE (+2,11%)
Siemens EDA (DE/US)– Mentor Graphics—a strategic business unit of Siemens AG
Imagination Tech (UK) – GPU IP – not a publicly traded company
$CEVA (+3,13%)
CEVA (IL) – Signal processor IP
My top pick in the sector is Synopsys
Engineering & Lifecycle
PTC · Dassault · Siemens
Altair (US) – Simulation – no longer a publicly traded company
$HXGBY (+3,38%)
Hexagon (SE) – Measurement Technology
$SNPS (+1,67%)
ANSYS (US) – Simulation – Acquired by Synopsys
My top pick in the sector is Siemens
Networks & Data Centers
Arista · Cisco · Equinix
$HPE (+1,61%)
Juniper (US) – Networks – Acquisition by HPE
$DTE (+1,28%)
T-Systems (DE) – Industrial Cloud
$OVH (+8,55%)
OVHcloud (FR) – European cloud
My top pick in the sector is Arista
Cloud Infrastructure
AWS · Azure · Google Cloud
$ORCL (+2,31%)
Oracle Cloud (US) – ERP & Databases
$IBM (+1,15%)
IBM Cloud (US) – Hybrid Cloud
$9988 (+0,85%)
Alibaba Cloud (CN) – Asian cloud
$VRT (+2,14%)
Vertiv Holdings (US) – Cloud/Infrastructure
My top pick in the sector is Alphabet (Google)
Financial/Information Infrastructure
S&P Global
$MCO (-0,6%)
Moody’s (US) – Ratings
$MSCI (-0,08%)
MSCI (US) – Indices
$MORN
Morningstar (US) – Investment Research
My top pick in the sector is S&P Global
Creative/Experience Infrastructure
Adobe
$ADSK (+1,09%)
Autodesk (US) – CAD & Design
$U
Unity (US) – 3D/AR Simulation
Epic Games (US) – Unreal Engine – not a publicly traded company
My top pick in the sector is Adobe
Platform & Ecosystem
Apple · Tencent · Alibaba
$META (+1,54%)
Meta (US) – AR/VR, Social Robotics
ByteDance (CN) – AI & Platforms – not a publicly traded company
$9888 (+0,48%)
Baidu (CN) – AI & Cloud
My top pick in the sector is Tencent
Infrastructure/Edge
Dell
$HPE (+1,61%)
HPE (US) – Edge Computing
$SMCI
Supermicro (US) – AI Servers
$6702 (+5,99%)
Fujitsu (JP) – Edge & HPC
My top pick in this sector is Dell
Storage Solutions
Micron
$HY9H
SK Hynix (KR) – Memory
$285A (-0,12%)
Kioxia (JP) – NAND
$WDC
Western Digital (US) – Storage solutions
My top pick in the sector is Micron
🏛 3. Secondary Key Sectors with Hidden Champions
Financing & Capital
$GS (+1,42%) Goldman Sachs (US) – Investment bank; ECM/DCM, M&A, growth financing
$MS Morgan Stanley (US) – Investment bank; tech banking, capital markets
$BLK (+0,92%) BlackRock (US) – Asset manager; capital allocation, ETFs/index funds
$9984 (-0,2%) SoftBank Vision Fund (JP) – Mega-VC; growth equity in robotics/AI
Sequoia Capital (US) – Venture capital; early-stage/growth in AI/robotics – This is a classic venture capital fund
DARPA (US) – government R&D funding (robotics/defense) – independent research and development agency
EU Horizon (EU) – research funding/grants for DeepTech – Innovative Europe pillar
China State Funds (CN) – Government Industry/Technology Funds
Lux Capital (US) – VC for DeepTech - Uptake (US) – AI-based predictive maintenance
DCVC (US) – Focus on robotics and AI – Invests exclusively through VC fund investments
Speedinvest (AT) – EU VC for robotics – Investment is only available through fund participations
My number one in the sector is SoftBank
Maintenance & Service
$SIE (+2,11%) Siemens (DE) – Industrial Services, Lifecycle & Retrofit
$ABBN (+2,52%) ABB (CH/SE) – Robotics services, spare parts, field support
$GEHC (+0,33%) GE Healthcare (US) – Medtech services, including robotic systems
Uptake (US) – AI-based predictive maintenance – not a publicly traded company
Augury (US/IL) – Condition monitoring, condition diagnostics – not a publicly traded company
$KU2 KUKA Service (DE) – Robotics maintenance
$6954 (+2,9%) Fanuc Service (JP) – Global service network
Boston Dynamics AI Institute (US) – Robotics Longevity – funded by Hyundai Motor Group
My top pick in the sector is Siemens
Marketing & Advertising
$WPP (+1,97%) WPP (UK) – global advertising group; branding/communications
$OMC Omnicom (US) – marketing/PR network
$PUB (+1,67%) Publicis (FR) – communications/advertising group
$META (+1,54%) Meta (US) – digital ads (Facebook/Instagram)
$GOOG (+1,12%) Google Ads (US) – Search & Display Advertising
TikTok / ByteDance (CN) – Social Ads & Distribution - not a publicly traded company
$AAPL (+0,06%) Apple (US) – branding/UX; adoption & platform marketing
$WPP (+1,97%)
AKQA (UK/US) – Tech branding – Since 2012, majority-owned by the WPP Group, but continues to operate as autonomous operating unit
R/GA (US) – Innovation Marketing – not a publicly traded company
Serviceplan (DE) – Largest independent EU agency – not a publicly traded company
My number one in the sector is Meta
Law, Regulation & Ethics
ISO (CH) – international standards, robotics standards
TÜV (DE) – certification & safety testing
UL (US) – safety/conformity testing
EU AI Act (EU) – legal framework for AI & robotics
UNESCO AI Ethics (UN) – global ethical guidelines
Fraunhofer IPA (DE) – Robotics safety standards
ANSI (US) – Standards
IEC (CH) – Electrical Engineering Standards
Education & Talent
MIT (US) – Robotics/AI Research & Education
ETH Zurich (CH) – Autonomous Systems & Robotics
Stanford (US) – AI/Robotics Labs & Spin-offs
Tsinghua University (CN) – Robotics/AI in Asia
CMU (US) – Robotics Institute
EPFL (CH) – Robotics Research
TU Munich (DE) – “Roboy” humanoid robot
🌍 Top 25 Companies in Humanoid Robotics
These companies are crucial to the development and production of humanoid robots, because without them, crucial parts of the chain would be missing:
Chips & computing power (the robots’ brains)
$NVDA (+0,33%) Nvidia (US) – AI GPUs & Isaac platform, the foundation for robotics AI
$2330 TSMC (TW) – the world’s leading foundry, produces AI chips
$ASML (+2,12%) ASML (NL) – EUV lithography, indispensable for chip manufacturing
$005930 Samsung Electronics (KR) – memory, logic, foundry
$HY9H SK Hynix (KR) – DRAM & NAND memory for AI
$MU (+1,8%) Micron (US) – memory solutions for AI workloads
My top pick in the sector is ASML
Sensors & Perception (Robots’ Senses)
$SONY Sony (JP) – Image sensors, market leader
$6861 (+2,73%) Keyence (JP) – Industrial Sensors & Vision Systems
$CGNX (+1,7%) Cognex (US) – Machine vision, precise image processing
My top pick in this sector is Keyence
Actuators & Motion (Robot Muscles)
$IFX (+1,58%) Infineon (DE) – Power Electronics, Motor Control
$6594 (+1,12%) Nidec (JP) – Global market leader in electric motors
$PH Parker-Hannifin (US) – Hydraulics/Pneumatics, Motion Control
$6481 (+1,36%) THK (JP) – Linear guides & actuators
My top pick in this sector is Parker-Hannifin
Communications, Cloud & Infrastructure (Nerves & Data Flow)
$QCOM (+1,84%) Qualcomm (US) – Mobile & edge chips
$AMZN (+1,25%) Amazon AWS (US) – Cloud & AI infrastructure
$MSFT (+1,36%) Microsoft Azure (US) – Cloud, AI services
$CSCO (+1,47%) Cisco (US) – Networks & Security
$VRT (+2,14%) Vertiv Holdings (US) – Data Center Infrastructure
My top pick in this sector is Microsoft
End-User Applications & Platforms (Robots Themselves)
$TSLA (+0,79%) Tesla (US) – humanoid robots Optimus
$ABBN (+2,52%) ABB (CH/SE) – Robotics & Automation
$6954 (+2,9%) Fanuc (JP) – industrial robots & CNC systems
$7012 (-2,11%) Kawasaki Heavy Industries (JP) – industrial robots
PAL Robotics (ES) – humanoid robots (TALOS, ARI, TIAGo) – not a publicly traded company
Neura Robotics (DE) – cognitive humanoid robots – not a publicly traded company
Universal Robots (DK) – cobots
My top pick in the sector is Tesla
🇪🇺 Top 10 European Key Companies in Humanoid Robotics
$ASML (+2,12%)
ASML (NL)
Global market leader in EUV lithography – without ASML, there would be no modern chips for AI & robotics.
$IFX (+1,58%) Infineon (DE)
A leader in power electronics and motor control—crucial for the actuators of humanoid robots.
$STM (+3,31%)
STMicroelectronics (FR/IT)
Sensors, microcontrollers, and power chips—the foundation for control and perception.
$SAP (+5,28%)
SAP (DE)
ERP & data platforms, essential for integrating humanoid robots into industrial processes.
$SIE (+2,11%)
Siemens (DE)
Industrial software, automation, Digital Twin—key to engineering and lifecycle management.
$KU2 KUKA (DE)
Robotics pioneer, industrial robots & automation—expertise in humanoid motion mechanics.
PAL Robotics (ES) - not a publicly traded company
Specialist in humanoid robots (TALOS, ARI, TIAGo), used internationally in research and service.
Neura Robotics (DE) - not a publicly traded company
Young high-tech company developing cognitive humanoid robots with advanced AI (4NE-1).
Universal Robots (DK) - not a publicly traded company
Market leader in cobots—a platform for safe human-robot collaboration.
Engineered Arts (UK) - not a publicly traded company
Develops humanoid robots such as Ameca, known for realistic facial expressions and gestures—important for HRI (Human-Robot Interaction)
🌏 Top 10 Key Asian Companies in Humanoid Robotics
$2330
TSMC (Taiwan)
The world’s largest semiconductor foundry, producing high-end chips (e.g., Nvidia, AMD, Apple)—without TSMC, there would be no AI hardware.
$005930
Samsung Electronics (South Korea)
Foundry, memory, logic chips, image sensors—extremely broad portfolio of robotics components.
$HY9H
SK Hynix (South Korea) – Memory
$SONY
Sony (Japan)
Market leader in CMOS image sensors, essential for robotic vision and perception.
$6861 (+2,73%)
Keyence (Japan)
Sensors and machine vision for industrial automation, widely used in robotics.
$6954 (+2,9%)
Fanuc (Japan)
Industrial robots and CNC systems; one of the world’s leading manufacturers of robotics hardware.
$6506 (+2,55%)
Yaskawa Electric (Japan)
Drives, motion control, and robotic arms—relevant for humanoid motion control.
$6594 (+1,12%)
Nidec (Japan)
Global market leader in electric motors (ranging from mini motors to high-performance drives).
$7012 (-2,11%)
Kawasaki Heavy Industries (JP) – Industrial robots
$9618 (+0,35%)
JD.com (China)
A driving force in robotics for e-commerce and logistics; invests in humanoid robotics applications