Hi everyone,
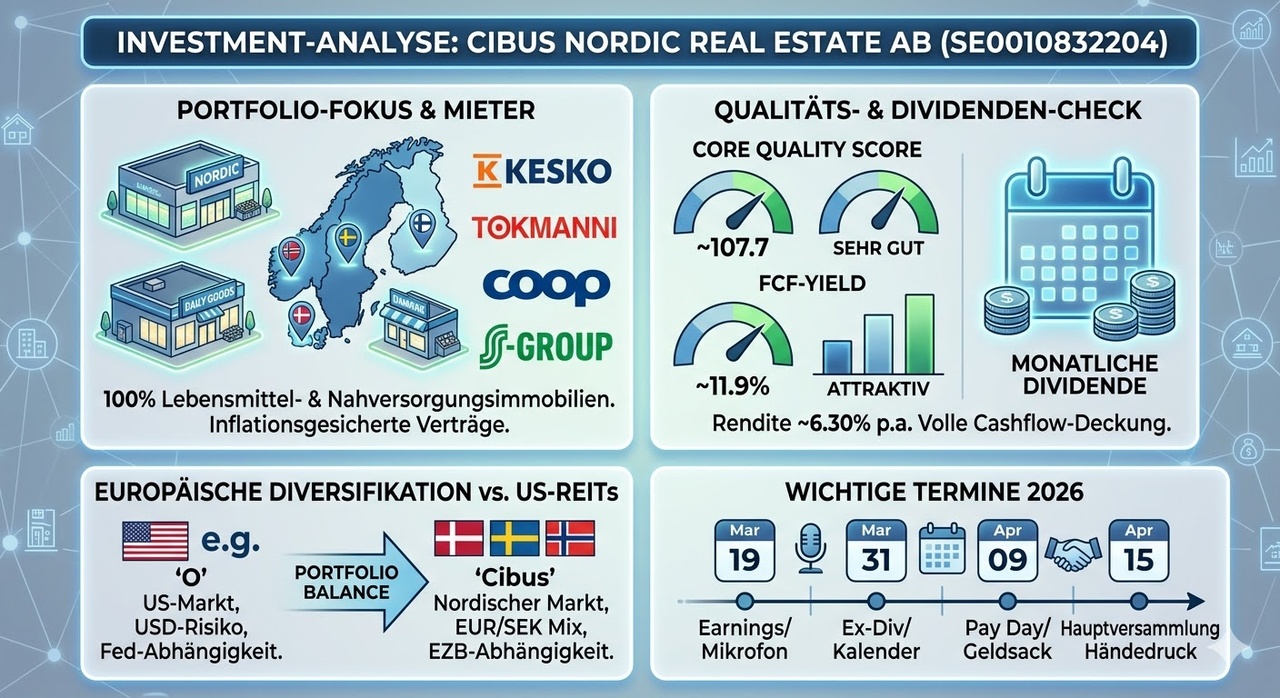
Since the latest quarterly figures were released today, I took the opportunity to review the fundamentals on our Side A (dividend/net asset value) with an additional purchase. The monthly dividend payer from Sweden is performing well :)
The operating business involving Scandinavian supermarket real estate (tenants such as Kesko, ICA, and Coop) is running like a Swiss watch. Here’s the unbiased breakdown of the raw numbers from the Q2 report, converted to euros:
https://www.cibusrealestate.com/investors/financial-reports/
1. Core Quality Formula (revenue growth + margin)
- Revenue growth: Rental income rose in Q2 to 46.2 million EUR (previous year: EUR 41.3 million). That represents a double-digit increase of 11.8%, driven primarily by lease agreements that are almost entirely indexed to inflation.
- Operating Margin (Net Profit Margin): Stood at a phenomenal 97.6% (net cash flow of EUR 45.1 million).
- Core Quality Score: 11.8% + 97.6% = 109.4 (Our target is >25 for top quality. This figure absolutely blows that target out of the water).
2. Cash Flow & Dividend Check (The Most Important Criterion)
For a dividend stock with monthly payouts, the all-important question is: Is the dividend paid out of assets or on credit, or is it genuinely earned?
- Operating Cash Flow (H1/2026):
73.2 million EUR. - Capital Expenditures (CapEx in the Portfolio): Only 8.4 million EUR.
- Free cash flow (FCF) in the first half of the year:
64.8 million EUR. - Dividend paid (H1/2026):
36.9 million EUR. - Conclusion: Free cash flow more than comfortably covers the dividend. The payout of EUR 0.90 per year (corresponding to a solid yield of just under 7.0%) is absolutely crisis-proof and earned organically.
3. Net Asset Value (P/B Ratio) & Valuation
- Equity-Adjusted Book Value (EPRA NRV):
13.00 EUR per share (previous year: 12.80 EUR). - At our purchase price of approximately 12.87 EUR (96 DKK), we are therefore acquiring the portfolio at a slight discount to the fair net asset value of the properties (P/B ratio of 0.99).
- The projected P/E ratio for 2026 is a very favorable 12.7x.
4. Debt Review (Have We Weathered the Interest Rate Turn?)
- Leverage ratio (net debt/property value): Remains stable at 59.1% —right within the healthy management target range of 55% to 65%.
- Interest Rate Hedging: A massive 96% of all debt is hedged long-term via swaps and interest rate caps. The average interest rate remains consistently at a very manageable 4.0%. The interest coverage ratio (Räntetäckningsgrad) stands at a solid 2.4x.
Overall conclusion:
No half-baked compromises, no interest rate house of cards. Cibus delivers an excellent operating report, is achieving double-digit revenue growth, and easily covers its dividend from free cash flow. A first-class, defensive cash generator with a solid foundation.