
Mid-May 2025 sees the tanker market riding dynamic waves. Very Large Crude Carriers (VLCCs) soften but eye an OPEC+ rally, Suezmax vessels pivot to long-haul Black Sea exports, Aframax faces softening rates, and Clean markets surge with LR2/LR1 gains. U.S.-China tariff relief, Iranian sanctions, and South Korean crude imports shape the horizon, while CPC pipeline shifts and Red Sea dynamics add intrigue. This sector is a tanker navigating global currents—let’s chart its course.
⏬ VLCC Market: Softening with OPEC+ Hopes
Rate Declines
VLCCs, the giants of crude transport, soften but hold steady for a potential rebound. The Baltic Exchange’s TD3C (270,000 mt Middle East Gulf-to-China) climbs 5 points to WS64.35, yielding a round-trip time-charter equivalent (TCE) of $45,668 per day. West Africa-to-China (TD15) rises 2 points to WS63.19 ($44,743 per day), but U.S. Gulf-to-China (TD22) drops $352,500 to $8.197 million ($43,043 per day). Clarksons’ fleet-weighted average falls 17.5% week-on-week to $45,600 per day, down from $53,900. Middle East Gulf (MEG) rates hover at WS60, with Petrobras’ Brazil export cargo fixed at WS61 after three replacements—VLCCs brace for June cargoes.
Cargo Dynamics
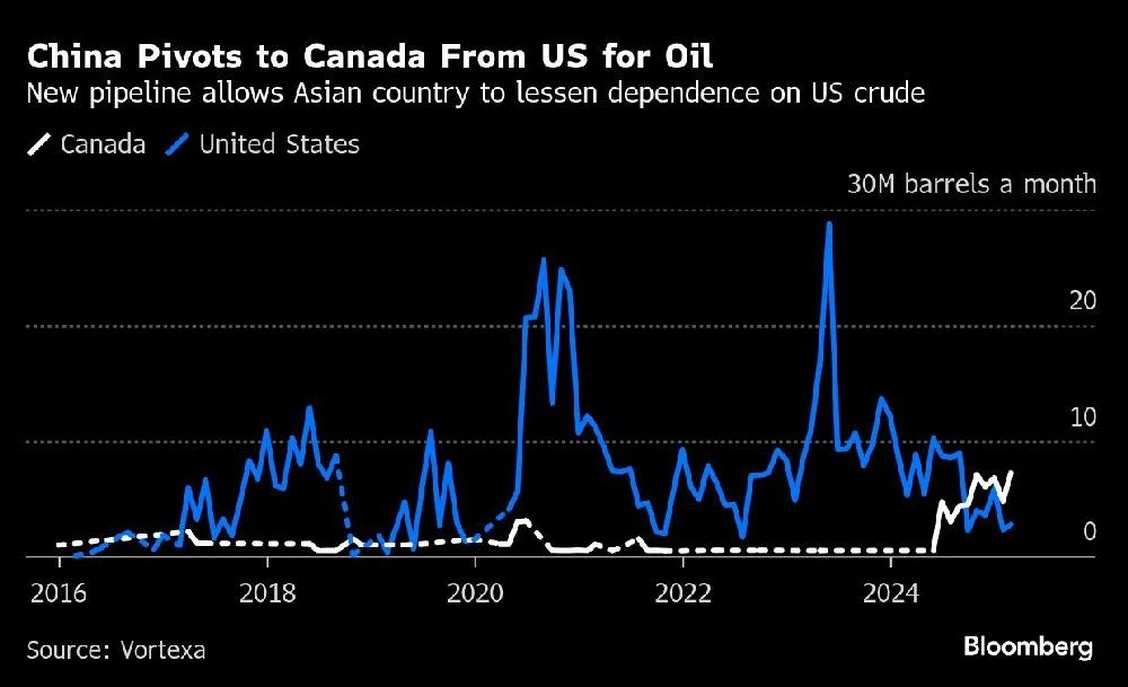
MEG sees an influx of end-May cargoes, with June laycans drawing charterer interest in the first decade, signaling nervousness. China’s crude imports (11 million bpd in April) and South Korea’s record 20 million barrels of U.S. crude in May drive VLCC demand. OPEC+’s production hike (411,000 bpd in May-June) adds four to five VLCCs, per Clarksons, with full impact expected by Q3. U.S. sanctions blacklist a 305,700-dwt VLCC for Iranian oil, risking disruptions. A balanced MEG position list and tightening tonnage control buoy sentiment—VLCCs anticipate an OPEC+-fueled uptick.
Global Forces
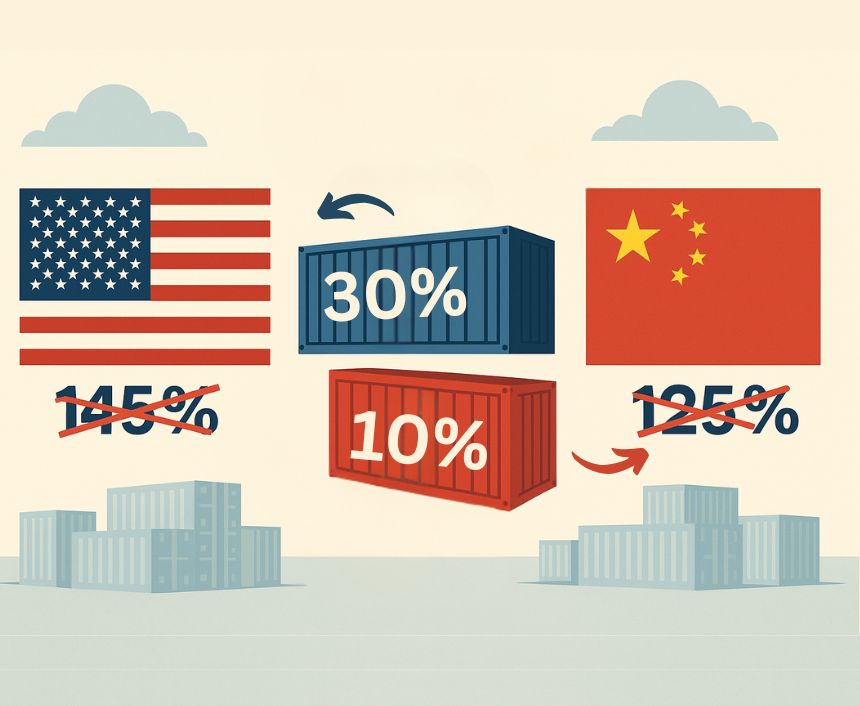
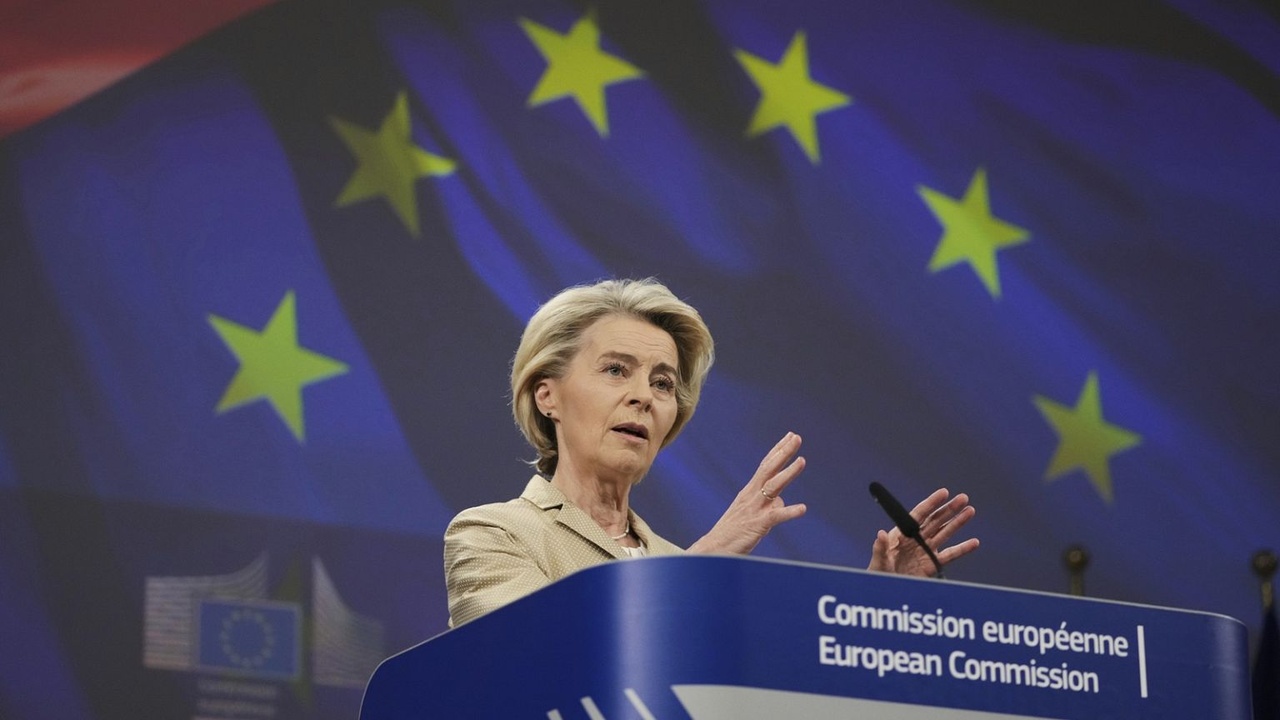
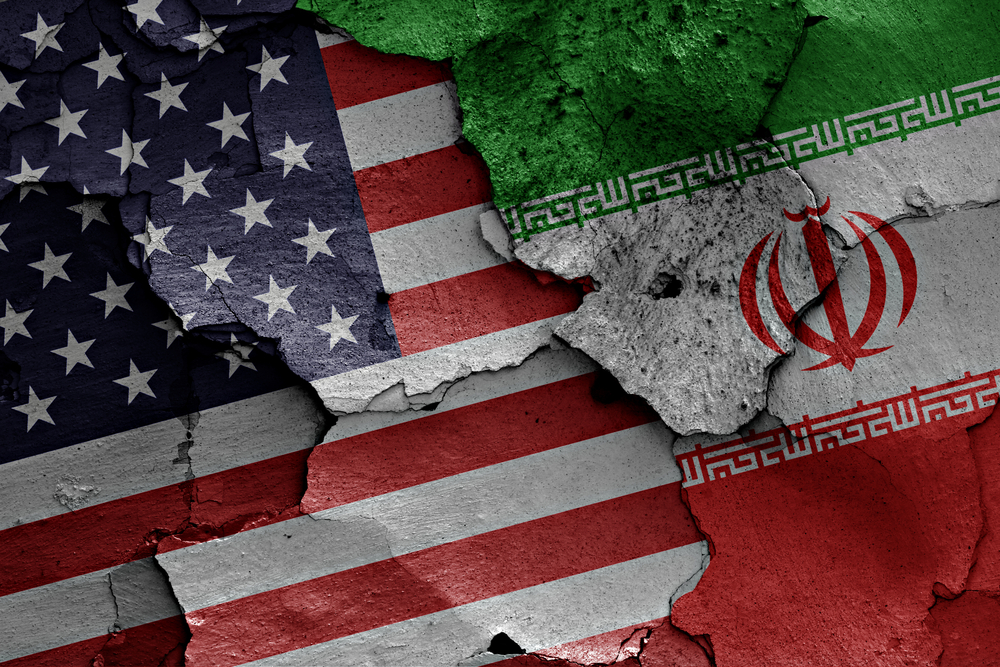
U.S.-China tariff reductions (effective May 14) ease trade pressures, boosting sentiment. A potential Iran nuclear deal could lift sanctions, per Okeanis, prompting NITC to renew its aging VLCC fleet and support asset values. EU sanctions target 189 Russian shadow fleet vessels, impacting crude flows to China and India. Red Sea rerouting persists, supporting tonne-miles, but a Houthi ceasefire could normalize routes. Clarksons forecasts 2.4% crude fleet growth in 2026, outpacing 0.5% demand, but OPEC+ hikes signal upside—VLCCs sail with cautious optimism.
⏳ Suezmax Market: Black Sea Pivot
Rate Stability
Suezmax vessels, critical for Black Sea and West African crude, hold steady with a structural shift. The Baltic’s TD20 (130,000 mt Nigeria-to-UK Continent) stabilizes at WS86.5-87.5 ($34,500 per day). Guyana-to-UK Continent (TD27) eases 3 points to WS82.5-83.5 ($32,171 per day, Rotterdam discharge). CPC-to-Augusta (TD6) hovers at WS110 ($43,800 per day), and Middle East-to-Mediterranean (TD23) remains at WS87.5-88. Clarksons’ Suezmax average drops 6.3% to $38,800 per day. Charterers limit upside by discreetly securing vessels, but tightening lists signal activity—Suezmax adapts to new trade patterns.
Regional Trends
The Black Sea sees Suezmax dominance, with 63.4% of CPC pipeline exports (Kazakhstan crude blend) versus 36.6% for Aframax, driven by long-haul Asian demand (India at 8.1%, China at 5.7%). A large June CPC program and Chevron’s Tengiz expansion boost volumes. Atlantic markets clear backlog, with U.S. Gulf and Liza runs absorbing European tonnage. MEG fundamentals weaken, with TD23 on subs at WS97.5, though Basrah stems add activity. Ballasters head to the Cape of Good Hope, easing oversupply—Suezmax leverages Black Sea efficiency.
External Pressures
U.S.-China tariff relief supports U.S. crude exports, potentially increasing Suezmax demand if Chinese purchases rise, per Fearnley. EU sanctions on Russian shadow fleets and U.S. blacklisting of Iranian facilitators (e.g., CCIC Singapore) raise risks. A potential Iran nuclear deal could shift trade to mainstream fleets, per Okeanis. Clarksons’ 2026 forecast (2.4% fleet growth, 0.5% demand) pressures rates, but CPC’s long-haul shift and OPEC+ hikes offer upside—Suezmax navigates with strategic confidence.
⏱️ Aframax Market: Softening Pressure
Rate Declines
Aframax vessels, versatile crude carriers, face softening rates across key regions. The Baltic’s TD7 (80,000 mt Cross-UK Continent) drops 10 points to WS113.75 ($26,600 per day, Hound Point-to-Wilhelmshaven). Cross-Mediterranean (TD19) falls 27 points to WS117.72 ($22,261 per day, Ceyhan-to-Lavera). East Coast Mexico/U.S. Gulf (TD26) and Covenas/U.S. Gulf (TD9) rise 13 points to WS154.17 ($34,300 per day) and WS151.88 ($32,700 per day). U.S. Gulf-to-UK Continent (TD25) slips 2 points to WS148.33 ($35,251 per day). Clarksons’ average drops 13% to $33,200 per day—Aframax grapples with oversupply.
Market Dynamics
North Sea activity slows, with rates softening as own vessels and Suezmax units absorb stems, pushing natural windows to the third decade. Mediterranean rates plummet due to excessive tonnage, with owners dropping rates to compete. U.S. Gulf local routes firm, but trans-Atlantic runs weaken. A 70,600-dwt Aframax is sanctioned for Iranian oil, risking availability. Ballasters arrive for third-decade cargoes, but quiet enquiry threatens sentiment. C3is reports its Aframax at $46,000 per day, reflecting spot market resilience—Aframax seeks demand catalysts.
Broader Forces
U.S.-China tariff relief could boost U.S. crude exports, supporting Aframax, but Red Sea normalization risks tonne-mile losses. EU sanctions on 189 Russian vessels and CPC’s Suezmax shift reduce Aframax’s Black Sea share. Clarksons’ 2026 forecast (2.4% fleet growth, 0.5% demand) and potential Iranian fleet renewal (post-sanctions) pressure rates. South Korea’s 20 million-barrel U.S. crude imports and OPEC+ hikes offer upside, but Mediterranean oversupply clouds prospects—Aframax navigates with cautious resilience.
⏸️ Clean Market: Surging Fortunes
Rate Gains
Clean tanker markets shine, with LR2 and LR1 leading gains. LR2 TC1 (75kt MEG/Japan) jumps from WS112.78 to WS141.67, yielding a TCE over $30,000 per day; TC20 (90kt MEG/UK-Continent) rises $575,000 to $3.83 million. LR1 TC5 (55kt MEG/Japan) adds 26.25 points to WS160.63, and TC8 (65kt MEG/UK-Continent) climbs from $2.72 million to $3.09 million. MR TC17 (35kt MEG/East Africa) reaches WS223, but UK-Continent TC2 (37kt ARA/U.S. Atlantic) falls 8.44 points to WS117.19 ($9,493 per day). Handymax TC6 (30kt Cross-Mediterranean) rises from WS131.94 to WS141.94—Clean markets ride a robust wave.
Trade Patterns
MEG LR2/LR1 markets surge with strong enquiry, tightening tonnage lists. UK-Continent MRs weaken due to cancellations, with TC2 and TC19 (37kt ARA/West Africa) dropping to WS136.39. U.S. Gulf MRs decline, with TC14 (38kt UK-Continent) at WS83.21 and TC21 (38kt Caribbean) at $425,000. South Korea’s high U.S. crude imports (540,000 bpd in April) and rising refinery margins post-maintenance support clean trades. Hafnia reports improved Q2 rates ($24,839 per day, 57% booked), driven by global demand—Clean tankers capitalize on regional strength.
Influencing Factors
U.S.-China tariff relief boosts sentiment, per Clarksons, supporting clean fuel trades. Red Sea disruptions increase tonne-miles, though normalization could boost short-haul volumes. Clarksons forecasts 6.3% clean fleet growth in 2026, pressuring rates, but rising global demand and low newbuild orders (per Hafnia) signal upside. U.S. sanctions on Iranian oil facilitators and EU’s Russian shadow fleet blacklist raise risks. South Korea’s inventory build (100 million barrels) and OPEC+ hikes fuel clean demand—Clean markets balance opportunity with supply risks.
🌐 What’s Moving It: Trade Shifts and Sanctions
Commodity Shifts
South Korea’s 20 million-barrel U.S. crude imports (May) and China’s 11 million bpd drive VLCC demand. CPC pipeline exports (Kazakhstan crude) shift to Suezmax, with long-haul Asian flows (India at 8.1%, China at 5.7%). OPEC+’s 411,000 bpd hike boosts crude volumes, while South Korea’s inventory build and rising refinery margins support clean trades. U.S. crude exports to China could rise post-tariff relief, per Fearnley, adding tonne-miles. Reduced coal/grain shipments increase segment competition—commodity shifts shape tanker dynamics.
Trade and Policy Pressures
U.S.-China tariff reductions (24% cut, effective May 14) ease trade constraints, boosting shipping sentiment. U.S. sanctions target Iranian oil facilitators (e.g., CCIC Singapore, Sepehr Energy) and a VLCC/LR1, risking disruptions. EU sanctions blacklist 189 Russian shadow fleet vessels, impacting crude flows to China/India. A potential Iran nuclear deal could lift sanctions, prompting NITC fleet renewal, per Okeanis. Red Sea normalization and 2026 fleet growth (2.4% crude, 6.3% clean) pressure rates, but OPEC+ hikes offer upside—policies steer the tanker path.
🌐 Market and Stocks: Navigating Opportunities
Stock Performance
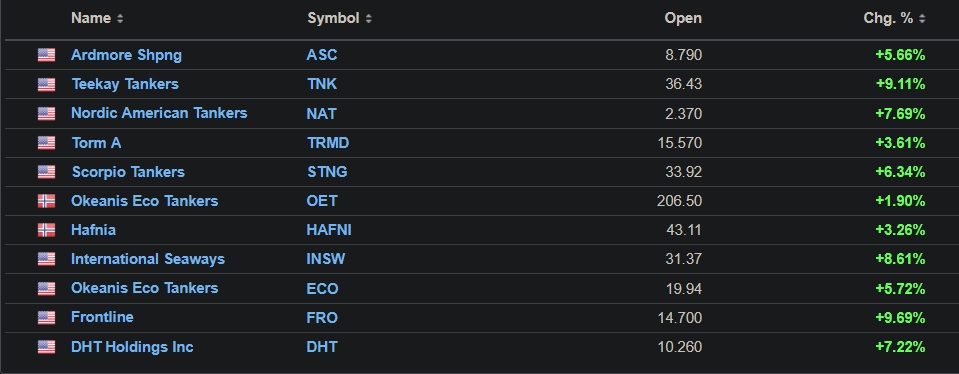
Tanker stocks reflect mixed fortunes. Teekay Tankers $TNK (+0,6%) reports $76 million net earnings (Q1, down from $148.9 million), with a $1 per share dividend disappointing analysts. Okeanis Eco Tankers $OET (-0,1%) earns $12.6 million (Q1), with Q2 VLCC rates at $46,700 per day (72% booked). Hafnia’s $HAFNI (-0,15%) net earnings drop to $63.2 million (from $219.6 million), but Q2 rates rise to $24,839 per day. Torm $TRMD A (-0,61%) gains 6% after a Pareto “buy” upgrade, targeting DKK 137. C3is reports $7.9 million profit, with its Aframax at $46,000 per day—stocks balance softening rates with trade optimism.
Investor Insights
VLCCs eye an OPEC+ rally, but sanctions pose risks. Suezmax benefits from CPC’s long-haul shift, though Atlantic oversupply lingers. Aframax faces Mediterranean pressure, but U.S. Gulf strength offers upside. Clean markets (LR2/LR1) surge, though MR/Handymax face 2026 headwinds (6.3% fleet growth). Hafnia’s 80% payout and Torm’s undervaluation signal confidence. U.S.-China tariff relief and potential Iranian sanctions lift could boost tonne-miles, per Fearnley. Investors weigh geopolitical risks against supply constraints—strategies target long-term demand.
Sector Outlook
Sanctions, Red Sea dynamics, and tariff relief shape volatility, but OPEC+ hikes and South Korean imports drive demand. Clarksons’ 2026 forecast (crude steady, clean softening) highlights clean oversupply risks. LR2/LR1 and Suezmax benefit from trade shifts, while Aframax and MR navigate regional challenges. Stocks like Okeanis (strong Q2 bookings) and Hafnia (fleet scale) offer value if demand holds—investors balance short-term dips with long-term fundamentals.
🌐 Outlook: Charting Future Waves
Market Projections
VLCC ranges $43,000-$46,700 per day—OPEC+ hikes signal upside—optimistic. Suezmax at $32,000-$43,800—Black Sea shift sustains—steady. Aframax at $22,000-$35,300—Mediterranean weakness persists—challenged. Clean varies: LR2/LR1 at $30,000-$35,000 (surging), MR at $9,500-$20,000 (mixed), Handymax at $10,000-$14,000 (stable)—buoyant. Sanctions and fleet growth signal volatility—2026 could soften for clean markets.
Strategic Horizons
VLCCs leverage OPEC+ and South Korean imports, but Suezmax thrives on CPC’s Asian pivot. Aframax needs U.S. Gulf demand, while LR2/LR1 capitalizes on clean fuel trades. Handymax stabilizes, but MR risks stagnation without new cargoes. Sanctions, 2026 fleet growth (6.3% clean), and trade talks challenge margins, but low crude fleet growth (2.4%) and Iranian fleet renewal offer upside. Investors navigate trade shifts while betting on supply constraints—strategic moves will define tanker fortunes.
Your Call
Will VLCCs lead with an OPEC+ rally, or can Clean markets’ surge steal the spotlight? Share your take—let’s conquer the markets! 🚢
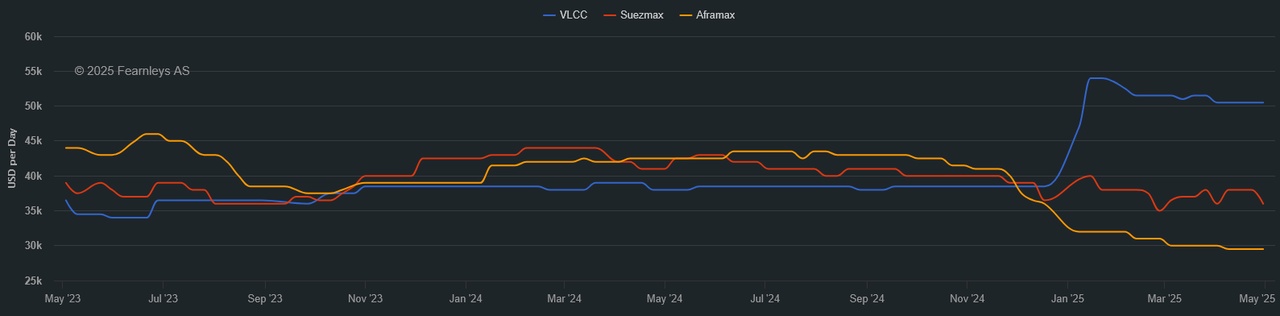
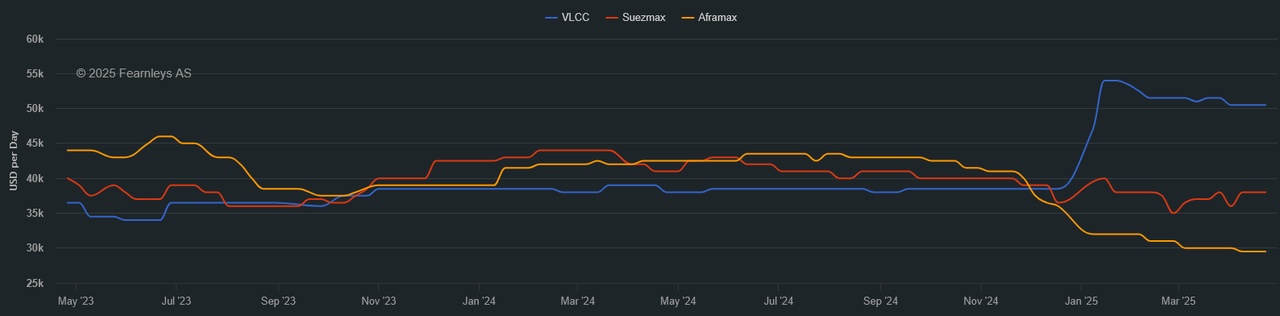
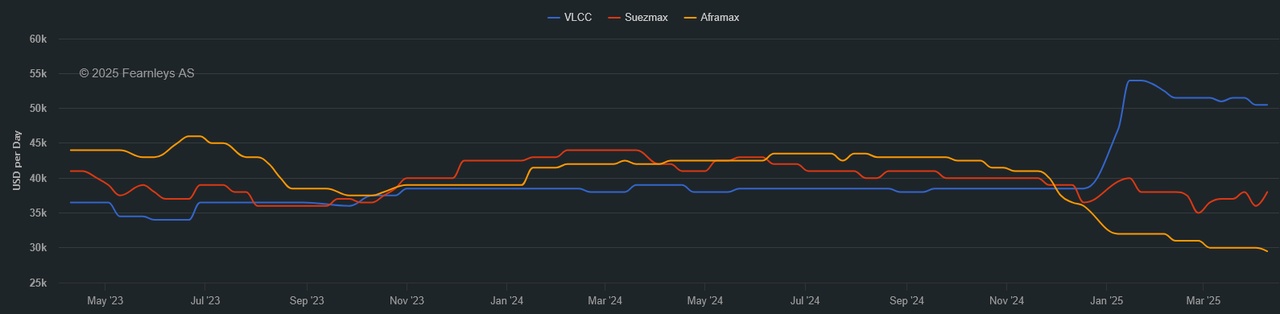
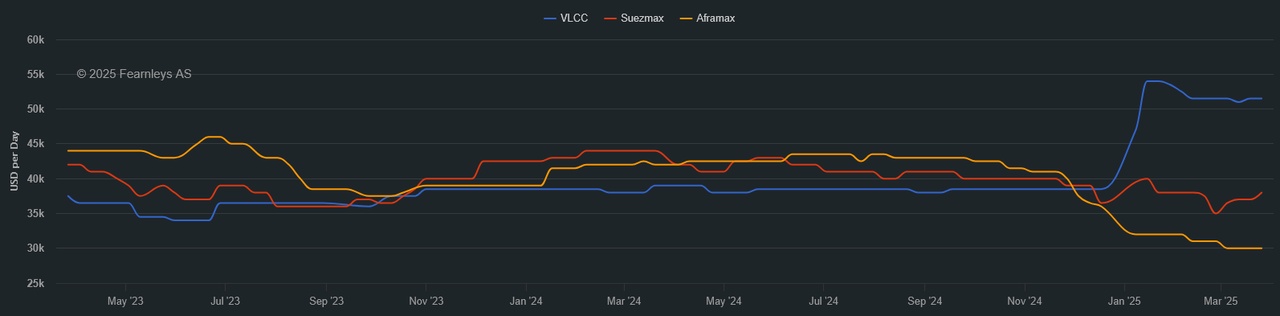
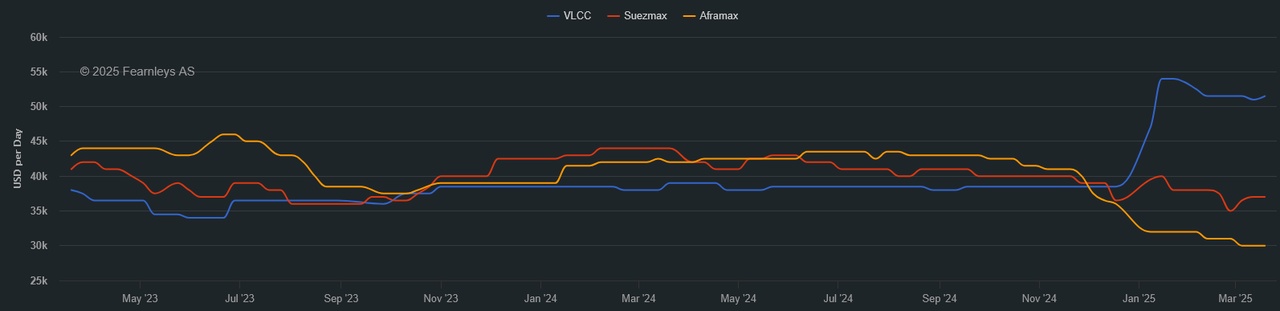
1 Year T/C - VLCC SUEZMAX AFRAMAX ECO / SCRUBBER - May 14th
*The Worldscale (WS) rate is a system used to calculate tanker freight rates, where WS 100 represents a standard base rate for a specific route. Rates above or below this benchmark indicate how much more or less a charterer will pay relative to the base cost. A higher WS rate means better earnings for shipowners, while a lower WS rate means lower transportation costs for charterers.