
Mid-May 2025 finds the tanker market battling turbulent seas. Very Large Crude Carriers (VLCCs) soften after a bank holiday slowdown, Suezmax grapples with Atlantic oversupply, Aframax maintains resilience, and Clean markets show mixed fortunes with LR2/LR1 weakening and MR stabilizing. U.S. sanctions on Iranian oil, a Houthi ceasefire, and OPEC+ production hikes shape the horizon, while Russian-Chinese crude blends and U.S.-India flows offer opportunities. This sector is a tanker weathering global storms—let’s chart its course.
⏬ VLCC Market: Softening Under Pressure
Rate Declines
VLCCs, the behemoths of crude transport, face a softening market after a brief rally. The Baltic Exchange’s TD3C (270,000 mt Middle East Gulf-to-China) rate drops 6.5 points to WS59.55, yielding a round-trip time-charter equivalent (TCE) of $41,547 per day, down $8,000 from last week. West Africa-to-China (TD15) falls 4 points to WS61.69 ($44,561 per day), and U.S. Gulf-to-China (TD22) declines $186,533 to $8.66 million ($48,578 per day). Clarksons’ fleet-weighted average dips to $50,583 per day, cooling from mid-April’s $59,700 peak. A bank holiday and quiet Middle East Gulf (MEG) fixtures push TD3C to the low WS60s, with charterers leveraging a growing tonnage list—VLCCs navigate a cautious descent.
Cargo Dynamics
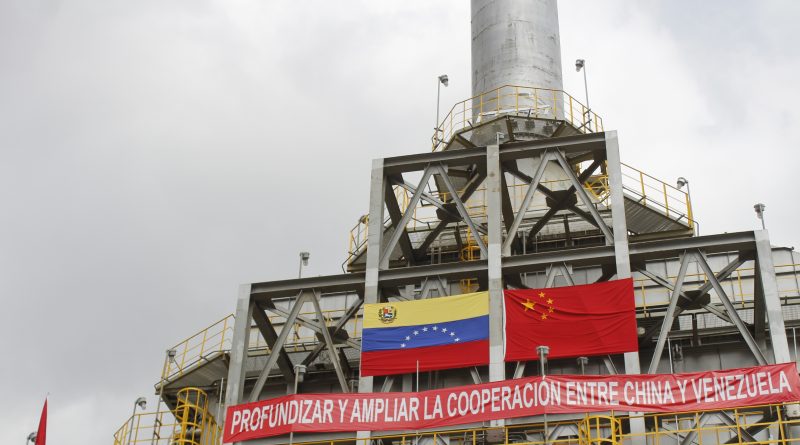
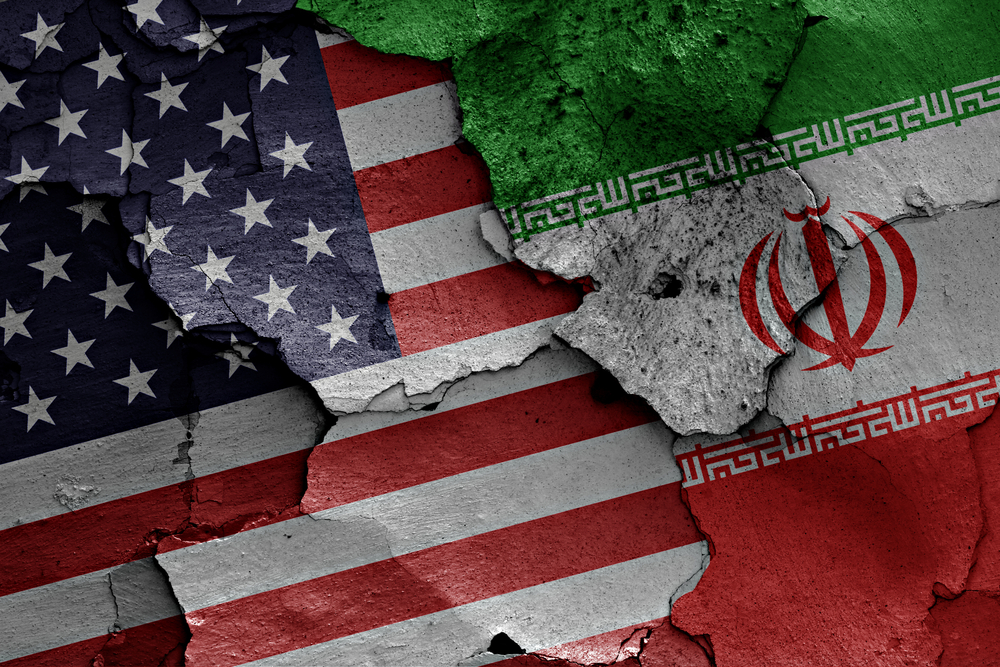
China’s crude imports (11 million bpd in April) sustain VLCC demand, driven by Iranian (1.71 million bpd) and Russian cargoes, but new U.S. sanctions target four VLCCs delivering Iranian oil to China, risking disruptions. Two VLCCs (310,000-dwt and 303,100-dwt) discharge Russian-Chinese crude blends in Venezuela, spoofing AIS to mask destinations. U.S. crude flows to India surge to 470,000 bpd in June, the highest since August 2023, fueled by WTI discounts and tariff delays. OPEC+’s June production hike (411,000 bpd, led by Saudi Arabia) adds four to five VLCCs, but third-decade MEG fixtures remain slow (8 million barrels covered)—VLCCs balance opportunity with sanctions risks.
Global Forces
U.S.-China trade talks (May 11) and potential tariff exemptions (e.g., for energy) create uncertainty, with VLCC asset values holding firm (five-year-old 320,000-dwt at $109.21 million). A Houthi ceasefire may reopen the Red Sea, reducing tonne-miles but boosting short-haul volumes. UK sanctions target 100 shadow fleet tankers (worth $24 billion in 2024), impacting Russian crude flows. Red Sea rerouting persists, supporting TCEs, but low fleet growth (2.4% in 2026) and OPEC+ hikes signal upside. Clarksons notes rising inventories could lift rates in a contango market—VLCCs sail with guarded optimism.
For illustrative purposes only
⏳ Suezmax Market: Atlantic Oversupply
Rate Weakness
Suezmax vessels, vital for West African and Black Sea crude, face mounting pressure. The Baltic’s TD20 (130,000 mt Nigeria-to-UK Continent) drops nearly 10 points to WS89.44, yielding a TCE of $37,051 per day. Guyana-to-UK Continent (TD27) falls 13 points to WS88.33 ($36,042 per day), and CPC-to-Augusta (TD6) collapses 21 points to WS109.15 ($44,500 per day) as CPC charterers use owned tonnage. Middle East-to-Mediterranean (TD23) slips to just below WS90. Rates hit $58,821 per day in April but soften to $52,954 by May 5, with U.S. Gulf replacements at WS85 signaling further declines—Suezmax struggles in an oversupplied Atlantic.
Regional Trends
West Africa sees weak enquiry, with 20+ Suezmax vessels available and 15 options within a five-day window, pushing TD20 toward WS90. U.S. Gulf softness (replacements at 145x85) and transatlantic activity (six options absorbed) limit upside. Black Sea TD6 weakens as CPC demand drops, with only eight third-decade stems remaining. China’s Kazakhstan CPC crude imports (240,000 bpd) and Norway’s Johan Castberg field (135,000 bpd) support rates, but West African barrel sales lag, requiring prompt fixtures. East of Suez markets appear overtonnaged, with ballasters heading to the Cape of Good Hope despite TD20’s decline—Suezmax seeks new demand sources.
External Pressures
U.S. port fees exempt sub-80,000 dwt Suezmax units, and energy tariff exemptions (except LNG) reduce disruptions, per Torm’s CEO. Houthi ceasefire talks could normalize Red Sea routes, offsetting tonne-mile gains with short-haul volumes. U.S. sanctions on Iranian oil and UK’s shadow fleet blacklist (400+ vessels) increase risks. Kazakhstan’s 1.7 million bpd output sustains CPC exports, but OPEC+ cuts (down 160,000 bpd in April) temper volumes. Clarksons forecasts 2.4% crude fleet growth in 2026, outpacing 0.5% demand, signaling rate pressure—Suezmax navigates a challenging outlook.
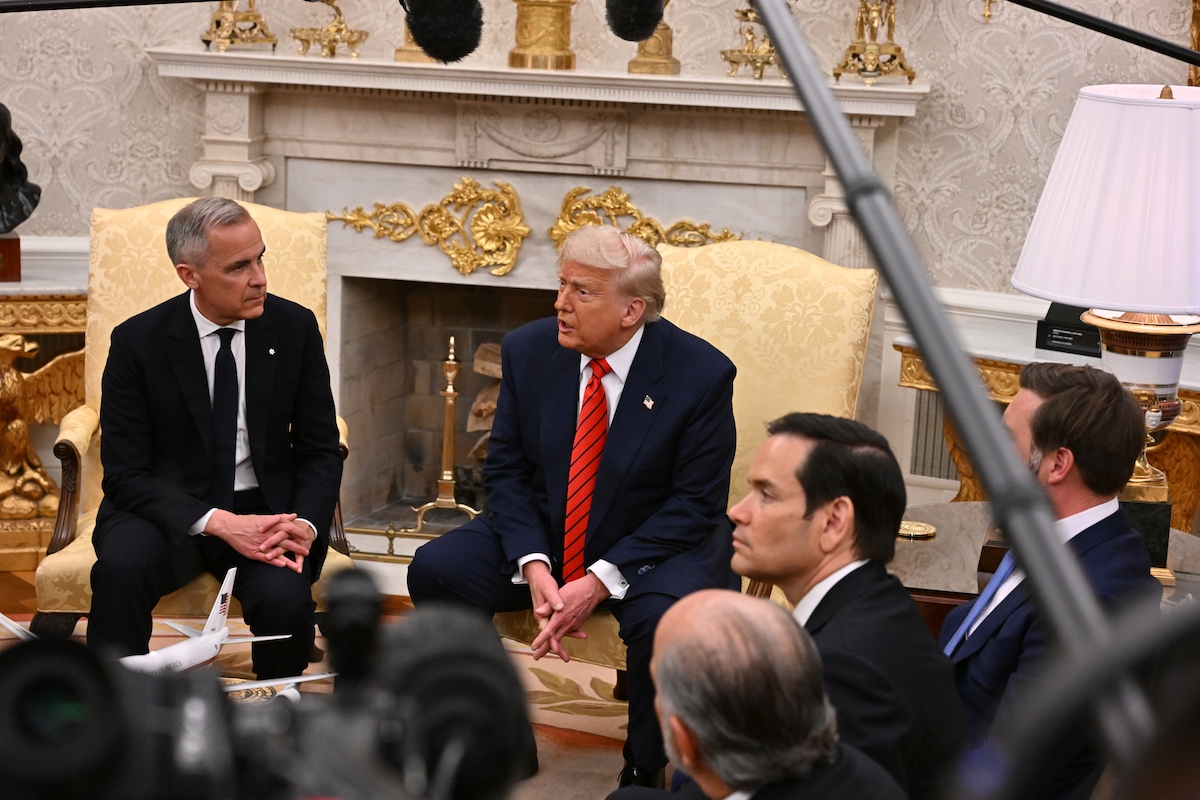
Trump announces the ceasefire during a meeting at the Oval office May 6, 2025
⏱️ Aframax Market: Resilient but Tested
Rate Stability
Aframax vessels, versatile crude carriers, hold steady amid softening trends. The Baltic’s TD7 (80,000 mt Cross-UK Continent) drops 7 points to WS125 ($39,100 per day, Hound Point-to-Wilhelmshaven). Cross-Mediterranean (TD19) falls 20 points to WS155 ($43,500 per day, Ceyhan-to-Lavera). Atlantic routes weaken, with East Coast Mexico/U.S. Gulf (TD26) and Covenas/U.S. Gulf (TD9) tumbling 28 points to WS140 ($29,100 and $28,800 per day). U.S. Gulf-to-UK Continent (TD25) remains at WS149-150 ($36,300 per day). Rates hit $51,450 per day in April but fall to $40,260 by May 5, yet strategic repositioning sustains resilience—Aframax balances stability with pressure.
Market Dynamics
North Sea rates weaken with growing tonnage lists, though second-decade stems offer activity. Mediterranean markets soften as Libyan and Ceyhan dates advance, with prompt tonnage oversupply. U.S. Gulf sees Aframax rates drop to 145x72.5, with no Suezmax spillover and weak Nigerian crude sales. Two Aframax vessels face U.S. sanctions for Iranian oil transfers, risking availability. Norway’s Johan Castberg (135,000 bpd) and Kazakhstan’s CPC crude support rates, but Atlantic oversupply caps gains. Signal Group’s repositioning to U.S. Gulf/Central Europe achieves $60,700 per day for May (27% fixed)—Aframax holds firm, eyeing new cargoes.
Broader Forces
U.S. port fee exemptions benefit sub-80,000 dwt Aframax vessels, and tariff exemptions for energy minimize disruptions. Houthi ceasefire talks may reduce Red Sea rerouting, but short-haul volumes could offset losses. U.S. and UK sanctions (e.g., 100 shadow fleet tankers) deter operators, while Red Sea disruptions boost tonne-miles. Clarksons’ 2026 forecast (2.4% crude fleet growth, 0.5% demand) signals rate pressure, but Johan Castberg’s 220,000 bpd by Q2 and U.S.-India crude flows (470,000 bpd) offer upside—Aframax navigates with cautious confidence.

Britain Friday sanctioned 100 Russian shadow fleet oil tankers oil tankers that carried more than $24 billion in cargo since the beginning of 2024.
⏸️ Clean Market: Mixed Performance
Rate Divergence
Clean tanker markets reflect regional splits. LR2 rates weaken, with TC1 (75kt MEG/Japan) dipping from WS123.33 to WS110.56 and TC20 (90kt MEG/UK-Continent) losing $231,250 to $3.25 million. LR1 rates stabilize, with TC5 (55kt MEG/Japan) holding at low WS130s and TC8 (65kt MEG/UK-Continent) at $2.7 million, but UK-Continent TC16 (60kt ARA/West Africa) falls 7.5 points to WS120. MR rates soften slightly, with TC17 (35kt MEG/East Africa) at WS210, TC2 (37kt ARA/U.S. Atlantic) down 6.88 points to WS126.56 ($12,044 per day), and TC19 (37kt ARA/West Africa) at WS146.88. Handymax weakens, with TC6 (30kt Cross-Mediterranean) at WS130.28 and TC23 (30kt Cross-UK-Continent) down 13.61 points to WS133.33—Clean markets navigate uneven currents.
Trade Patterns
MEG LR2/LR1 markets soften due to weak enquiry, though Asian tonnage lists tighten. UK-Continent LR1s and MRs face cancellations, lengthening tonnage lists. U.S. Gulf MRs stabilize with late-week demand, but TC14 (38kt/UK-Continent) falls to WS111.07 and TC21 (38kt/Caribbean) drops to $535,714. A 50,000-dwt MR delivers Qatar’s GTL diesel (35,000 tonnes) to the U.S. Gulf, capitalizing on tightening diesel inventories (down 2.4 million barrels). Refinery margins climb post-OPEC+ news, supporting cargo flows after maintenance. Mediterranean and U.S. Gulf MR markets benefit from repositioning, but Handymax lags—Clean tankers seek balance.
Influencing Factors
U.S. port fees minimally impact MR/Handymax (sub-55,000 dwt), and Torm notes no tariff disruptions for clean products (energy exempt). Houthi ceasefire talks could normalize Red Sea routes, but Torm’s CEO sees neutral rate impacts due to short-haul volume growth. Clarksons forecasts 6.3% clean fleet growth in 2026 with flat demand, pressuring rates. Rising refinery margins and U.S. diesel demand boost MR, while Qatar’s GTL trade signals arbitrage. U.S. sanctions on Iranian oil and Chinese terminals risk disruptions—Clean markets balance opportunity with oversupply risks.
For illustrative purposes only
🌐 What’s Moving It: Oil Flows and Sanctions
Commodity Shifts
U.S. crude to India (470,000 bpd in June) and China’s 11 million bpd imports drive VLCC demand, though Iranian sanctions disrupt flows. Russian-Chinese crude blends to Venezuela (1.2 million barrels) and Kazakhstan’s CPC crude (240,000 bpd) support Suezmax/Aframax. Norway’s Johan Castberg (135,000 bpd) adds cargoes, while OPEC+’s June hike (411,000 bpd) lifts crude sentiment. Clean markets benefit from Qatar’s GTL diesel and rising refinery margins post-maintenance, supporting MR. Falling crude prices and tightening U.S. diesel inventories fuel clean trades—oil flows shape tanker dynamics.
Policy Pressures
U.S. sanctions target six tankers (four VLCCs, two Aframax) and Chinese terminals for Iranian oil, risking VLCC/Aframax availability. UK’s shadow fleet sanctions (100 tankers, $24 billion) and Houthi ceasefire talks could normalize Red Sea routes, reducing tonne-miles but boosting short-haul volumes. U.S.-China trade talks (May 11) and energy tariff exemptions create uncertainty. Clarksons’ 2026 forecast (2.4% crude, 6.3% clean fleet growth) signals rate pressure, but OPEC+ hikes and new fields (e.g., Johan Castberg) offer upside—sanctions and trade policies steer the tanker path.
🌐 Market and Stocks: Navigating Volatility
Stock Performance
Tanker stocks reflect resilience. International Seaways $INSW (+1,06%) reports $40 million adjusted net income ($0.80 per share), beating estimates, with VLCCs at $42,800 per day (Q2 guidance). DHT Holdings $DHT (+0,31%) achieves $48,700 per day spot rates (72% booked), up 34% from Q1, with $0.15 per share dividend. BP $BP. (-0,07%) sells six 46,000-dwt MRs for $192 million, possibly to Tsakos Group $TNP (-0,17%) (nine Suezmax newbuildings, $1.34 billion). Scorpio Tankers $STNG (+0,17%) and Hafnia $HAFNI (+0,63%) are Fearnley’s top picks for MR/LR2 strength. Clarksons notes tanker earnings at $35,000 per day (45% above 10-year average)—stocks balance geopolitical risks with demand growth.
Investor Insights
VLCCs may rebound with OPEC+ hikes and rising inventories, but sanctions pose risks. Suezmax and Aframax rely on Kazakhstan and Norwegian crude, though Atlantic oversupply caps gains. Clean markets face 2026 headwinds (6.3% fleet growth), but MR benefits from U.S. diesel demand and GTL trades. Seaways’ $INSW (+1,06%) VLCC buyback ($250 million refinancing) and Torm’s $TRMD A (+1,09%) neutral Red Sea outlook signal confidence. Low crude fleet growth (2.4%) and sanctions risks shape strategies—investors weigh trade disruptions against supply constraints.
Sector Outlook
Sanctions, Houthi ceasefire talks, and Red Sea dynamics pressure rates, but OPEC+ hikes and new fields drive demand. Clarksons’ 2026 forecast (crude steady, clean easing) highlights clean oversupply risks. MR and Handymax benefit from clean fuel trades, while Suezmax and Aframax rely on CPC and Johan Castberg flows. Stocks like Seaways $INSW (+1,06%) (strong liquidity, $673 million) and DHT $DHT (+0,31%) (undervalued) offer value if demand holds—investors balance short-term volatility with long-term fundamentals.
🌐 Outlook: Charting Future Waves
Market Projections
VLCC ranges $41,000-$50,000 per day—OPEC+ hikes offer upside—cautious. Suezmax at $36,000-$44,500—Atlantic weakness persists—challenged. Aframax at $29,000-$43,500—resilience holds, but oversupply looms—steady. Clean varies: LR2/LR1 at $23,400-$28,800 (softening), MR at $12,000-$20,900 (stabilizing), Handymax at $10,000-$13,000 (pressured)—mixed. Red Sea normalization and sanctions signal volatility—2026 could soften with fleet growth.
Strategic Horizons
VLCCs leverage OPEC+ and U.S.-India flows, but Suezmax needs Atlantic demand. Aframax’s repositioning ensures stability, while MR capitalizes on clean fuel arbitrage. Handymax risks stagnation without new cargoes. Sanctions, 2026 fleet growth (6.3% clean), and trade talks challenge margins, but low crude fleet growth (2.4%) and new fields offer upside. Investors must navigate sanctions and geopolitical shifts while betting on supply constraints—strategic moves will define tanker fortunes.
Your Call
Will VLCCs rebound with OPEC+ hikes, or can MR’s clean fuel trades lead the way? Share your take—let’s conquer the markets! 🚢
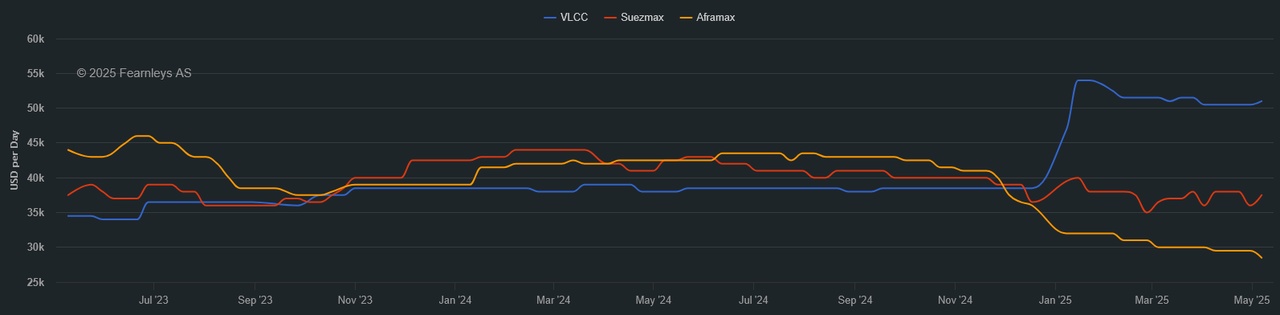
1 Year T/C - VLCC SUEZMAX AFRAMAX ECO / SCRUBBER - May 7th
*The Worldscale (WS) rate is a system used to calculate tanker freight rates, where WS 100 represents a standard base rate for a specific route. Rates above or below this benchmark indicate how much more or less a charterer will pay relative to the base cost. A higher WS rate means better earnings for shipowners, while a lower WS rate means lower transportation costs for charterers.