Hello my dears,
The US market seems to be calming down a little today.
That's why I'd like to quickly introduce you to a great company that some of you may not yet have on your radar.
How many of you already know the company?
And of course your opinion on the company is once again very important to me. That's why I'm hoping for lots of comments.
$CRS (-20,5 %)
Carpenter Technology is clearly a niche champion. The company dominates highly specialized alloys for extremely demanding applications, particularly in aerospace, defense and medical technology. These markets are small but highly profitable and require precisely the materials expertise in which Carpenter is a leader.
Highly specialized product range
- Focus on high-performance specialty alloys: nickel, titanium, stainless steel and magnetic specialty alloys.
- Used in areas where material failure is not an option (turbines, rockets, implants).
- Proprietary alloys and manufacturing processes create technological barriers to entry
Strong foothold in niche markets
- Main customers: Aerospace & Defense, medical technology, energy, industry.
- These segments are not only highly regulated, but also require customized solutions that only a few suppliers can provide.
Market position: small, but strategically extremely relevant
- Carpenter is not a mass metal producer, but a "foundational player" in the high-performance segment.
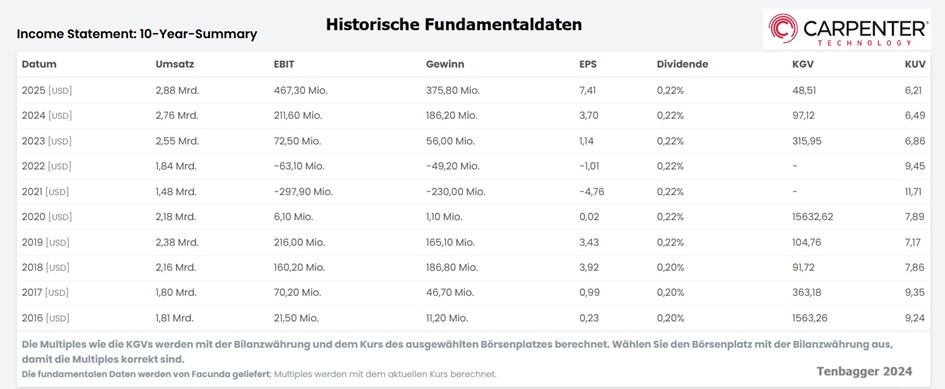
- Turnover 2024: approx. USD 2.8 billion - small compared to giants such as Allegheny or Haynes, but very strong in the niche.
Growth driver in exactly the right niches
- Aerospace is experiencing structural growth (fleet modernization, defense budgets).
- Electrification & e-motors benefit from Carpenter's Soft Magnetic Alloys.
- Additive manufacturing (3D printing) is increasingly becoming a differentiating factor.
CONCLUSION
Carpenter is not a broad metal stock, but a premium supplier for critical high-tech applications. It is precisely this position that makes the company a niche champion - with structural tailwinds, high barriers to entry and strong pricing power.
Carpenter Technology has in-depth metallurgical expertise
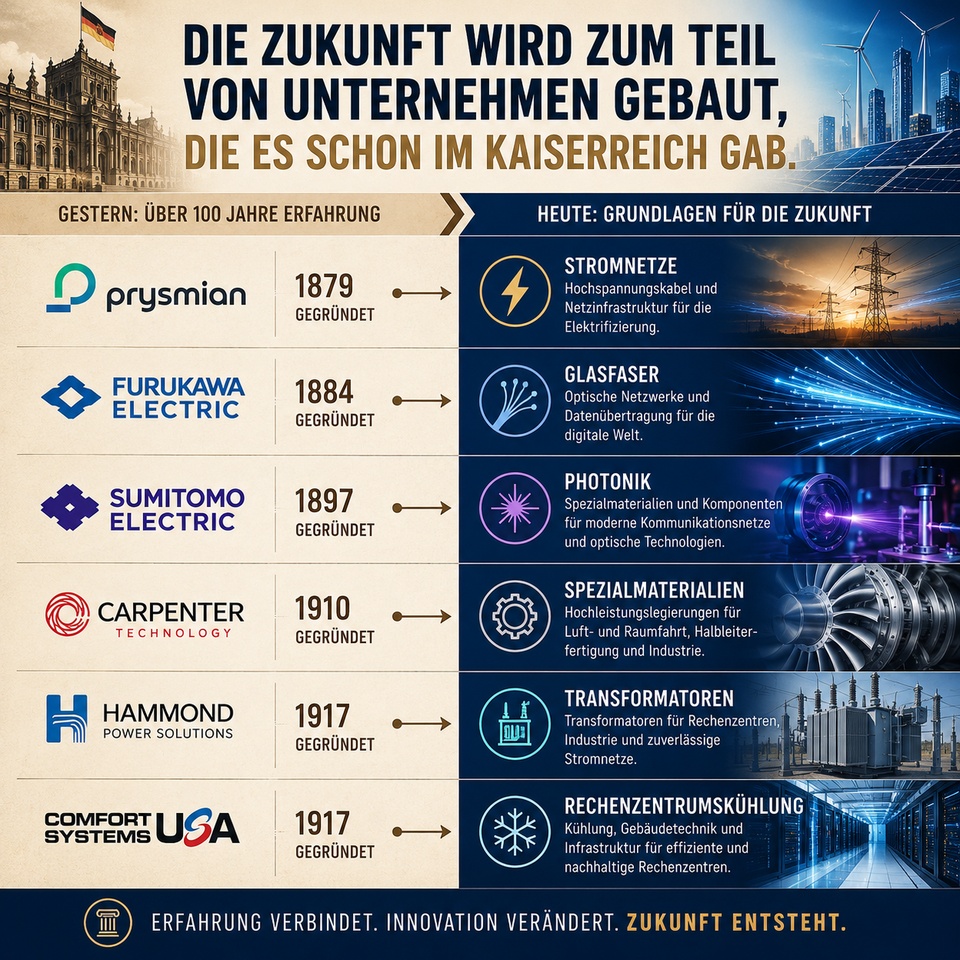
Carpenter Technology was founded in 1889 and currently has a market capitalization of USD 16.7 billion and a diversified end market. The company is organized into two segments, Specialty Alloys Operations or "SAO" and Performance Engineered Products or "PEP". SAO focuses on the production of high-quality alloys and stainless steel products, while PEP includes titanium products, materials for additive manufacturing and distribution networks. 90% of sales are generated in SAO, with PEP accounting for the remaining 10%.
The company has several end markets with different application areas:
- Aerospace & Defense with applications in jet engine components and fuselage parts.
- Energy with applications in turbines and the oil and gas industry.
- Medical with applications in implants and surgical instruments.
- Transportation with applications in valves, fasteners and electric vehicle motor alloys
- Industrial and consumer sectors with applications in niche specialty parts.
The opportunities and risks of Carpenter Technology
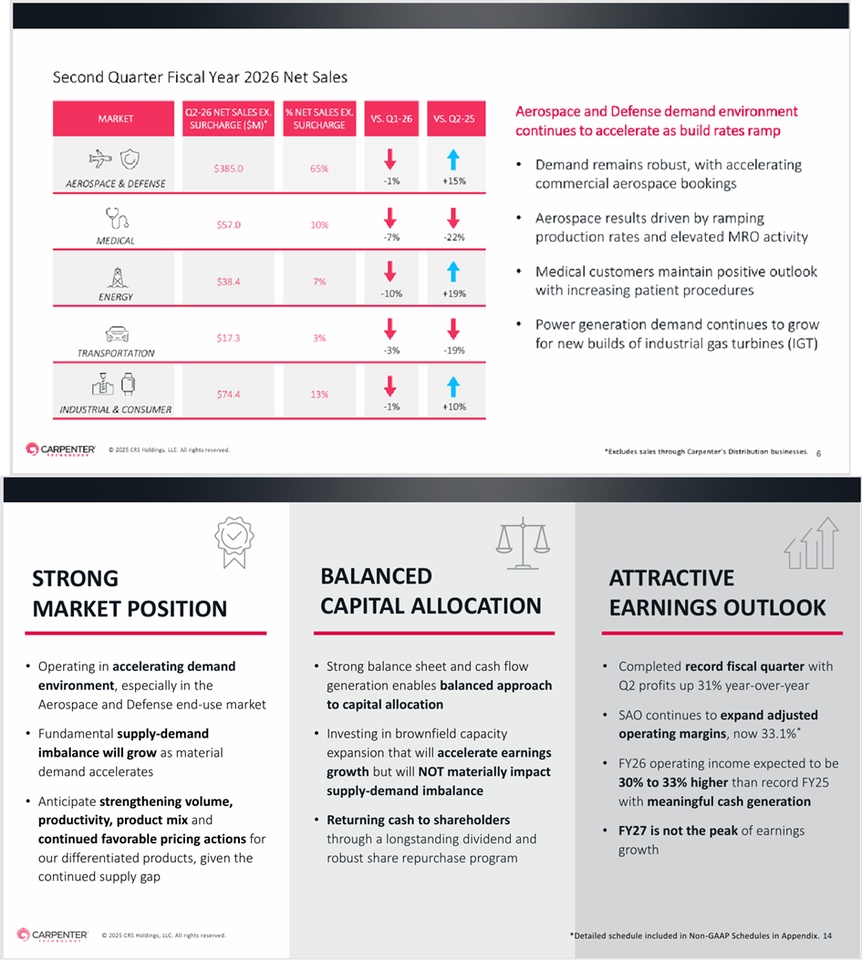
The main growth driver for Carpenter appears to be in the aerospace and defense markets. We are currently experiencing high demand for maintenance, repair and overhaul, which is also driving demand for alloys, metals and parts, and we are also seeing increasing production rates, which is driving demand for aircraft engines and engine materials. In addition, the increase in defense budgets will also increase material demand for defense systems. Furthermore, I believe that additive manufacturing offers a tiny growth opportunity, as supportive manufacturing and metal powder technologies are well suited to the production of more complex components.
We are also seeing healthcare demand grow and drive demand for specialty alloys, while electrification and energy demand are driving demand for turbine and engine alloys.
Materials that move markets
Carpenter Technology is a global leader in high-performance and specialty alloy materials and process solutions for critical applications in aerospace, defense, medical, energy and other high-value markets
Markets
Superior materials for engines, landing gear, precision components and additive metal powder manufacturing.
Diverse specialty alloys for high-pressure fuel systems, engines, exhaust systems, oxygen sensors and other components.
Specialty alloys for durable and non-durable consumer products from consumer electronics to sporting goods.
Advanced specialty materials for smaller, lighter and more durable components used in mission-critical applications.
High performance alloys and powders for power generation, renewable energy and oil and gas drilling and completion applications.
Corrosion, heat and pressure resistant specialty alloys and stainless steel for valves, fittings and fasteners.
Titanium, stainless steel and special alloys for surgical instruments, medical devices, prostheses and orthopaedics.
Carpenter Technology: Why the growth of the aerospace and defense industry makes this a strong buy
Jan. 26, 2026,
Executive Summary
- Carpenter Technology starts with a strong buy valuation, driven by strong demand for aerospace and defense sectors and improved operating leverage.
- CRS is expected to deliver 7% annual revenue growth and nearly 20% EBITDA growth from 2025 to 2028, with margins increasing from 23.1% to 32%.
- Despite trading at a premium of 24.6x EV/EBITDA, CRS' integration into aerospace and defense justifies a valuation in line with industry peers.
- Feasible run rates and the potential for increased share buybacks support the investment case, with a base price target of $393.21 (17% upside).
PowerPoint Presentation
Investoren-Update – Carpenter Technology Corporation
In the last fiscal year, Carpenter Technology Corp. sales increased 4.3% from USD 2.8 billion to USD 2.9 billion. The profit from USD 186.5 million to USD 376.0 million by 101,6%. The net profit margin was thus 13.1% compared to 6.8% in the previous year. On January 29, 2026, Carpenter Technology Corp. reported its Q3 figures for the quarter ending December 31, 2025. Revenue in the earnings period amounted to USD 728.0 million (+7.5% compared to the same quarter of the previous year) and profit was USD 105.3 million (+25.2% compared to the same quarter of the previous year).
USD in millions
Estimates
Year Turnover Change
2024 2.760 8,21 %
2025 2.877 4,25 %
2026 3.094 7,55 %
2027 3.429 10,82 %
2028 3.659 6,71 %
Year EBIT Change
2024 354,1 166,04 %
2025 525,4 48,38 %
2026 688,9 31,12 %
2027 820,8 19,14 %
2028 931,6 13,5 %
Year Net result Change
2024 186,5 230,67 %
2025 376 101,61 %
2026 636,4 36,18 %
2027 771,9 21,3 %
2028 893,6 15,77 %
Year Net debt CAPEX
2024 495 96,6
2025 380 154,3
2026 325 309,7
2027 134 318,3
2028 -172 160
Year Free cash flow Change
2024 178,3 363,76 %
2025 286,1 60,46 %
2026 284,1 -0,69 %
2027 396,1 39,57 %
2028 346 -12,75 %
Year EBIT margin ROE
2024 12,83 % 12,33 %
2025 18,26 % 21,39 %
2026 22,26 % 24,86 %
2027 23,93 % 24,17 %
2028 25,46 % 23,34 %
@Get_Rich_or_Die_Tryin that's a nice margin increase
Year Earnings per share Change
2024 3,7 224,56 %
2025 7,42 100,54 %
2026 10,08 35,87 %
2027 12,07 19,69 %
2028 13,92 15,34 %
Year Dividend Yield
2024 0,8 0,73 %
2025 0,8 0,29 %
2026 0,83 0,24 %
2027 0,873 0,25 %
2028 1,041 0,3 %
Year P/E ratio PEG
2024 29.6x 0x
2025 37.2x 0x
2026 34.6x 1x
2027 28.9x 1.5x
2028 25.1x 1.6x
Market value 17,366
Number of shares (in thousands) 49,810
Date of publication 31.07.2025
Looking at the key metrics for Carpenter Technology, we see that the increasing EBITDA growth is driven by a combination of revenue growth and margin growth. Margins are expected to increase from 23.1% in 2025 to 32% by 2028. For 2028, we see a weakening of the cash conversion ratio and cash flows. I believe this could be caused by higher working capital requirements as many aircraft programs should finally reach their targeted production rates, which could lead to higher working capital requirements and higher inventory build-up to mitigate delivery risk. However, if managed well, I believe cash conversion for 2028 could be >40%, which would provide additional cash flows beyond what is currently modeled. In terms of cash and debt, we note that the company has a very manageable debt profile. There is $400m in bonds maturing in FY29, followed by $300m in bonds maturing the following year. The company can pay this back from cash, which I expect to be $860 million by the end of FY28. In terms of net debt leverage, we note that the company is operating well below my 2x to 2.5 net debt range for aerospace and defense companies.
This means that Carpenter Technologies should definitely have room to refinance debt and potentially increase share repurchases above the $400 million gross volume modeled under the share repurchase program.
Conclusion: Carpenter Technologies starts with a strong buy valuation
The company will benefit from increasing demand for specialty alloys for aerospace and defense applications, industrial turbine applications in other markets, and growing demand for healthcare, which is also driving demand for materials such as titanium alloys. The company therefore has strong growth prospects, which will also increase margins, already returning value to shareholders, while metals and alloys are playing an increasingly important role in many markets.
Performance
1 week +12.33 %
1 month +2.38 %
6 months +35.17 %
1 year +80.92 %
3 years +584.30 %
5 years + 960.05 %
7 years +666.94 %
10 years +1,135.91 %
$CRS. @Klein-Anleger