
I always like to test promising systematic strategies. On Getquin and especially from @Epi there are a lot of them. Most recently, GTAA and especially the 3x variant with the certificate received a lot of attention (https://getqu.in/2Ya4VP/). As I would like to expand my momentum strategies, I have now also taken a look at GTAA.
1) Starting point
First of all, I wanted to replicate the GTAA strategy of @Epi to replicate it. Mainly because I am interested in daily data and Epi only looked at monthly data in the backtest.
For this I used the following universe (from Epi's GTAA Max):
3xQQQ, BTC, PRIDX, VUSTX
Period from 01.01.2016
How @Epi I use 200SMA and Dual Momentum as a signal and trade once a month:
I get a strong 42% CAGR, 30% Vola, -50% Max Drawdown and end up pretty much with Epi's numbers. It should be noted that my drawdown is calculated daily and not monthly as with Epi.
Now I have categorized the numbers a bit:
- BTC from 2016 is of course subject to survivorship bias. Nobody would have allocated 33% of the portfolio to BTC in 2016.
- I looked at the performance distribution and realized that 60% of the performance was generated by BTC and 37% by TQQQ. So together they generated 97% of the performance and it doesn't matter which assets are still in the universe. I modified the universe and added bonds, for example. The result was the same.
- The weakest day was -25% on 12.03.2020, which is pretty heavy
- If you extend the strategy to the period from 2007 (BTC is added from 2016), you only get 28% with 24% vola and -50% MaxDD
- If you now only use BTC from 2018 onwards, you get 20% CAGR, 23% vola, -50% MaxDD. So not so great anymore. Whereby 64% of the performance is attributable to TQQQ. You might as well invest directly in the QQQQ.
Please have a look at the backtest of @Jesko (https://getqu.in/0ydHY0/). We have also seen drawdowns of -60% and more. @Jesko has rebuilt 3xGTAA better than me (I only used GTAA MAX and did a rather inaccurate test).
2) Target
I would like to add GTAA to my portfolio. But the presented variants of Epi are either too defensive (10-15%CAGR) or too risky (-50% daily drawdown) for me. Epi's 3xGTAA will probably also experience drawdowns of this magnitude. In April it was already 37% (again the reference to @Jesko ).
Therefore, I would like to optimize my GTAA variant for special parameters, which should achieve the following:
- highest possible CAGR
- maximum drawdown as low as possible (small drawdowns are not bad, larger drawdowns should be significant)
- the shortest possible periods of sideways movement. It is a big risk if you think that the strategy is not working because it has been going sideways for years while all indices are at record highs and you therefore abandon the strategy. Epi also mentioned this point. I am happy to accept a few percent long-term performance in return.
I also want to achieve the best possible performance distribution. This allows me to achieve better diversification. If the performance drivers are not so strong, then hopefully there are enough other assets that can at least partially fill the gap.
To do this, it was first necessary to determine the universe. In doing so, I only considered assets that have delivered performance and/or reduced risk.
3) The universe
The following assets are included in my universe:
3xSPY (US equities) $3USL (-0,27 %)
3xEEM (developing country equities) $3EML (-0,52 %)
EXUS (industrialized countries without US equities) $EXUS (+0,06 %)
2xWSML (world small cap equities) $null (+3,73 %)
IXC (Utilities) $IXC (-0,33 %)
3xTLT (long US bonds) Cash + $TLT5 (-0,34 %)
3xIEF (medium US bonds) $3TYL (-0,59 %)
XBCU (commodities) $XBCU (+0,09 %)
2xGOLD (gold) $LBUL (+1,88 %)
BTC (Bitcoin) $BTC (-0,06 %)
This achieves the first goal: diversification in the universe.
All regions are covered and, with the small cap ETF, almost the entire investable market. In addition, there are cyclical components such as commodities or utilities, which are highly correlated but have synergies in my tests that reduce the risk. In addition, gold and BTC + US bonds, as they have provided the best and safest long-term returns.
I would also like to mention that the STOXX50 or oil performed very poorly in my tests and are therefore not in the universe.
In addition, ETFs exist almost everywhere except for the leveraged small caps. There is only one factor certificate that leverages in EUR, i.e. contains the exchange rate twice. My tests reflect this situation. The strategy also works with the unleveraged $WSML (+0,11 %) . This leads to 1-2% CAGR less.
4) Parameters to be optimized
Maximize CAGR - 1.1^MaxDD and Minimize 10%MTU. (Explanation follows)
The most important parameter for me is CAGR - 1.1^MaxDD. In other words, the average growth rate minus the drawdown. The drawdown is weighted with an exponential function so that small drawdowns have little influence.
With 20% CAGR and 20% DD, we can accept +1.5% DD for +1% CAGR. At 20% CAGR and 30% DD, only +0.5% DD is acceptable for +1% CAGR. The higher the drawdown, the more excess return we have to achieve in order to accept an even higher drawdown.
The second parameter is 10%MTU. This describes the following situation:
At each point in time, the share price 3, 5 and 7 years ago is considered. The current price is forecast using the CAGR of the entire strategy. The 3 differences between the actual price and the forecast are then added together. The result is the Medium-Term Underperformance (MTU) of this point in time. Example:
The portfolio is at €100 at time x. Three years ago it was at €100, five years ago at €80 and seven years ago at €60. The CAGR of the strategy is 10%.
Now the current value is forecast based on the past:
3 years ago: 100€ with 10% CAGR in 3 years results in 100€*1.1^3 = 133€
5 years ago: 80€ -> results in 129€
7 years ago: 60€ -> results in 117€
But the current price is only €100. The MTU is now the sum of the percentage deviations:
(100-133€)/133€ +(100€-129€)/129€ + (100€-117€)/117€
= -24.8% - 22.5% - 14.5% = -61.8% MTU at time x.
The MTU is therefore a measure of performance over the medium term (3-7 years) and whether the total return was exceeded or underperformed during this period.
10%MTU is obtained by sorting all MTU values and taking the largest value of the lowest decile (10% quantile).
A higher 10%MTU value indicates that the weakest 10% of all mean time periods have performed better than a lower 10%MTU value.
This means that the higher the 10%MTU, the fewer sideways phases there are.
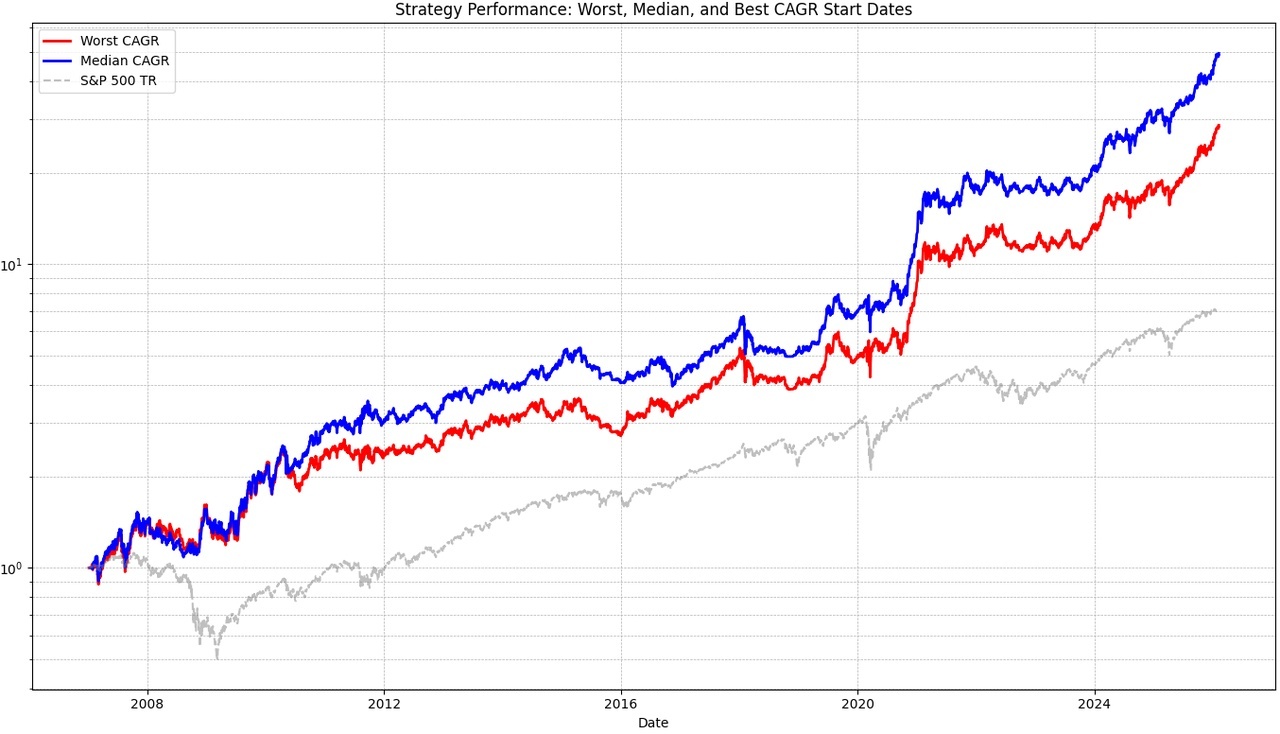
5) Parameters on Epis GTAA Max
(since 2007, with BTC only from 2018)
GTAA MAX:
I will always show 3 graphs. The gray one is the benchmark (S&P 500 TR). I have abstracted Epi's strategy again to get a better comparison to my strategy. It is not traded at the beginning or end of the month, but a simulation for every possible trading day (e.g. the 1st, 15th, 20th, etc.) in the month. The median is shown in blue and the worst case in red. All the above metrics always refer to the worst case in order to calculate as conservatively as possible.
You can already see very few sideways phases, the 10% MTU value is therefore very strong (for the vola) at -35%. Here all metrics (in brackets the benchmark S&P 500 TR):
CAGR 17.36% (10.74%)
Volatility 23.58% (19.5%)
Sharpe Ratio 0.81 (0.6)
Max Drawdown -49.37% (-55.25%)
Worst Day -24.57% (-11.98%)
10%MTU -35.35% (-21.2%)
CAGR - 1.1^MaxDD -91.2 (-180)
The metrics look quite good, but the value for CAGR - 1.1^MaxDD is very low and the worst day is also very weak at 25%. In addition, my diversification target was not met: TQQQ is responsible for 70% of all gains.
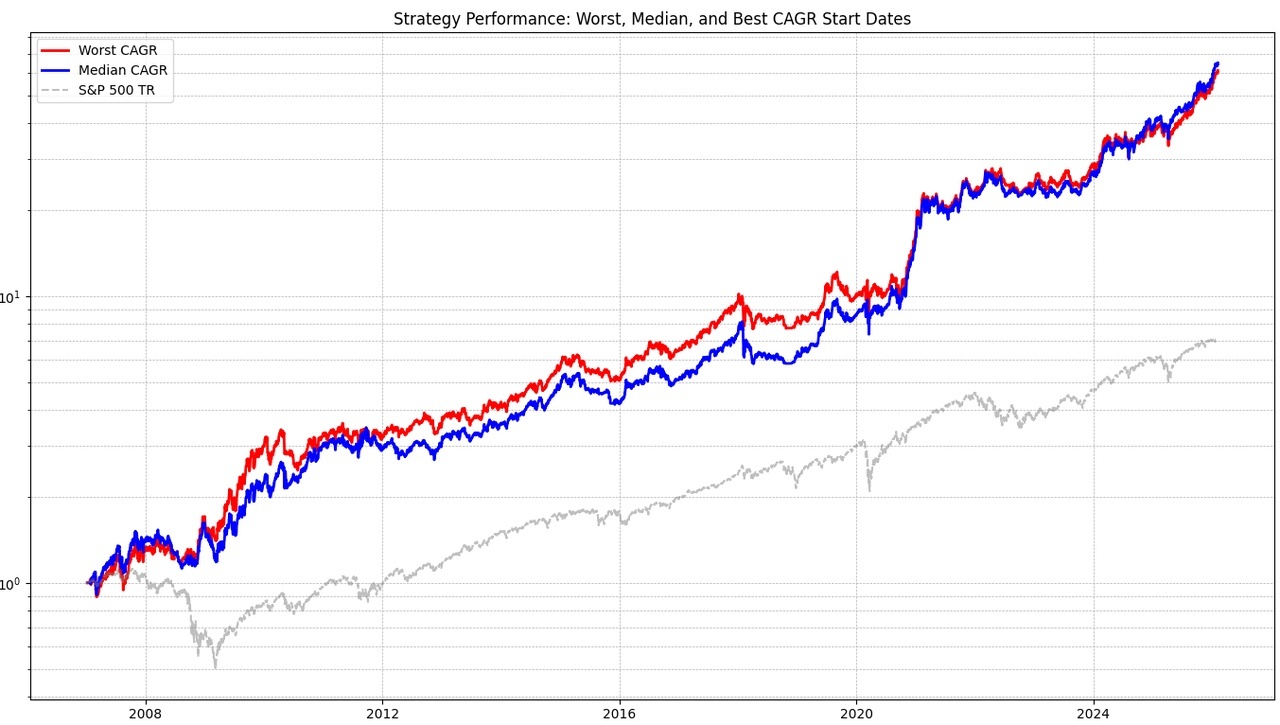
6) First tests
First, I tested my universe with the same parameters as Epi.
This looks very similar to GTAA MAX with lower yield and MTU:
CAGR 15.48% (10.74%)
Volatility 25.04% (19.5%)
Sharpe Ratio 0.68 (0.6)
Max Drawdown -51.32% (-55.25%)
Worst Day -22.77% (-11.98%)
10%MTU -45.68% (-21.2%)
CAGR - 1.1^MaxDD -118 (-180)
However, the diversification target has been met. The strongest asset (gold) only accounts for just under 28% of all gains.
7) Optimizations
The result is okay. However, there are still a few adjustments to be made. First of all, I checked whether it makes more sense to react to signals less frequently or more often. In times of crisis, you can be invested in a high-risk product for up to a month, even though the momentum has long since reversed. I ran a simulation for this purpose:
As you can clearly see, shorter periods are better. From 3 weeks, the maximum drawdown is considerably lower. But I don't want to trade weekly either, as that would be too much effort. So I will check the signals every 14 days and then trade.
Here you also have to be careful not to fall into a fallacy. The data shown is again the worst case. As higher weekly figures look at more cases, the probability that one of them is bad is also higher. However, the median looks similar, with the exception of 1-2 weeks. These have very similar values and support the thesis that 14 days between trades is sufficient.
Then I remembered that I use the SPY and actually wanted to diversify the Spytips strategy. So why not use the TIPS indicator for the SPY?
So the new rule is:
3xSPY is only considered when TIPS is above its own SMA.
CAGR 19.24% (10.74%)
Volatility 23.30% (19.5%)
Sharpe Ratio 0.86 (0.6)
Max Drawdown -36.59% (-55.25%)
Worst Day -12.59% (-11.98%)
10%MTU -43.39% (-21.2%)
CAGR - 1.1^MaxDD -13.5 (-180)
More return with less vola and lower drawdown. The weakest day is also much better. The 10%MTU is also better.
Next, I would like to hold a maximum of 4 (instead of 3) assets at the same time to further reduce the risk profile.
I do this a little differently than EPI: If there are no 4 assets to hold, only 1,2 or 3 will be held with 100, 50-50 or 33-33-33 weighting respectively. Maximum weightings per asset have been set so that the weighting is not too high:
e.g. 3xTLT, 3xIEF, BTC, IXC, Commodities may only account for a maximum of 30% each and 3xEEM only 20% (effectively reducing the leverage from 3x to 2-2.4. Unfortunately, there is no 2x EM). The rest is filled with cash. This means that in market phases in which few assets are running, these can be weighted higher (30-40%):
CAGR 19.20% (10.74%)
Volatility 24.42% (19.5%)
Sharpe Ratio 0.82 (0.6)
Max Drawdown -29.04% (-55.25%)
Worst Day -12.06% (-11.98%)
10%MTU -44.70% (-21.2%)
CAGR - 1.1^MaxDD 3.3 (-180)
Drawdown is significantly better, but performance remains the same. Here you can also see that the median case performed even better than the last test (blue graph)
Finally, I optimized the SMA values. It should be mentioned that this test is overfitted and should only give an insight into what is possible.
CAGR 24.04% (10.74%)
Volatility 24.33% (19.5%)
Sharpe Ratio 0.98 (0.6)
Max Drawdown -28.79% (-55.25%)
Worst Day -12.06% (-11.98%)
10%MTU -38.81% (-21.2%)
CAGR - 1.1^MaxDD 8.5 (-180)
The best asset (3xSPY) only accounts for 20% of the total return. 10%MTU is over -40%.
Again the performance contribution of all assets:
20% 3xSPY
19% 2xGOLD
13.5% BTC
12.5% 3xEEM
11% 3xTLT
11% 2xWSML
5.5% 3xIEF
5.5% EXUS
2% XBCU
0% IXC
Although XBCU and IXC (commodities and utilities) do not generate a return, they reduce the risk in the portfolio.
8) Classification of the figures
Once again, I would like to list arguments for and against the strategy that result from my methodology:
For:
- worst trading interval considered
- BTC from 2018 is unfortunate. It would look much better from 2019 onwards
- Broad diversification (entire equity universe covered, bonds only US, as bonds from other regions have little momentum, BTC, gold and utilities as commodity/energy exposure)
- 4 assets instead of 3 reduces risk
- TIPS indicator tested several times is used and again sees a significant improvement
- The 3x leverage is "hedged" elsewhere: For EEM the max weight is reduced to 20%, which always results in at least 5% cash and 3xSPY is paired with the TIPS indicator. The 3x on bonds is less risky as bonds are less volatile.
- Survived all crises since 2000
Against:
- SMA optimization is safely overfitted
- There is always a risk of a rapid crash, which can have a major impact on leveraged products.
9) Conclusion
Even if the last test is overfitted, I assume the following metrics:
CAGR: approx. 20%
MaxDD: 30-35%
This means that the GTAA variant, which I MATT (Multi-Asset Trend Targeting), is a lower-risk alternative to 3xGTAA (a kind of 2-2.5xGTAA)
I am very curious to hear your ideas and suggestions.
10) Wikifolio
Yes, I have also created a wikifolio so that I and others can later invest in this strategy in a tax-efficient manner.
Unfortunately, I was not quite at the end of my development when I set it up, which is why gold is included with 3x leverage and the universe was still significantly smaller. I will change this at the next rebalancing. In fact, it would have performed better as a result.
You can already see the strong correlation with 3xGTAA, whereby less vola is included (if instead of 3x, 2x gold were included xD). The future will show.
Here is the link to the wikifolio if you are interested:
https://www.wikifolio.com/de/de/w/wf000matt0
11) Further
I have tested the final strategy again from 2000:

CAGR 22.17% (8.11%)
Volatility 22.56% (19.00%)
Sharpe Ratio 0.97 (0.49)
Max Drawdown -29.27% (-55.25%)
Worst Day -12.06% (-11.98%)
10%MTU -33.64% (-29.85%)
While the benchmark yields less, MATT does quite well and loses only 10% instead of 25% CAGR. 10%MTU looks even better.
In general, the development can be divided into the following phases (with the respective performance drivers):
2000 - 2003
CAGR: 0% (-10%)
+ Gold, TLT
- EXUS
2003-2011
CAGR: 33.35% (5.2%)
+ EEM, gold, WSML
- nothing
2010-2020
CAGR: 13.8% (13.98%)
+ SPY, TLT, IEF
- IXC, BTC
2020-2026
CAGR: 38% (15%)
+ SPY, Gold, BTC
- nothing


