Summary
- U.S. oil reserves, including the SPR, are sufficient for only 43 days’ supply — the lowest level in decades.
- Record crack spreads due to supply bottlenecks in refined products.
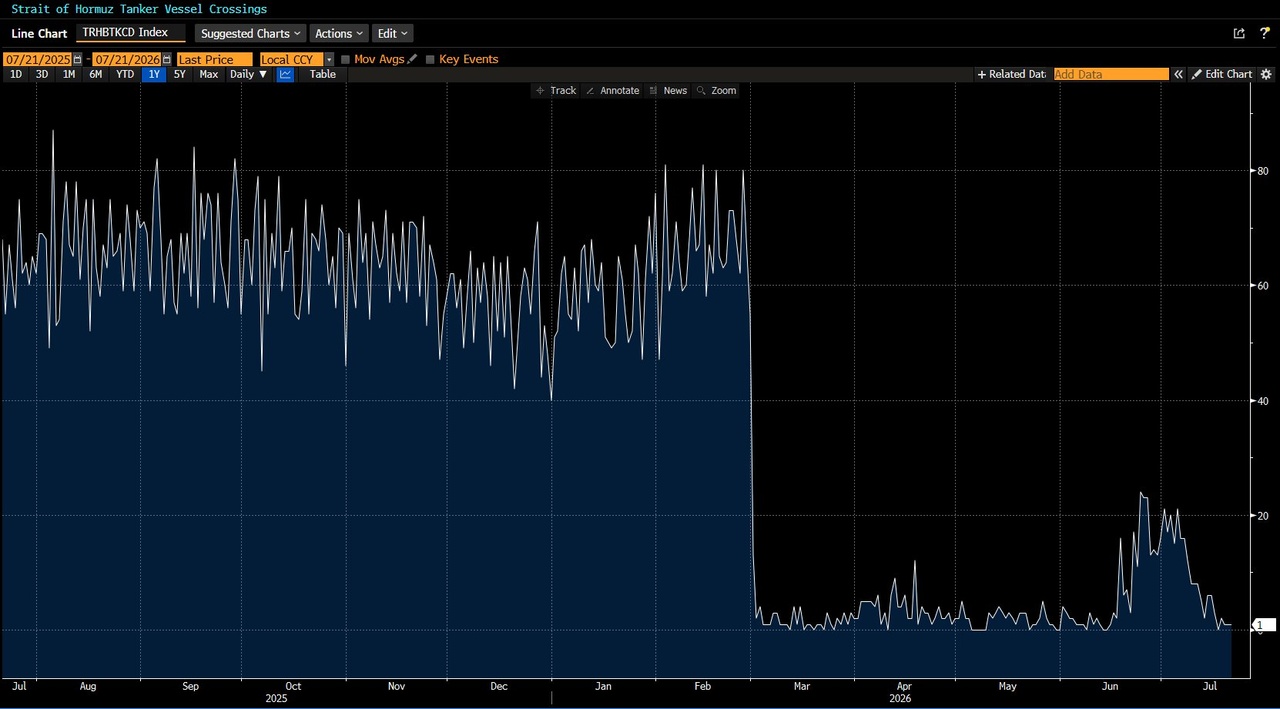
- The Strait of Hormuz remains a key source of uncertainty for oil prices.
- Smaller oil buffers could increase pressure for U.S. fiscal measures and bond issuances.
Geopolitical Update
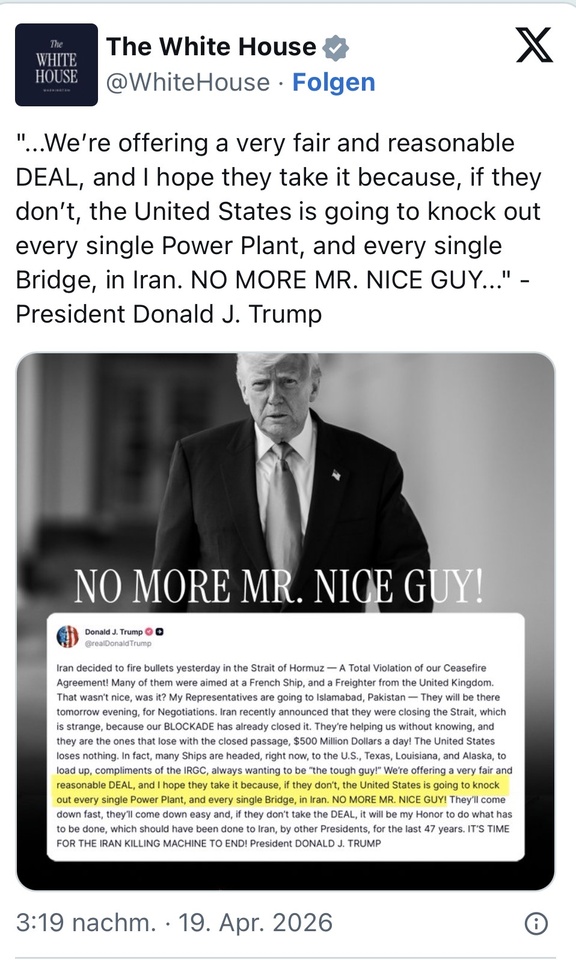
Direct military clashes have intensified again over the past 48 hours. According to CENTCOM, the U.S. carried out airstrikes on targets in Iran on the night of July 22. The strikes targeted military operations centers, aircraft hangars, drone depots, logistics facilities, and naval installations; according to U.S. officials, they were intended in particular to further weaken Iran’s military capabilities as well as its influence on shipping in the Strait of Hormuz. Donald Trump subsequently stated that the military operations were not yet complete and announced that he would order further attacks if necessary. Iran responded with missile and drone strikes on U.S. and allied targets in the region. Furthermore, the situation around the Strait of Hormuz remains tense.
Macro & Oil Market:
According to data from the $BAC (+0,49 %) total U.S. oil reserves plus the Strategic Petroleum Reserve are now only about 43 days away from reaching a 54-year low. The U.S. Gulf Coast (PADD 3) is currently bearing the brunt of the U.S. fuel supply. Refineries are operating at nearly 97% capacity, while gasoline inventories are below the seasonal average and the market for refined products remains tight. Since the U.S. is still in the driving season, PADD 3 is likely to remain under pressure in the coming weeks.
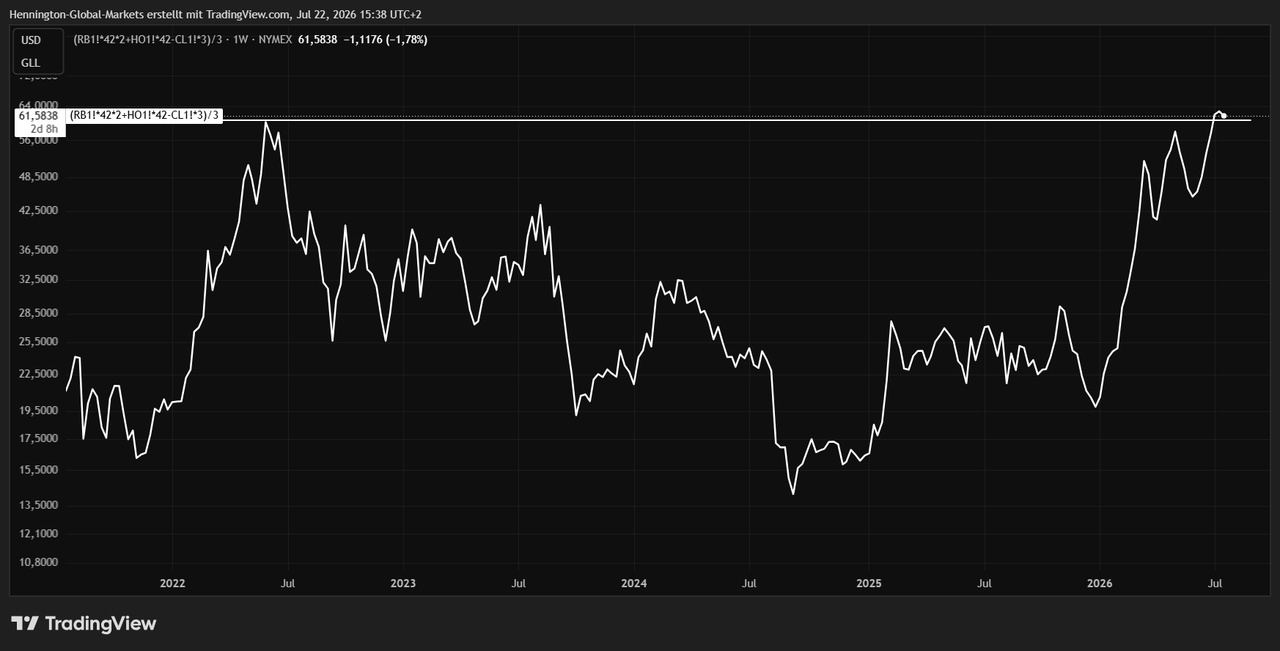
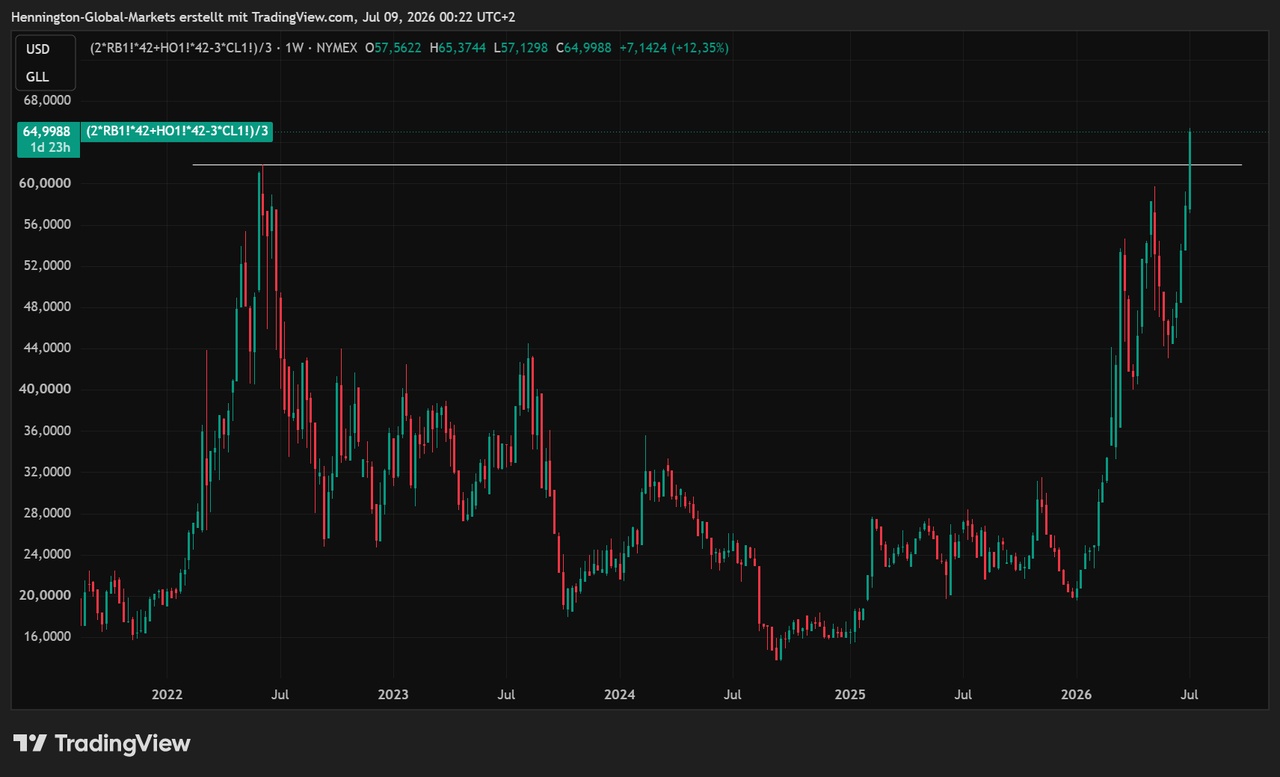
At the same time, crack spreads continue to widen. The 321 crack spread has now surpassed its 2008 high. For every 3 barrels $CRUD (-3,62 %) , the refinery can produce 2 barrels $B4N2 (-1,14 %) and 1 barrel $B4N1 (-1,27 %) . The gross margin has never been as high as it is now.
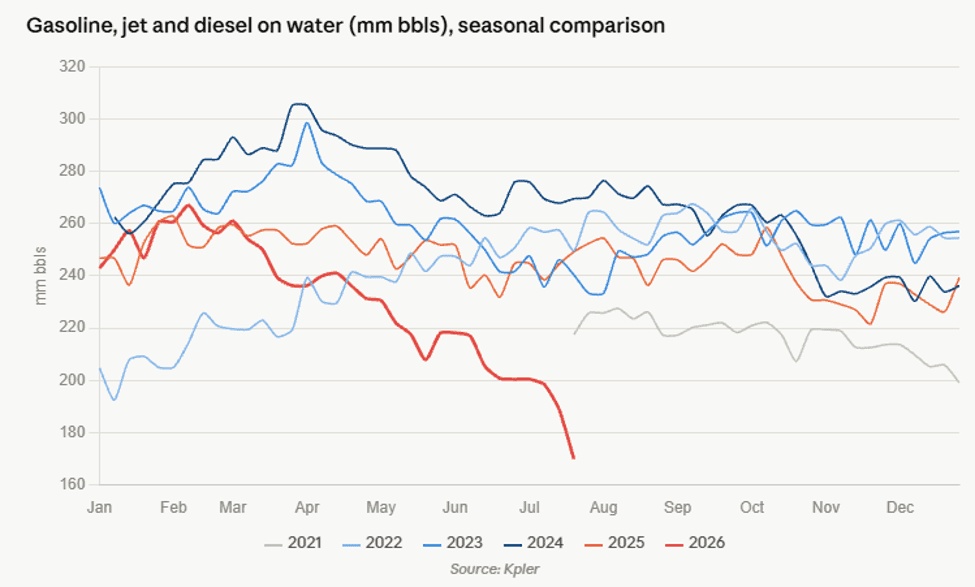
The large crack spreads are no surprise. Global inventories of gasoline, kerosene, and diesel in storage have plummeted massively due to the 2026 war, to approximately 170 million barrels.
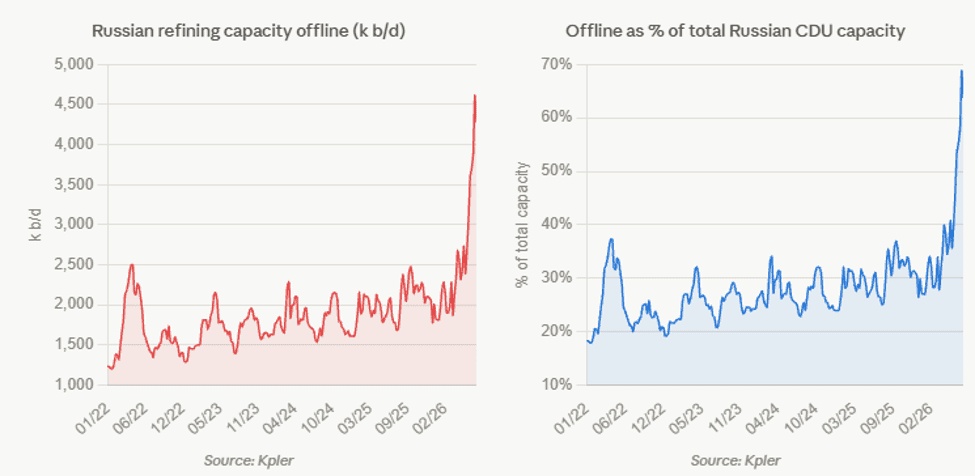
The offline capacity of Russian refineries has skyrocketed—to about 4.6 million barrels per day. That’s roughly 68% of Russia’s total CDU capacity* is currently offline. Normally, outage and maintenance rates fluctuate seasonally between 20% and 35%. The reason for this is Ukrainian drone attacks on oil infrastructure.
China has also sharply restricted its exports abroad. In doing so, China is depriving the global market of an important source of refined petroleum products. Since China has frequently served as a major exporter during regional supply bottlenecks in recent years, the current restrictions are tightening supply and thus also contributing to the high crack spreads.
Analysis:
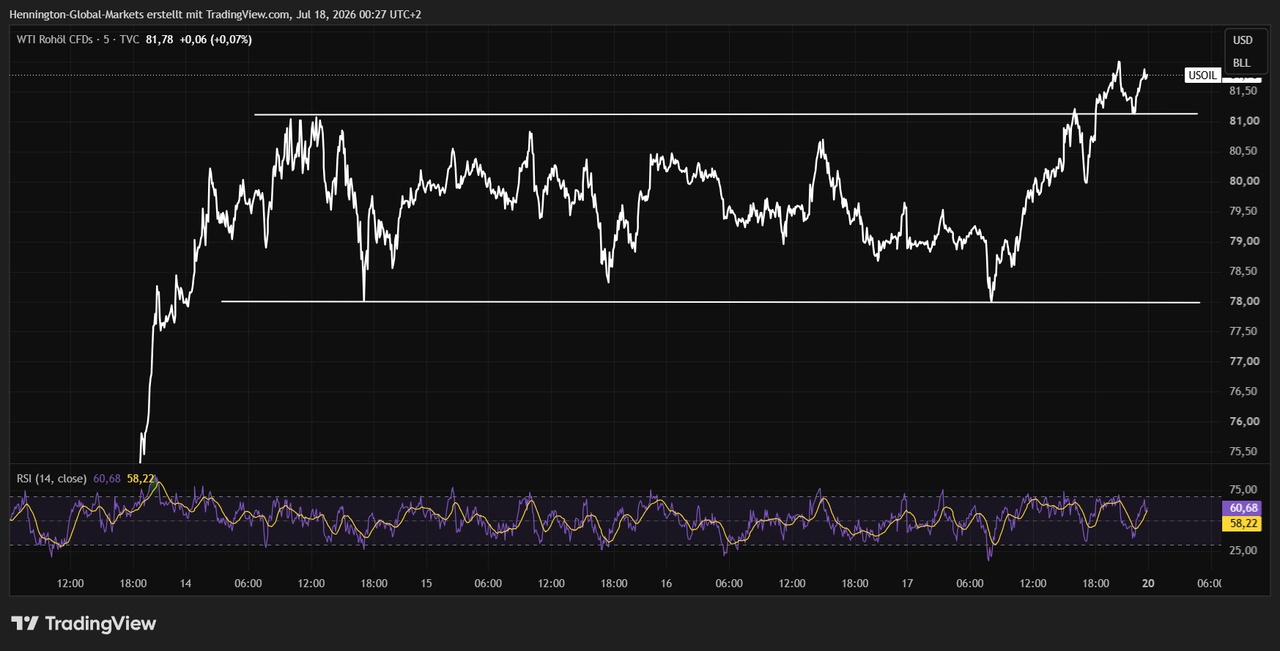
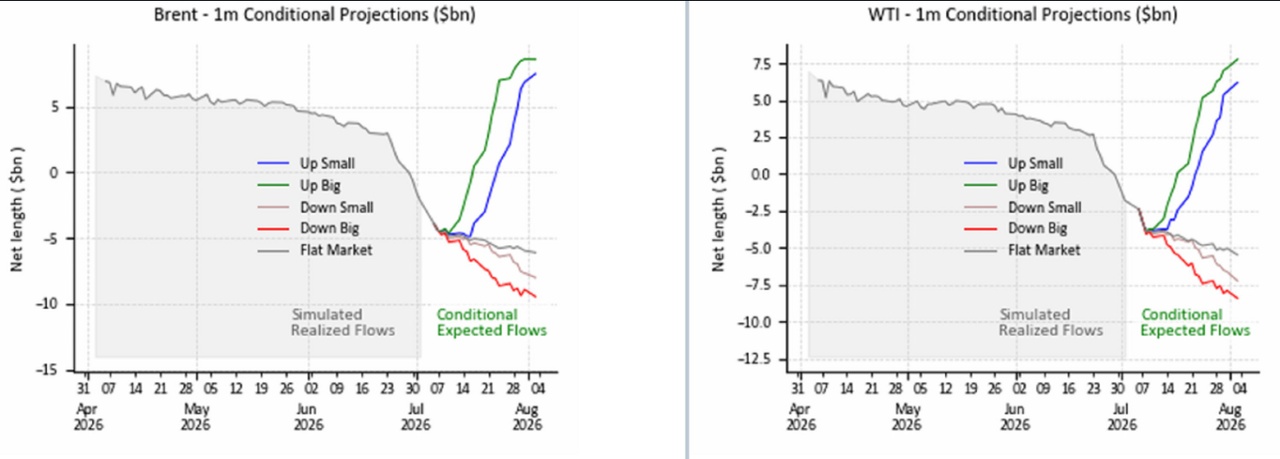
My assessment is that the situation in the Strait of Hormuz is unlikely to return to normal. In my view, Iran has emerged from the conflict in a strategically stronger position than before and thus has considerable leverage to disrupt shipping traffic through the Strait of Hormuz permanently or at least repeatedly. This uncertainty alone is likely to sustain a geopolitical risk premium on the oil price and increase CTA inflows.
At the same time, the U.S. government is under considerable political pressure ahead of the upcoming midterm elections. A persistently high oil price would directly translate into higher gasoline prices, which would further fuel inflation and erode consumer purchasing power.
Historically, the U.S. has been able to cushion oil price shocks in part by releasing oil from the Strategic Petroleum Reserve. However, this buffer is significantly smaller today. As previously mentioned, according to $BAC (+0,49 %) statistics, total U.S. crude oil supplies have fallen to a level sufficient for only 43 days. This is the lowest level in 45 years and is well below the long-term average of around 65 days. As a result, the Trump administration now has only limited access to one of its most important tools for stabilizing the market.
One option would be subsidies, which would lead to higher spending and also result in new government bond issuances. The question of demand is crucial here. Yields could come under further pressure, potentially triggering another round of the U.S. crisis. Watch Bonds!
*CDU capacity = How much crude oil can be converted into fuel per day.