Hello everyone,
after some time on this platform, I would now like to document and share my financial journey here with you, like many others, to motivate and support each other 🚀
That's why I'm putting myself and my experiences so far together for you.
About myself 🙋♂️
I am 22 years old and currently studying medicine in my 5th semester. But let's take things one step at a time.
From an early age, I was fascinated by the idea of turning what was initially little into more. Even at elementary school, I loved doing various swaps with Lego figures, Panini stickers or soccer cards.
My first experiences with real markets and tradable values came later in my youth with the computer game Counter Strike Global Offensive.
Roughly speaking, there were so-called "skins" that changed the appearance of the weapons you played with. The special thing about it was that these skins could also be swapped between players and thus bought and sold for real money. Back then, skins increased in value over time due to the increasing number of players worldwide and I was able to make several hundred euros in profit. And someone tell me again that "shooting games" are evil!
When I turned 18, my parents gave me a payout from an ETF portfolio that they had been saving €50 in since I was born. I was therefore in the very fortunate position of having assets of around €18k at a young age.
This was pretty much at the same time as I graduated from high school, after I started a dual study program in business informatics at Otto, where I was able to set aside around €800 net per month. After talking to my parents (mainly my father) and watching various Youtube videos from Finanzfluss, I decided to invest the money in ETFs $IWDA (-3,61 %) respectively $XDWD (-3,85 %) to invest. So I opened my first own securities account with Trade Republic.
After the first few months at the company, however, I realized that the work wasn't fulfilling me and, as I had previously wanted to study medicine, I wanted to go in a different direction. So I only stayed at Otto for a little longer than six months.
After preparing for the medical test, a nursing internship etc., I started studying exactly 2 years ago and, despite the really long days in the library, it's still a lot of fun! I had to learn quite quickly that it takes a lot of discipline to get through my studies well, but I think that this discipline will also help me to achieve the goals I set myself later in life.
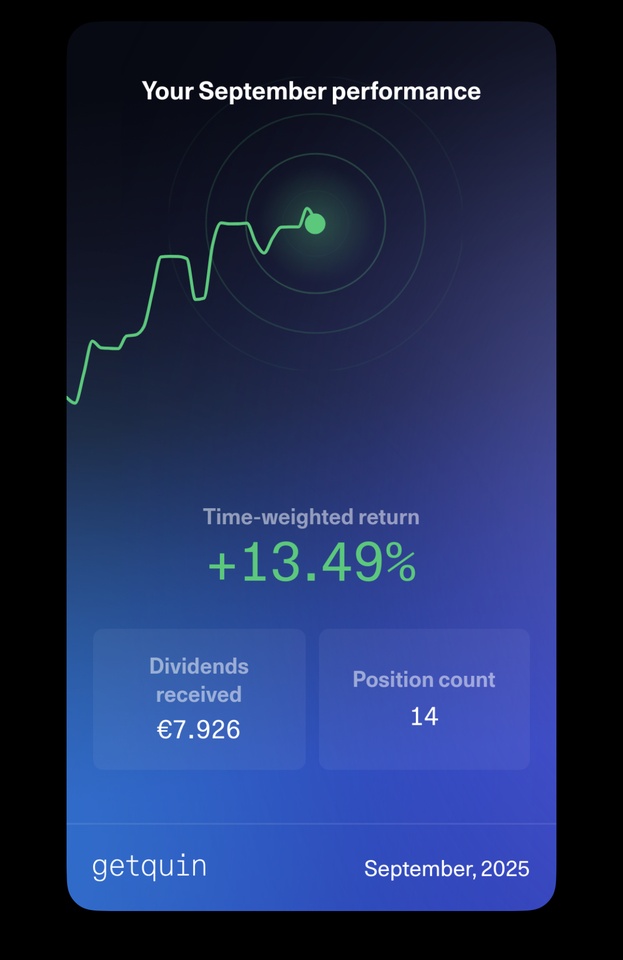
At the moment, my parents are still supporting me by paying my rent and covering the costs of my daily needs. I also work alongside my studies on a part-time basis with a somewhat variable income, which allows me to invest around €400 a month.
I think that's enough about my life story so far 😅
Now to my current investment strategy 📈
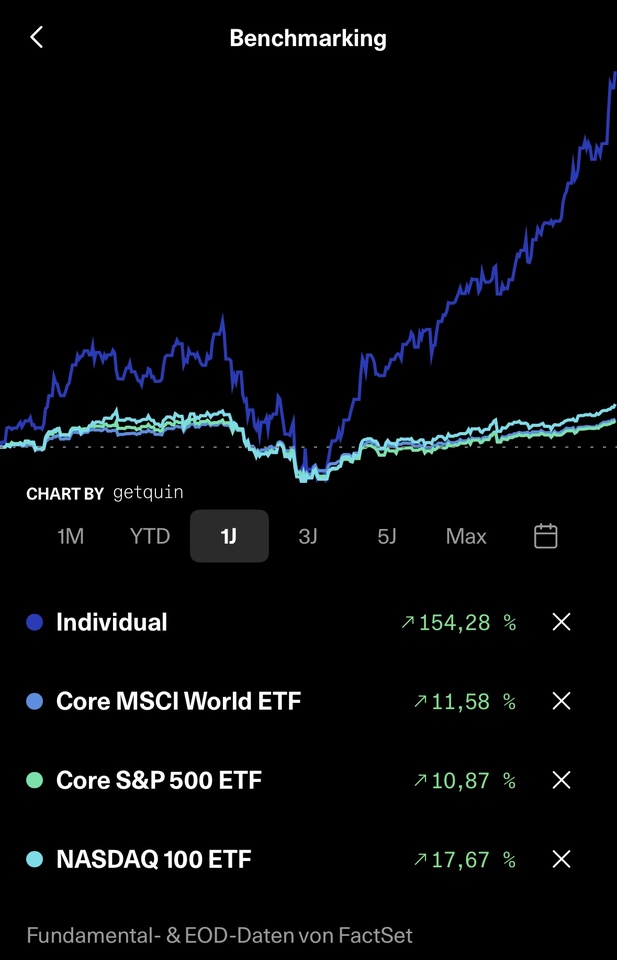
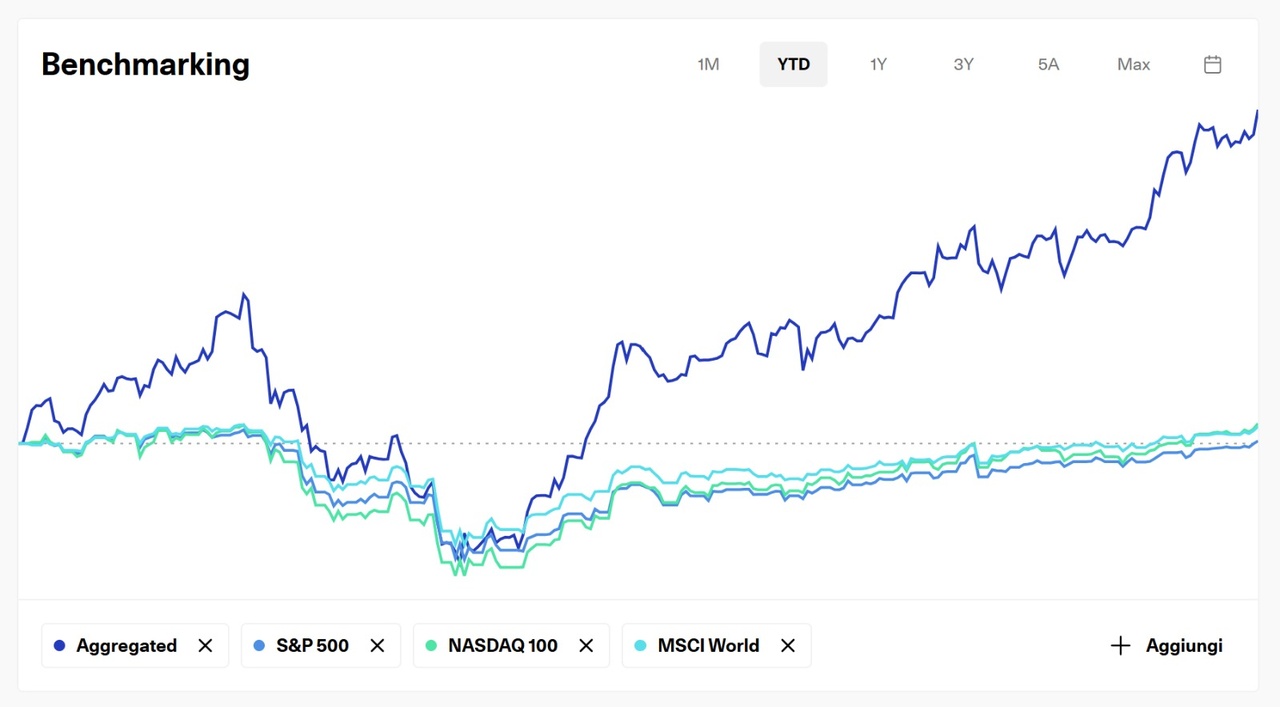
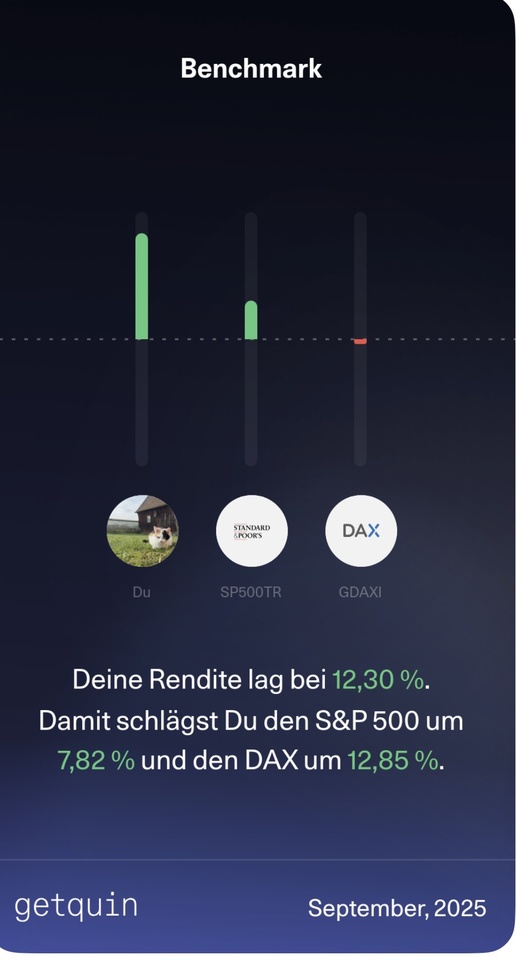
My current goal is to achieve a better return than the S&P 500 and I would like to take this opportunity to thank you for that @Multibagger
@Tenbagger2024 and @Aktienfox for your valuable contributions and inspiration.
What do I do to achieve this excess return?
- 30% ETFs as a stable core, which is fed with monthly savings plans
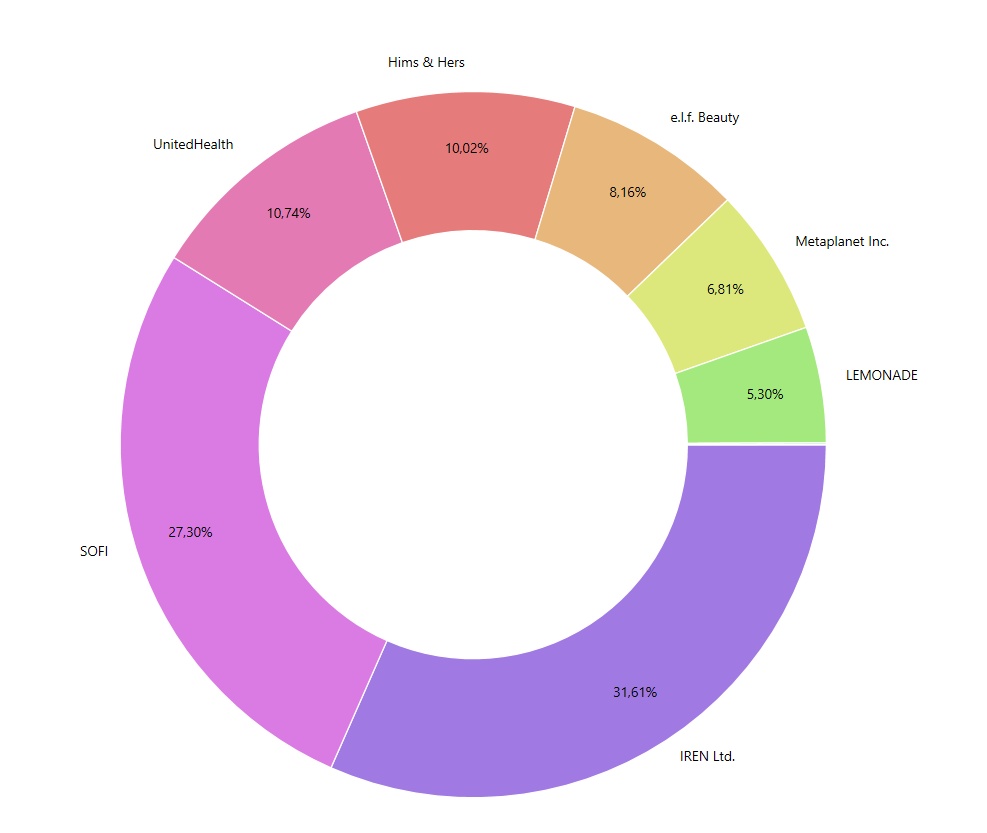
- 70% in riskier individual stocks
- Not tracked on quin: approx. 4k euros in skins in Counter Strike
As I am still very young and, due to my career choice, expect to earn a relatively solid income (which is of course not guaranteed), I believe it is currently worth taking on more risk.
I would also be prepared to invest 100% in individual shares, but I don't yet know exactly which shares and what position size. I think if you want to beat the market, it doesn't make sense to hold 30% in global ETFs.
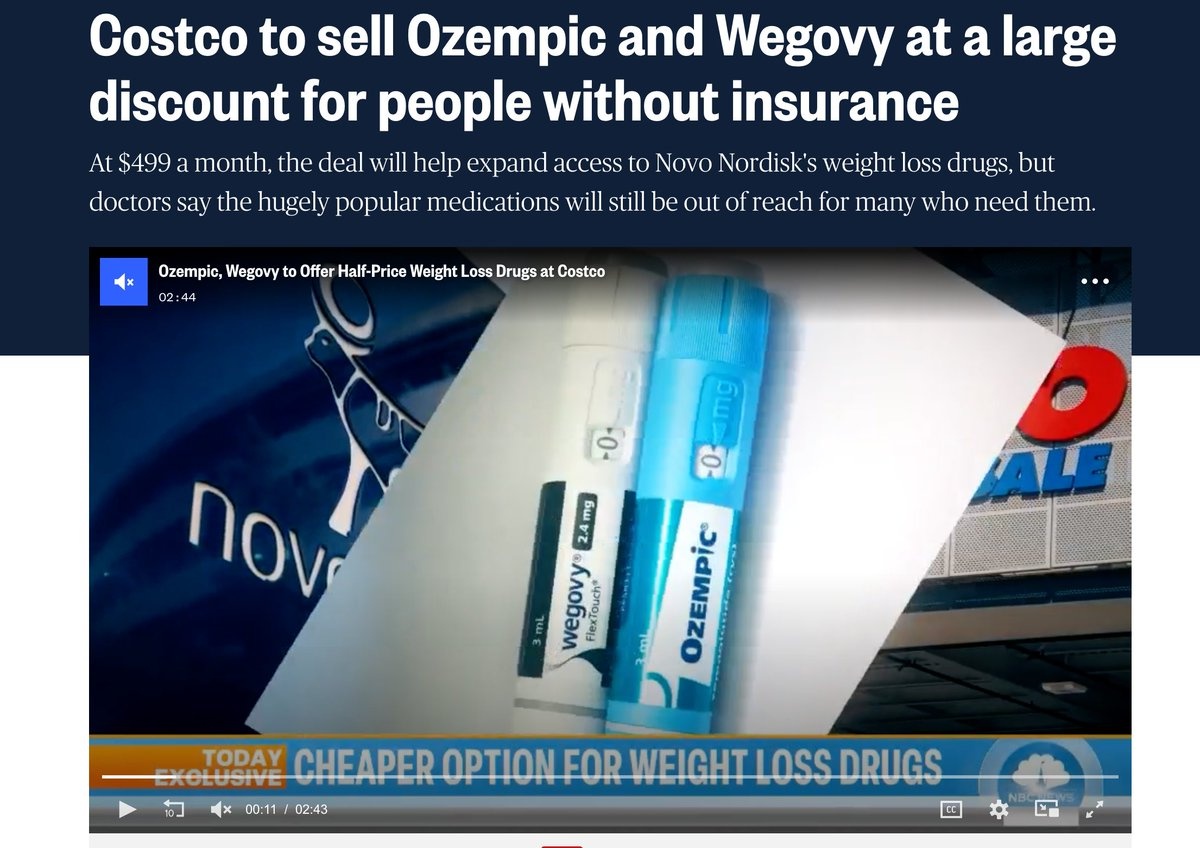
However, I am also aware that $HIMS (-8,47 %) 50% in the portfolio is already an extremely high weighting. In the long term, I would actually like to have a maximum of 30% of the portfolio in one position. But you are very welcome to share your opinion on this.
Due to my only job as a mini-jobber, I currently have the €1000 allowance on shares, as well as the €12,000 basic allowance. This means I can realize up to €13k in tax-free profits every year until the end of my studies. This is of course an additional incentive to achieve this €13k per year :)
That's it for now. Feel free to share your thoughts and I look forward to the time ahead!