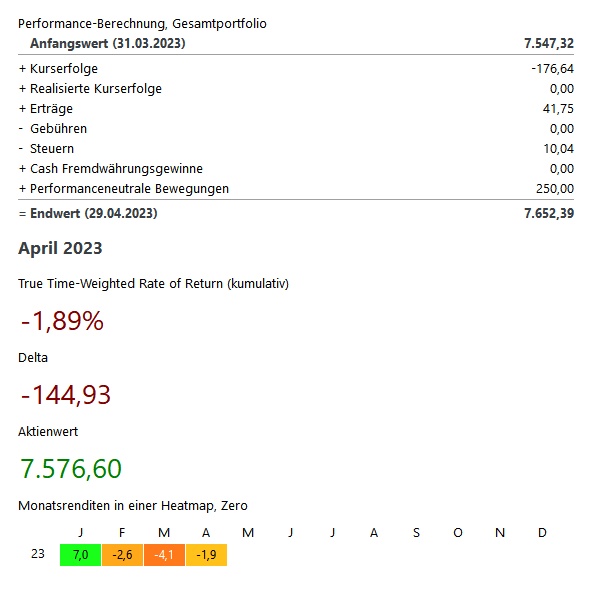
Depot Performance: April 2023 -1.89 % 📉
Top Action: PKN Orlen $PKN (-0.69%) +13,81% 📈
Flop Action: Lakeland Industries $LAKE (+0%) -18,27% 📉
Net Dividends: €31.71
Posts
4Depot Performance: April 2023 -1.89 % 📉
Top Action: PKN Orlen $PKN (-0.69%) +13,81% 📈
Flop Action: Lakeland Industries $LAKE (+0%) -18,27% 📉
Net Dividends: €31.71
PKN ORLEN S.A.: The STAR gas station as a Polish dividend star with 5.6% div. yield? (PART 3) $PKN (-0.69%)
3.cross-check of PKN Orlen S.A. using Piotroski Score and concluding remarks on the Polish energy company
Hello all,
After I placed PKN Orlen S.A. in its market structure in the previous first part of the analysis, I continued the same in part 2 with a Graham extrapolation and a market analysis.
Here in the third and last part of my remarks I will use the Piotroski Score as a validation or refutation of my statements.
Before that the Disclaimer: This is not investment advice. It is also not an invitation to buy/sell financial products. I only describe my opinion here. You have your own responsibility towards your investments. So I do not take any liability.
If you have not read the articles, you can find parts 1 and 2 here as a quick link:
https://app.getquin.com/activity/eNCwkpNXhH?lang=de&utm_source=sharing
https://app.getquin.com/activity/PuJDIhaiZQ?lang=de&utm_source=sharing
Let's start now with the evaluation of PKN Orlen S.A. via Piotroski Score. I will explicitly NOT assume that you know this and therefore take you by the hand.
What exactly is the Piotroski Score and which spice is best suited for it?
As a result, the Piotroski Score is simple and transparent: 9 different criteria are used and if the criterion is met, a point is awarded. Mathematical geniuses will immediately recognize: the maximum number of points for a company is 9 in the dream case and 0 in the case of absolute crash. In principle, it is not a new tool and its origin goes back 22 years to the year 2000 when the current Stanford professor Joseph Piotroski invented this tool (see (1), (2)).
The Piotroski Score is essentially a tool that can be assigned to the environment of value stocks, which is due to its focus on companies with a low price-to-book ratio. Thus, one wants to check whether this low P/B ratio is associated with potential economic difficulties and how high quality the company really is (cf. (2)).
In this regard, the Piotroski Score belongs to a whole range of stock valuation alternatives and compares best with those until the end of 2018. Thus, to the 2.9% annual return of the S&P 500, one still achieved 2.87 times the return via this methodology. Alternatives such as the FCF (-4.44%) or the Greenblatt formula (-4.27%) could not hold a candle to either the S&P 500 benchmark or the Piotroski score (see (3)).
Let's start with a short overview of the main test categories of the Piotroski Score (cf. (4)):
So first we test the profitability of PKN Orlen S.A. How do we do that? First, we look at the "NET INCOME" of different years and hope to find a positive value here. Normally it would be sufficient according to the methodology to look at only one year, because the Piotroski Score focuses on stable value companies. However, in order to be able to include a slight cyclicality of PKN Orlen S.A. in this analysis, I will determine the average value from 2019 to 2022 and fundamentally check their profitability in advance.
This sounds terribly complicated
It is not in the application. We average the net income of PKN Orlen S.A. in the period in question and notice that all values are positive. I calculate using (4) and (5): 41,916 zloty / 4 time periods = 10,479 zloty on average. This is significantly positive and includes the crisis year 2020. I award my first point for this (cf. (4), (5)). (1/9)
The next point relates to the return on assets (RoA), which I also mentioned and whose interpretation I already presented in the second part. Let's look at the available data from 2022, since 2023 has only just started and no reliable data are available yet. Based on (6) we get a RoA of 17.35% and in the 5-year period of 8.55%. This means that currently and on average over the last 5 years, the company has made a significantly positive net result. As a reminder, assets include real estate, stocks, bonds, tangible assets (machinery) and foreign exchange. This means that, flatly, the company has regularly made more money from its warehouses, machinery and cash assets. This tends to be very desirable. Source (6) even provides us with comparative values from industry in this regard, and despite PKN Orlen S.A.'s lower sales, the company performs at industry-typical levels. The maximum deviation is just 0.02%. This is positive in my opinion and deserves a point (see (5), (6), (7)). (2/9)
The next point is awarded for a positive operating cash flow in the current year. For this, we can also look at the cash flow per share as an example and see that it is 31.3 zloty. So 6.65€. This is also positive and the score increases to 3 out of 9. (3/9)
The 4th point is a bit more complex and refers to the ratio of operating cash flow to net income. Here it is desired that the following applies:
CF(Operative) > Net result
We draw (5) to help us and see that the cash flow is 11,953 million zloty. The net result is 23,956 million zloty. Thus, this point is not awarded, because the above condition is not met for PKN Orlen S.A. (see (4), (5), (6)).
Thus, we have "already" completed the point Profitability. Here, 3 out of 4 possible points are awarded. A relatively good result.
In the case of Leverage & Liquidity we first check whether the long-term debt has been reduced compared with the previous year. In other words, we want the company to break free of its debt grip and thus also increase its profitability, which we have just described. What is the situation at PKN Orlen S.A.?
This is a somewhat mean point of the Piotroski Score, where I think you can see the punishment of expansion via debt capitalization. Those who have read my Part 2 will remember the absolutely necessary expansion course and its justification on my part (see Part 2).
We get an expected result here: The criterion is not met. In 2021, the debt amounted to 12,235 million zlotys and in 2022 to 18,443 zlotys. Debt is also expected to increase in 2023. So it is not foreseeable that this point will change for the first time. So we are not awarding any point.
So let's look at the required "Current Ratio" and define it first. This is the English term for 3rd degree liquidity.
Ahaaa! Why don't you say that right away? (Huh?)
The liquidity 3rd degree puts the short-term assets (here by the existing assets) in relation to the short-term liabilities. This is always extremely itchy when the company can run the risk of not being able to pay its invoices due to outstanding receivables from its customers (see kebab example in part 2). We can assign the following items from current assets to assets (see (7), (8), (9)):
Current assets (UV) = Inventories + Receivables and other assets + Securities (e.g. shares in other companies) + Liquid assets (cash on hand, money in banks)
Current liabilities (CT): The counterpart to receivables are payables, which are included as follows: CT = payables from trade + payables to banks.
We subsequently calculate: Current Ratio = UV / KV
This results for PKN Orlen S.A. (cf.(6)): Current Ratio = 1.5
Thus, the current assets are one and a half as large as the current liabilities. That's good for now. What did it look like a year ago (cf. (10), (11))?
In 2021, assets amounted to 106.75 billion zloty. Current liabilities were 30.29 billion zloty. zloty.
We calculate: 106.75 billion zloty / 30.29 billion zloty =. 3.52 for 2021
This tends not to be good and indicates a declining working capital ratio. Thus, no point for PKN Orlen S.A.
The next point is the avoidance of share dilution. There are 1,160,942k shares issued in 2023 and the same number in 2022. Therefore, I award one point (4/9).
In operational efficiency, we first check if the gross margin of this year is higher than last year. The current one is 18.73%. The one of 2021 is 11.4% averaged over all quarters of 2021. This means that the criterion is basically met (see (10), (11)). We are at 5 out of 9 points.
Finally, we look at the asset turnover ratio. It is 1.61 for the last 12 months. In 2021, it was 1.11, 1.14, 1.24 and 1.38, i.e. an average of around 1.22. This means that the last criterion has also been checked and we end up with 6 out of 9 points (see (11)).
What does this tell us now?
The bottom line is that the Piotroski Score is a good value investment if the test gives 8 or 9 points. Bad are the results from 0 to 2 points. PKN Orlen S.A. does not seem to be a bad investment in itself, but it faces the challenges mentioned above and will therefore have to prepare for the future (see (1), (2), (3)).
What do you think about PKN Orlen S.A.? Does the Polish dividend champ convince you as a value investment? Feel free to write it in the comments! Otherwise, thank you for your constructive feedback on the stock!
If you are in the mood for a more "conventional" dividend company, please watch my video on Pepsi :)
See you next time!
Your Bass-T
Sources
(1) https://levermann24.com/piotroski-f-score/
(2) https://diyinvestor.de/der-piotroski-f-score/
(3) https://www.oldschoolvalue.com/investment-tools/piotroski-f-score-screening-early-often/
(4) https://www.investopedia.com/terms/p/piotroski-score.asp
(5) https://www.marketscreener.com/quote/stock/POLSKI-KONCERN-NAFTOWY-OR-1413342/financials/
(6) https://www.investing.com/equities/pkn-orlen-ratios
(7) https://www.it-times.de/news/asset-arten-bedeutung-und-definition-von-vermogenswerten-125910/
(8) https://www.informer.eu/de/buchhaltung-wiki/lexikon-fur-buchhaltung/was-ist-ein-current-ratio/
(9) https://www.investopedia.com/terms/c/currentratio.asp
(10) https://www.marketwatch.com/investing/stock/pkn/financials/balance-sheet?countrycode=pl
(11) https://www.tradingview.com/symbols/DUS-PKY1/financials-statistics-and-ratios/
#aktien
#aktie
#energie
#orlen
#aktienbewertung
#dividende
#dividenden
#dividendencheck
PKN ORLEN S.A.: The STAR gas station as a Polish dividend star with 5.6% div. yield? (PART 2) $PKN (-0.69%)
$BTI (+1.85%)
Dzien dobry w czwartek,
mam nadzieje, ze lubisz analiza czesci 1. Dzisiaj naszym tematem jest analiza zapasow spolki PKN ORLEN S.A.
And now I'll save you from my rudimentary knowledge of Polish. At least I'm trying. 😂
Let's start with my disclaimer:
Disclaimer: This is not investment advice. It is also not an invitation to buy/sell financial products. I am merely stating my opinion here. You have your own responsibility towards your investments. So I do not take any liability.
In the last part we learned a lot about the petroleum refiner and service station operator PKN ORLEN S.A. from Plock, Poland. We listened to data about the company, went into chart analysis with comparisons with the European energy sector on the one hand and with individual stars of it on the other hand, and finally got to know PKN ORLEN S.A. as a promising company that can definitely be analyzed.
If you did not have the analysis in your feed, here is the LINK to PART 1:
https://app.getquin.com/activity/eNCwkpNXhH?lang=de&utm_source=sharing
If you prefer to hear it recited, here's the Youtube video for it:
Today we start with PART 2:
2nd fundamental analysis of the stock including BASS-T analysis and Graham extrapolation.
PART 3
3. cross-check of PKN Orlen S.A. using Piotroski Score and concluding remarks on the topic
So that you don't all run away screaming because of all the technical terms, I will explain everything up front so you can follow along. If you have done something like this before or at least know it theoretically, then just think of it as a review.
It is important that these tools are logically not limited to PKN ORLEN S.A., but have to be adapted dynamically depending on the case. The main thing is that you can follow me in the most important points for now. Nobody expects you to be able to do that immediately.
Let's start!
2. fundamental analysis of PKN ORLEN S.A. including BASS-T analysis and Graham extrapolation
As usual, let's start with my consideration of key KPIs of PKN ORLEN S.A. stock and add Graham extrapolation to my analysis and Piotroski score in part 3.
In 2022, PKN ORLEN S.A. had a turnover of 311 billion zloty, which corresponds to approximately 66.007 billion euros. By comparison, Shell is "only" at 17.6 billion euros - but be careful: this only applies to the second quarter of 2022. In total, Shell is at 261.5 billion USD in 2021 which corresponds to 241.78 billion euros. In 2021, PKN Orlen S.A. reached 27,940,000,000 euros, which is rounded to about 28 billion euros. Thus, we have a petroleum company and service station operator that, in relative comparison with the largest in the industry, makes just 10.7% of its sales (see (4), (5), (6)).
However, it is the linking of the latter with its competitor Shell that is interesting, as the Shell Card can now also be used at 570 Star and ORLEN stations in Germany. The source also contains many warm words for the actual competitor in the context of an addition to the Shell partner network (see (20)).
In the year-on-year comparison, PKN Orlen S.A. achieved unsteady sales until 2021, which ran in the channel from 86,178 million zloty (2020) to 131,592 million zloty. However, since 2022, sales have increased significantly and the channel has more than tripled. Therefore, on the revenue side, we are now at 310,555 million zloty to 381,646 million zloty in the period from 2022 to 2024. Thus, on the revenue side, there is growth, which tends to be a plus.
If we look at the associated returns on sales, i.e. what is generated in profit from sales, we get a relatively diffuse picture. In the 2019 to 2021 period, the return on sales ranged from 5.2% to 9.73%. But part of the truth is that Shell did not do much better here, as its return on sales ranged from 5.96% (2020) to 12.5% (2021). In fact, TOTAL S.A. from Part 1 even underperformed the Polish hidden champion in 2020, so that TOTAL S.A. was only at 4.28% (see (6), (7), (8)).
But don't worry: it goes even deeper in the sales yield limbo. BP, as one of the larger energy companies, achieved just 1.55% more return on sales in 2019 and even fell below 0 with -1.58% in 2020. In terms of returns, PKN ORLEN S.A. is thus not at the top, but seems to have done something right in terms of resilience in the gas station crisis year 2020 vs. the competition around TOTAL S.A. and BP (cf. (6), (7), (8)).
If we look at the company's market value in addition to the increasing revenues, we see the company on a strong expansion course just since 2021, where the company's value more than doubled (increase of 210% in one year). However, the P/E ratio does not follow this development analogously, as it does not increase proportionally.
I see this especially in the rather high valuations from 8.17 times in 2019, which almost tripled to only 38.3% of the original valuation level. What does this mean now? The P/E ratio as a quotient of the current price and earnings per share, as a popular tool of stock analysis, indicates how "expensive" or "cheap" a stock is basically priced. In other words, we compare how much "distance" there is from the current price level to the earnings per share achieved. Experience shows that this value is usually high for tech companies, as they are on an expansion course and finance their growth by borrowing. Only when profits start to trickle in does the valuation level fall, for example. As a result, the P/E ratio also falls (see (9)).
In the case of value stocks, the opposite is true: Growth is usually completed and we see stable sales at the expense of a lack of growth at the technology level (see (8), (9)).
To which category can PKN ORLEN S.A. be assigned?
To be considered a value stock, only one simple-sounding condition must be met: The intrinsic value of the company must be higher than the currently traded value on the stock exchange. For this, it is necessary to analyze the company via various methods.
A typical characteristic are exemplary low valuations in the price-to-book ratio KBV. This indicates how much book value I get back for e.g. 100€. If the ratio of current price and book value per share is below 1, I get more book value than I spend. This is usually not the case with tech stocks. Alphabet, for example, is at 7.62 times in 2022. So we distinguish (cf. (10), (11), (12)):
P/B ratio <1 : Unternehmen tendenziell unterbewertet (möglicher Value Titel)
KBV = 1: Unternehmen gemäß Buchwert bewertet
KBV > 1: Company tends to be overvalued.
In the case of PKN ORLEN S.A., we see:
KBV (2019) = 0.95
KBV (2020) = 0.59
KBV (2021) = 0.63
KBV (2022) = 0.45
This means a trending favorable valuation, because each of the KBV is below 1. So we get more for our 100€. BUT: There is a small balance sheet problem here (cf. ibid.).
The book value is drawn from the fixed assets, which in turn consist of property, plant and equipment, financial assets, financial property, goodwill and patents (cf. (13)).
Now my silly question: You buy a rare patent whose value has been assigned by the original owner with 1 million Euros. But now you realize that the related product line has become unprofitable and that you will probably not need this patent anymore - but how do you now value this patent in the context of fixed assets? According to the value of the purchase (1 million €)? According to the current value for you? Now only as a part of the original sum?
While in the context of real estate, e.g. warehouses, there are standard land values or fixed (usual) depreciation rates for the value, the fixed endowment is often lost with patents, so that the valuation is not clear. In principle, a patent does not lose value through its use (cf. (13), (14)).
Companies tend to have an interest in being able to show as much book value as possible in order to present as attractive an opportunity as possible by means of KBV and BVPS (I will explain this in a moment) (cf. (12), (13)).
Therefore, this analysis is only a rough analysis on a detailed level. To really go into depth, we would have to take a closer look at the balance sheets of the respective companies and have a far-reaching idea of the respective fixed assets. Even then, a result would not be clear.
A look at the BVPS provides some insight -
The what?
The BVPS value stands for "book value per share" and is "simply" the book value divided by the number of shares traded. Here, the opposite of the KBV applies - the higher the BVPS value, the better. However, this statement must be viewed in light of the previous statements made. How I value an asset and what possibilities result from it complicate the statement of this parameter. In the case of PKN ORLEN S.A., the BVPS value consistently increases even through the crisis year 2020, from 90.7 zloty (2019) to 119 zloty (2021). This is a desirable development and it may suggest that the company has increased in terms of warehouses, patents, equipment, machinery if necessary OR alternatively fewer stocks on the market have to share the same amount of book value. Either way - book value would increase.
To roughly check this in balance sheet terms, I look at the "Assets" item and discover that this item has increased from 67,758 million zloty (2019) to 94,897 zloty (2021). Assets include fixed assets (we already know this from above) and current assets. It is more or less the short-lived brother of fixed assets and often includes items that are to be used up within one year. Appropriately, this includes inventories, trade receivables, shares in other companies, cash in the till, etc. But also prepaid expenses fall in here.
Especially the latter are always exciting, because they can be formed for many purposes. For example, I don't want to pay the rent for the warehouse I use on the balance sheet date from current assets via a reduction in cash on hand, or I don't want to have to reduce the dividend due from the net profit for the year. In this case, I may be able to set up a deferred item "Rent next year" already this year and may be able to present this as security to the investors. So much for "we will pay the rent in any case, we are solvent". Often I mean to recognize that certain behavior patterns are to address typical basic needs of investors and in this reference the prepaid expenses can play a worthwhile role. Quasi, the money is for another period of time that I can foresee now (cf. (13), (14), (15)).
In order not to go beyond the scope of this analysis, I will not discuss this further here.
Parallel to the increasing BVPS, the cash flow per share, which is considered as a trend information on the solvency of the company, also increases. It tells how liquid the company really is at the moment and whether it can service sudden investments or higher receivables on an individual share level. It is important to know that this value is inherently coupled to the industry of the associated company. For example, if I am Bumsbude A and knock out products every day (and get paid for them, otherwise receivable from LuL), I will receive continuous inflow of money. But if I am a Bumbude B and sell large equipment on an investment basis, I usually get my money only after planning, implementation and control of the project completion.
Why is this important?
It's very crucial - because I can go bankrupt despite having millions in outstanding receivables. This works quite simply and should only be explained here in outline: Your friend borrows 2€ at the Dönermann for a Coke (modest investment, I would take Pepsi). But you ordered the big kebab plate for 10€ in advance. As long as your friend doesn't give you back the 2€, you can't pay the kebab plate. Your balance sheet would then look simplified like this:
ACTIVE: 1. fixed assets (illequid): Wallet 0€
ACTIVE: Current assets: 2€ receivable from your friend, 8€ cash on hand, 10€ kebab plate as perishable stock
TOTAL 20€
LIABILITIES: Shareholders' equity 18€, trade payables 2€.
TOTAL 20€
It is important that the sum of ASSETS must always be equal to the sum of LIABILITIES. This is the principle of double-entry accounting.
The what?
Left you see where money as what available; Right you see where money come from (own capital, borrowed capital). In your case, you are in the unfavorable situation that you have a receivable open, but the kebab man wants to have his plate of kebabs paid before you. What happens? You can't pay the bill and get into trouble.
So for this it would be necessary to know how solvent the sector is. Since we are talking about the energy sector and transactions take place every day in the service station network, I initially rate the risk as low. Therefore, the responsibility of this parameter relaxes somewhat.
But what about the debt that has been mentioned?
In the case of ORLEN S.A., a typical picture of a value company emerges, as here the debt is far below EBITDA and we are virtually at only 0.35 in 2022. This means that the EBITDA of the year is completely sufficient to pay off the existing group debt. More than welcome in times of rising interest rates (see (16)).
But what does the company do with its existing fixed assets in the form of return on assets? The RoA here is between 4.26% and 10.7% and thus tends to jump, even though assets are increasing. This means that the net result has not always been at the level of the fixed assets and thus this could have been a sign of expansion. The values are considered good at >5% according to (17), but are industry dependent. This also fits into the picture around the acquisition of the OMV service station network in Eastern Germany from Part 1 (see Part 1). This therefore speaks less for belonging to the value sector (see (17)).
I have been told that in addition to assets, companies also have people. Their efficiency is assessed by the return on equity (RoE) as the division of net income / equity. How well does the management handle its own money? In the case of PKN ORLEN S.A. we see basically good values between 8.2% to 28.2% - unfortunately without trend and very volatile. One can argue whether this is complaining on a high level. Nevertheless, the value series "dances" around the average value of 12.18% from 2022 of the European energy companies, which makes me think (see (6), (17), (18), (19)).
Finally, let's look at research spending: How much is the company investing in the future? This value is very essential due to the transformation of the petroleum industry and PKN ORLEN S.A. surprises me positively here, because despite increasing sales, the percentage of CAPEX in sales remains almost the same around 8%. This would already speak for a value company whose future is to be secured (see (6)).
On the other hand, I was less pleased with the view of the earnings per share in Q4 2022, where a loss of 2.26 PLN was generated, but by means of the profits in Q3 and Q1, a dividend of 3.50€ was nevertheless paid. In 2022, PLN 6.48 + PLN 20.2 - PLN 2.26 was earned. That is: PLN 24.42 for 2022, of which only PLN 3.5 has been paid out. This would be a dividend payout of just 14.33%, so there is still room for improvement (see (6), (19)).
Let us now use the Graham extrapolation to make a judgment about PKN ORLEN S.A. based on the given values. I assume the following values:
Book value per share (BVPS) = PLN 142.
Annual growth (2021-2024): ((337300/131592)^(1/3))-1 = 36,86%
P/E ratio (2022): 2.2x
EPS: 29 PLN
Thus, according to Graham formula for the intrinsic value of the stock, we get:
=29 PLN *(8.5+2*36.86) = 2,384.38 PLN
For the maximum purchase price we get:
=(22.5*29*142 PLN)^1/2 = 304.39 PLN
According to Graham formula, the growth is very fair as expected:
=36,86/2,2=16,75 > 0,9
What is the problem? We continue to expect the company to expand strongly. However, this is not necessarily the case.
A simple example: In addition to joining Shell's partner program, PKN Orlen S.A. will buy OMV's Avanti service station network. The latter's service stations were mainly found in front of Aldi Süd stores, so that PKN Orlen S.A. with its Star and Orlen service stations could now also have a direct presence at the discounter (see (21)).
But what then?
The decisive problem with expansion courses is often market displacement or the limited potential that can still be achieved. PKN Orlen S.A. is firing from all cylinders: Participation in Shell, acquisition of complete service station networks from competitors, and since September of last year, you can now buy food with a limited expiration date via app at Star and ORLEN service stations. This is by no means a matter of course, and I interpret it very positively against the background of the figures described. For example, I'm also committed to combating food waste and think it's great that you can take gas station rolls or cakes home at a reduced price after filling up. The standards of larger service station operators are already being implemented and the assets are growing massively (see (21), (23), (24)).
Why is this problematic?
I could have ended on this note and left you with the graphic on gas station death. Here is where the industry's biggest problem can be found. While there were 46,091 gas stations registered in Germany in 1970, there were only 14,459 in 2021. That is a decline to just 31.37% of the original service station network. The number of service stations has already fallen below 20,000 since the mid-1980s. This means that a) there are fewer places to sell the product (gasoline/diesel/electricity...), b) the same number of players could have fewer absolute branches, and c) gas station operators need to revitalize their business (see (24)).
This revitalization can also be seen in the above-mentioned Lebensmittelapp and is NOT a real nice-to-have concept, but seems to me inevitable in the competition with strong brands like TOTAL, SHELL and BP. It is not made any better by the fact that the main turnover of gas station owned bistros is 60% from tobacco. It is not difficult: gas station operator realizes: fewer gas stations are more profitable, Fewer gas stations: I have more competition, Competition: I have to offer bistros, Bistros: Yes let's just take the fast moving goods (Cf. (23), (24)).
And what goods are these? Phone cards?
No: the classic cigarette pack. I have already made a video on the transformation of the cigarette industry using British American Tobacco as an example. There I pick up on the key tasks, challenges and problems facing the industry. I'll link that to you below. Feel free to watch it after this, because they are two correlated industries with different product but same task of repurposing the products.
The phone cards I mentioned account for just 10% of the sales of gas station stores in Germany and are not further relevant (see (25)).
And what about e-mobility? Couldn't that possibly save PKN Orlen S.A.?
It's not quite that easy. Although (25) says that the population of charging stations will increase, it doesn't say that this will increase the number of filling stations. In addition, despite all the constant hype, there is still no unified approach from the automotive industry. In my BMW article, for example, I talked about the benefits of having a diverse portfolio of drive types. For BMW, that's great: The e-fan gets his car, the diesel fanatic (me) too, and even in other drive forms is actively researched (see BMW contribution).
For the filling station operators, however, this is less nice - they cannot make major changes to the existing network of charging stations, which can be expanded considerably, and must continue to stock all forms of propulsion, such as fossil fuels, electricity, hydrogen, etc. This leads to considerable costs for the filling stations. As a consequence, this leads to considerable investment costs for alternative energy columns, whose product may not have any acceptance security. For PKN Orlen S.A. with the fraction of the turnover of Shell (the big player in the industry) I do not see the investment possibilities in these technologies. Therefore, e-mobility is not directly a salvation in principle, but depends significantly on macro factors on the subject of gas stations and fuel of the future.
The decisive advantage for e-car drivers can be the home charging station in the garage - for PKN Orlen S.A. this is a kick. By refueling at home, it may not be necessary to drive to the gas station depending on driving load, route, car, battery level, etc. Sources (26) and (27) represent publicly accessible instructions, price comparisons and general procurement info to this exemplarily. If necessary, e-mobility does not save PKN Orlen S.A., but perhaps makes it more difficult (cf. (26), (27)).
What is your intermediate conclusion by means of your analysis and the Graham extrapolation?
In general, PKN ORLEN S.A., as a Polish energy conglomerate, is an exciting participant in the European energy market. We have thematically covered the following:
- Sales analysis
- P/E ratio analysis
- P/B ratio analysis
- Cash flow analysis incl. first assessment of dividend quality
- Key competitors such as TOTAL, Shell and BP
- Challenges of the market
- Role of e-mobility for PKN Orlen S.A.
- Graham extrapolation isolated on company number basis
we now know at a fundamental level key relationships between the market and the company, as well as in B2B, and have developed a general understanding of the market.
In the following third and last part of my analysis I will validate or refute my statements via Piotroski Score and thus provide an open basis for discussion.
Did you like this part? Then follow me here at Getquin and on Youtube. Every follower counts 😊 Here is the promised BAT video:
AND HERE WE GO TO PART 3 SOON:
#dividend #dividenden
#dividendenstrategie
#aktien
#aktienanalyse
#etf
#emobilität
Sources
(1) https://levermann24.com/piotroski-f-score/
(2) https://diyinvestor.de/der-piotroski-f-score/
(3) https://www.oldschoolvalue.com/investment-tools/piotroski-f-score-screening-early-often/
(5) https://de.statista.com/statistik/daten/studie/159788/umfrage/umsatz-von-shell-seit-dem-jahr-2005/
(6) https://de.marketscreener.com/kurs/aktie/POLSKI-KONCERN-NAFTOWY-OR-1413342/fundamentals/
(7) https://de.marketscreener.com/kurs/aktie/SHELL-PLC-6273/fundamentals/
(8) https://de.marketscreener.com/kurs/aktie/TOTALENERGIES-SE-4717/fundamentals/
(10) https://www.biallo.de/geldanlage/ratgeber/value-aktien-was-ist-das/
(13) https://welt-der-bwl.de/Anlageverm%C3%B6gen-Definition
(14) https://www.deltavalue.de/anlagevermoegen/
(15) https://www.buchhaltung-einfach-sicher.de/buchhaltung/rechnungsabgrenzung
(16) https://www.bwl-lexikon.de/wiki/verschuldungsgrad/
(17) https://www.investopedia.com/terms/r/returnonassets.asp
(18) https://exporo.de/wiki/return-on-equity/
(26) https://www.adac.de/rund-ums-fahrzeug/elektromobilitaet/laden/elektroauto-ladesaeulen-strompreise/
(27) https://www.energieheld.de/energie-trends/mobilitaet/elektroauto/stromtankstellen
PKN ORLEN S.A.: The STAR gas station as a Polish dividend star 🇵🇱 with 5.6% div. yield? (PART 1) $PKN (-0.69%)
Czesc przyjaciele,
After my last article on e-mobility in Germany made waves and the discussion was largely objective, today we are dealing with a gas station network operator called PKN ORLEN - better known as the operator of the STAR gas stations. Thematically, therefore, we remain on the subject of mobility - only now from the point of view of the fuel suppliers.
You are welcome to read my first part on e-mobility at the following link. Please also tell me there if you would like to read a second part. I'm always happy when the contributions meet with a great deal of interest from the community:
https://app.getquin.com/activity/LsVmdGDGGm?lang=de&utm_source=sharing
Before we start as always my disclaimer:
Disclaimer: This is not investment advice. It is also not an invitation to buy/sell financial products. I am merely stating my opinion here. You have your own responsibility towards your investments. So I do not take any liability.
So that we start from the same page, I foresee the following outline:
PART 1
1. PKN ORLEN S.A in figures, data and facts - an unknown dividend star? Comparison with industry, sector and continent
PART 2
2. fundamental analysis of the share via BASS-T analysis and Graham extrapolation
PART 3
3. cross-check of PKN Orlen S.A. via Piotroski Score and concluding remarks on the topic
PKN ORLEN S.A., headquartered in Plock, Poland, is a refiner of mineral oil and is known primarily to you by a specific brand name: STAR. This is because, in addition to its role as a refiner of mineral oil, PKN ORLEN S.A. performs an important function as the operator of a network of service stations (see (1), (2)).
600 STAR and ORLEN service stations in Germany are accounted for by the German subsidiary ORLEN Deutschland GmbH alone (cf. (3)).
29 billion euros in annual sales and the addition of a service station network of OMV Deutschland GmbH, which consisted of 56 service stations after all, are decisive for the expansion course of this energy group (cf. ibid.).
These points, among others, make PKN ORLEN S.A., the umbrella company of ORLEN Deutschland GmbH, the largest company in Central Eastern Europe (cf. ibid.).
But where can I find PKN ORLEN S.A.? Where does their money come from?
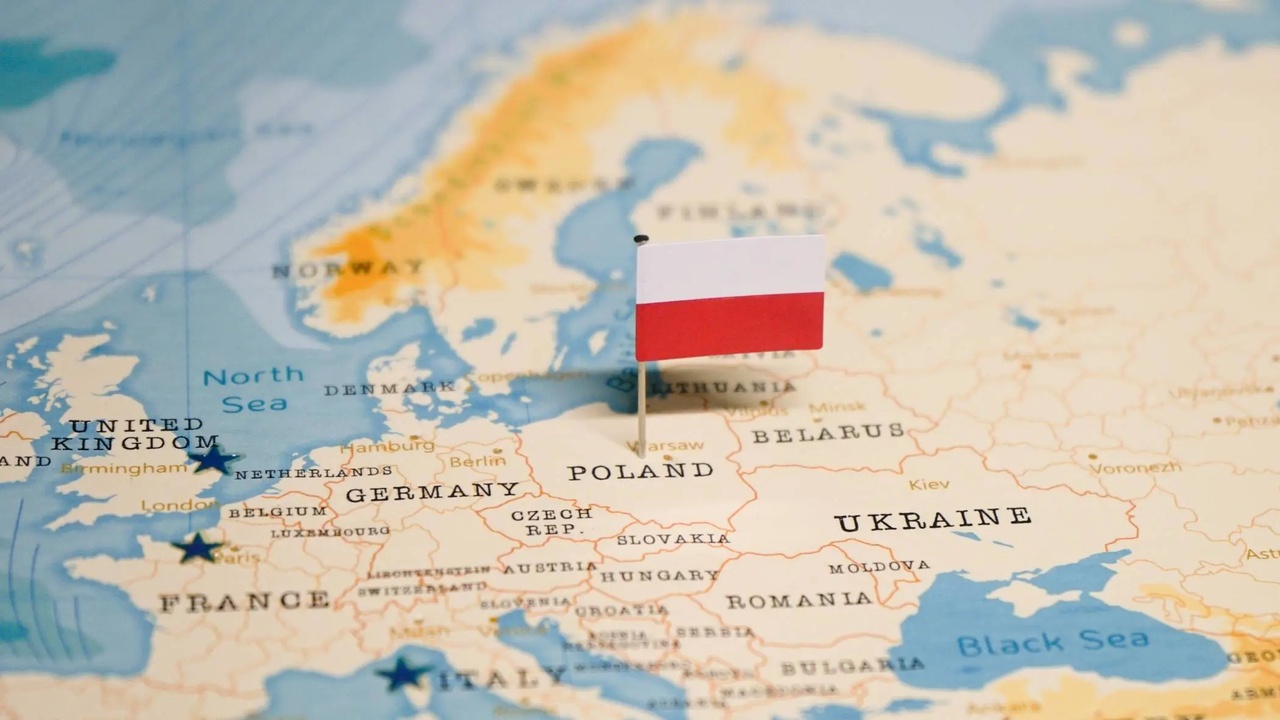
Basically, PKN ORLEN S.A. can be found in Poland, Germany and various Eastern European countries. A look at the regions tells us that the domestic market in Poland contributed to 55.9% of sales in 2020 and 54.6% in 2021. No other country achieves such high values, because if we look at the remaining countries, we see that Germany is far behind in second place with just 13.1% of sales in 2021. With the exception of the category "Other countries", the focus markets are isolated at country level in the following countries (see (2)):
- Poland (54.6%)
- Germany (13.1%)
- Czech Republic and Slovakia (11.6%)
The 4th place goes to the group of Lithuania, Latvia and Estonia. TOGETHER, these account for just 6% of sales. A look at the shareholder portfolio reveals, unsurprisingly, that the Polish government has a 49.9% stake in this utility. The remaining shares are all below 5.3% each and therefore relatively insignificant compared to the share of the Polish government (cf. ibid.).
The company is listed in a relatively niche-like manner in specific markets and indices, which include, for example, the STOXX Europe in its expansion with 600 companies. The more regionally specific STOXX Eastern Europe requires only 50 companies to include PKN ORLEN S.A. (cf. ibid.).
Upon closer examination, it is hard to argue away PKN ORLEN S.A.'s influence on the STOXX Europe 50 Index. While the top sector is NOT the energy sector, but banks with a 27.5% share, the energy sector follows in second place with a large gap to consumer staples, services, etc. A similar picture emerges in the weighting by country. Although Turkey has the largest share of the index with a weighting of 32.4%, it is followed by Poland with 32.2%. Only then come Greece, Hungary, the Czech Republic, etc., with a majority weighting of less than 10% (see (2), (4)).
Why is this so? Why is this king of the Central Eastern European energy sector so unknown? What does it offer investors, among other things?
If you look at the performance of the STOXX Europe 50, its negative return of -11.1% per annum over the last 5 years in a 5-year cycle is strikingly negative. If this is related to a single year only, it is even a proud 52.5%....IM MINUS (see (4)).
If one wants to exclude major external effects, most index operators offer a benchmark in the form of an additional index. In the case of the STOXX Europe 50, the STOXX Europe Total Market Index is used. I will go into why I find this somewhat unfortunate later.
So while the STOXX Eastern Europe 50 with PKN Orlen has lost an annualized 11.1% over the last 5 years, the STOXX Europe Total Market Index (SETM) "shines" with a return of 1.8% after all (see (4)).
What does this tell us about PKN Orlen S.A.?
Nothing to not much. Even though PKN Orlen S.A. is the largest position in the index at 6.1%. Here are my 3 thoughts on why this sector comparison is too macro and can only provide a rough overview of PKN Orlen S.A. (see (3), (4), (5)):
1) The industry structure of the SETM is unequal - The related index of the STOXX Europe Total Market Index is logically much broader in terms of its overall industry structure and includes markets in which PKN Orlen S.A. is not active.
2) The energy sector is only a minor sub-factor with just 6.6% in 5th place.
3) At most, Germany in 4th place in the index weighting represents a main market for PKN Orlen S.A..
Why do you explain this?
In fundamental analyses, you can start from the small (i.e. the group), approach the medium (i.e. the energy sector of Central Europe) to the macro level (the associated index - in this case: the STOXX Europe Total Market Index). I always choose this approach when I want to analyze a single company on its own.
We now know that PKN Orlen S.A. is part of an index that has performed 11.1%+1.8% = 12.9% worse than the broad European market over the last 5 years (see (4), (5)).
Is that it already? Can we go home already?
No - because we are comparing sector bets here (STOXX Europe 50 Total Market Index) with the broad European market (STOXX Europe Total Market Index). We now have to do two things according to the previous explanations:
1) How does PKN Orlen S.A. perform in isolation compared to the benchmark index?
2) How does PKN Orlen S.A. perform compared to the energy sector?
3) How does PKN Orlen S.A. perform compared to "common" dividend stocks from the energy sector?
We start with 1) the benchmark index. Using (6), I compare the largest position of the index with itself and find relatively significant differences. Year-on-year, the index underperforms PKN Orlen S.A. very significantly. We recognize:
PKN Orlen S.A. has lost about 26.10% in value, but the benchmark index has been MINIMUM 20% weaker than PKN Orlen S.A. since February 2022. In fact, the largest difference was reported in July 22: PKN Orlen S.A. at 90% (i.e. 10% loss) and the benchmark index more than 58% worse in comparison with just over 38% value retention since one year. The 200-day moving average is almost at a 45° angle, approaching the -48% mark from almost 0% divergence in January 2022. The 50-day average shows the decline of the index all the more, but it has been below the real price since the end of October (see (6)).
What does this tell us?
It is relatively simple: In the long term (200-day average), the index has performed much stronger and is far from reaching its original potential. In the short term (50-day average), it seems that a first recovery has already started in relative terms since the end of October and the price is approaching its long-term trend again. If one were in an unknown market, one could thus conclude a sudden and devastating event, whereas first recovery tendencies are visible (see (6)).
If we extend the chart analysis to the 3-year cycle, we get a surprising picture. PKN Orlen S.A. underperformed the market and this by an average of about 10% up to the described 1-year period. The long-term trend, shown here via 200-day moving average, illustrates the immense volatility potential of the STOXX Europe 50. However, against the background of the lack of diversification of only 50 companies by market capitalization, this is hardly surprising and highlights a typical sector betting problem. Contrary to popular belief, there is NO "free lunch" on the stock market - the more diversification the less potential return (cf. (6), (7)).
The present sector development underpins my opinion more than clearly at this point: If I want more return, I have to turn the risk screw. In the following, I call this the risk-return tradeoff. I would like to dwell in particular on the key opinion (3) of source 8. Translated into German, this states:
"Investors use the risk-money tradeoff to make decisions about individual investments [here that would be PKN Orlen S.A., author's note] and entire portfolios [that is done by the respective investor for himself, author's note]" (source (8)).
The STOXX Eastern Europe 50 Index failed as a sector bet against the investment in PKN Orlen S.A.. It must therefore be stated here that in this comparison no conclusion can yet be drawn against PKN Orlen S.A.. We now know:
Let's now look specifically at the energy sector and put PKN Orlen S.A. in relation to the iShares MSCI Europe Energy Sector UCITS ETF. This ETF includes only energy companies from Europe and focuses on high and mid cap positions. It was launched in November 2020, consists exclusively of equities, and as many as 99.98% of the companies included are ESG screened. So there is data available for these companies, which shows that the data quality on the companies is high quality.
If we look at the top positions, we notice an absence of PKN Orlen S.A.. Instead, Shell, Total, BP are in positions 1-3 and occupy 68.03% of the index (see (9)).
Why then is the ETF optimal for comparison?
All companies are directly or indirectly compared to PKN Orlen S.A. via their service station network or their petroleum exposure, so we can see an isolated difference to PKN Orlen S.A. in the composition here.
If we compare PKN Orlen S.A. with this sector in a 1-year comparison, the difference between the two financial products is 25.02% in favor of the ETF. However, the truth is also that PKN Orlen S.A. outperformed the market from December 2020 up to and including January 2022, and at its peak it did so by up to 50.51% in October 2021. Due to the particularly short-term trend in the 3-month comparison, we notice an alignment, so that the current difference between the market and PKN Orlen S.A. is approximately 8.71%. It can therefore be stated that PKN Orlen S.A.:
Just to clarify the latter, I will follow with a quantitative stock analysis in a moment. I use charts only to visualize a result.
Let's take a look at a very mean comparison of a) the energy sector ETF and b) PKN Orlen S.A. with the Überkings Shell, Total and ExxonMobil.
Year-on-year, Shell's performance towards the end resembles that of the market, with a relatively strong outperformance visible initially. In May, this was as high as +23.15%. In this time horizon, Shell has thus adjusted to the market. Total, on the other hand, shows a rather clear underperformance of the market potential, which is particularly evident throughout the chart. It is irrelevant whether I refer to April (-20% in comparison), May (-10% in comparison) or even November (approx. -10%). This energy giant is clearly underperforming the market here.
ExxonMobil, on the other hand, is well above the market with a 37% difference and has consistently outperformed year over year. So what happens if I take PKN Orlen S.A. into the comparison with these giants and take out the sector ETF?
In the 3-month comparison we see a surprising result: PKN Orlen S.A. is the clear winner purely driven by performance, with a value gain of approx. 24%. Even ExxonMobil achieves only 1 percentage point more and finishes in 4th place. It is followed by Shell in 3rd place and Total in 2nd place (see (11)).
In a year-on-year comparison, however, PKN Orlen S.A. does not stand a chance and finishes with a difference of approx. 25%+15% = 40% to the third-place finisher in the form of Total Energies S.A.. Shell's difference is only insignificantly above at approx. 43% more return than PKN Orlen S.A., while ExxonMobil makes the rocket and closes relatively with approx. 80% more return (see (12)).
A devastating result.
Is that it for the Polish champion?
I don't think so - in my opinion, the current situation points to a competitive hidden champion, which is not without reason considered the largest Central Eastern European energy company and is essentially a sector leader in ETFs. Moreover, we have been talking exclusively on a fundamental-chart level so far.
What we have not done is to analyze PKN Orlen S.A. stock too quantitatively.
This will happen in the following second part! You will find it here for reasons of clarity and CCF competition:
PART 2:
https://app.getquin.com/activity/PuJDIhaiZQ?lang=de&utm_source=sharing
If you are also interested in the ASAHI Group, the Gladstone family and general market views and exciting topics, I encourage you to follow me on Getquin and Youtube 😊
Both are my homebases and I do best with my more in-depth content there.
My next ambitious goal on Getquin are the 900 subscribers subscribers by June 2023 and on Youtube I would like to reach the from currently 205 subscribers to reach the 300 mark by then as well.
But for that I also need your feedback! Did you like it? Do you feel ready for the stock analysis now? Every constructive opinion counts 😊
If you are more interested in PepsiCo as a seasoned and better known company, you can find my latest analysis attached.
Thanks a lot!
Your Bass-T
#dividende
#dividendencheck
#aktien
#aktienanalyse
#etfs
#etf
#orlen
Sources:
(2) https://www.marketscreener.com/quote/stock/POLSKI-KONCERN-NAFTOWY-OR-1413342/financials/
(3) https://www.orlen-deutschland.de/DE/UberORLEN/Ueber-Orlen/Seiten/UeberOrleninDeutschland.aspx
(4) https://www.stoxx.com/document/Bookmarks/CurrentFactsheets/EEBCV.pdf
(5) https://www.stoxx.com/document/Bookmarks/CurrentFactsheets/BKXGV.pdf
(8) https://www.investopedia.com/terms/r/riskreturntradeoff.asp
Top creators this week