1Yr·

Depot review August 2023 - The rainy summer 2023 is coming to an end, in the depot as well as in nature everything green. Will a red September follow?


The August 2023 was like the summer in general a rather mixed affair.

The portfolio stood in between at almost -5%, to then close at the end virtually unchanged

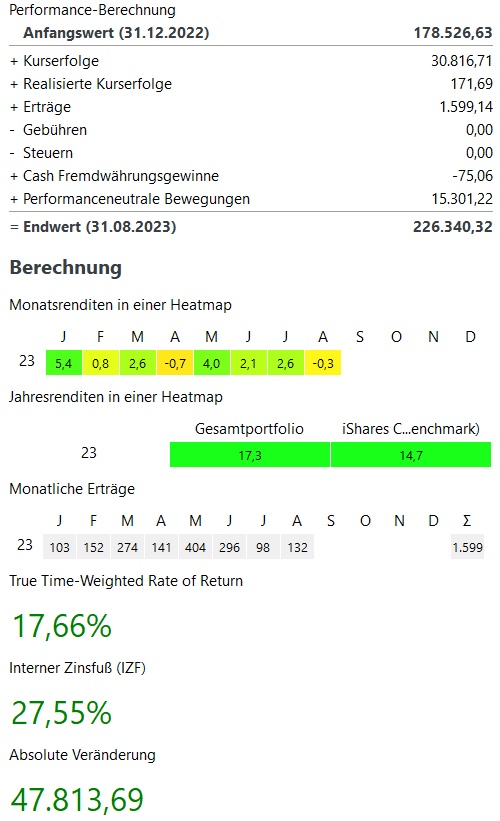
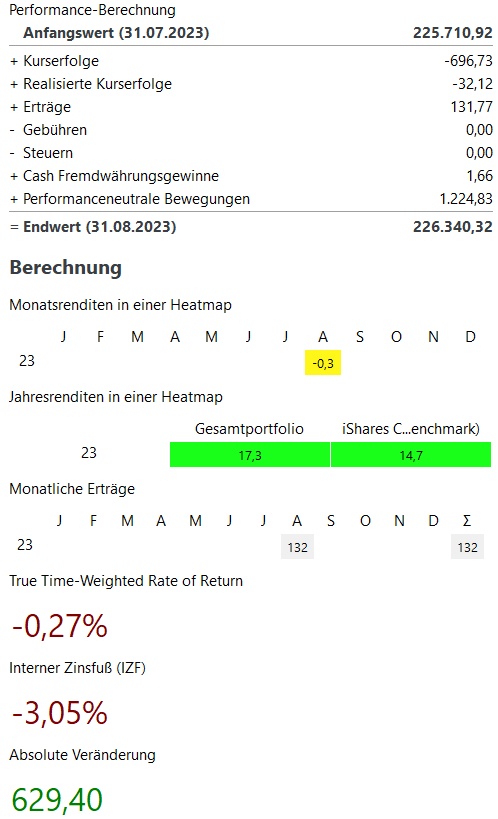
In August, my portfolio closed with -0,3% virtually unchanged. In contrast to August 2022 with -2.4% but a better development.


In the current year, my performance is currently +17,4% and thus still above my benchmark (MSCI World +14.8%).


In August, NVIDIA again $NVDA performed extremely strong with +7% / + 800€. In percentage terms, however, some stocks performed even stronger in August, right at the top with +18% each Novo Nordisk $NOVO B and Atlassian $TEAM (+1.07%)

On the losing side, there were a few classics in August with, among others. $SE (+1.06%) and Block $SQ (+1.13%) - But both rather smaller positions. In addition, the uncertainties around China have also weighed on my China ETF $MCHS (-0.24%) burdened with about 500€ price losses.


In total, there are almost 700€ price losses in August.

1,200€ were invested by me net, which results in a small absolute increase of just over 600€.


In total, my portfolio still stands at ~226.000€. This corresponds to an absolute increase of ~48.000€. in the current year 2023. ~31.000€ come from price increases, ~1.600€ from dividends / interest and ~15.000€ from additional investments.

Thus, there is still a shortfall of ~€6,000 in price gains to make up for the ~€38,000 in price losses from 2022.


Dividend:

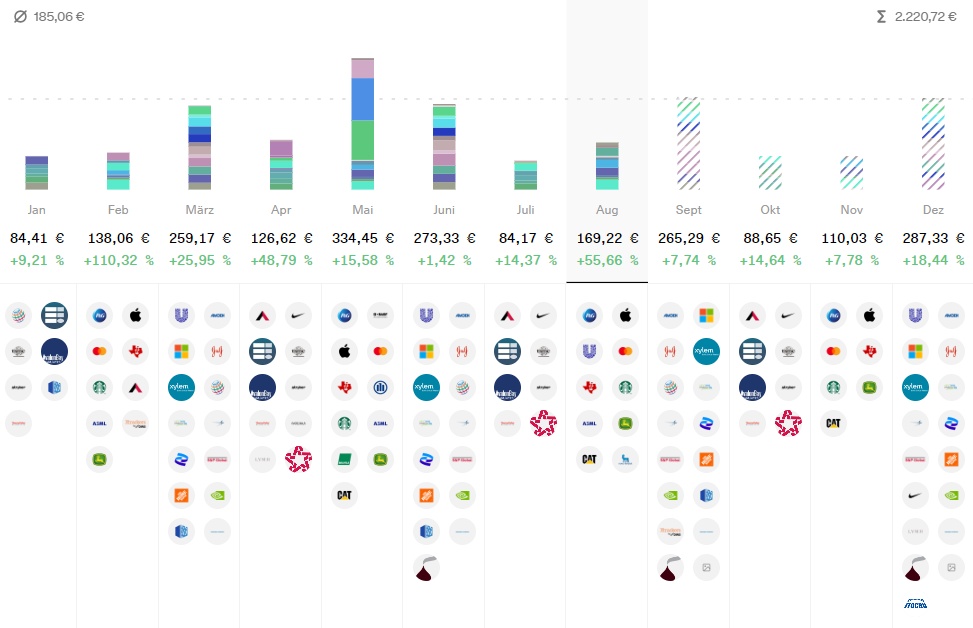
  • The dividend comparison to the previous year is slightly more difficult this month, as Unilever distributed in August instead of September as usual and my Japan ETF will distribute in September instead of August.
  • Therefore the dividend is +56% above the previous year. Without the Unilever dividend, it would be about +19% and +40%, respectively, if my Japan ETF had paid out in August as before
  • In the current year, dividends are up +22% after 6 months over the first 8 months of 2022 at ~€1,500


Purchases & Sales:


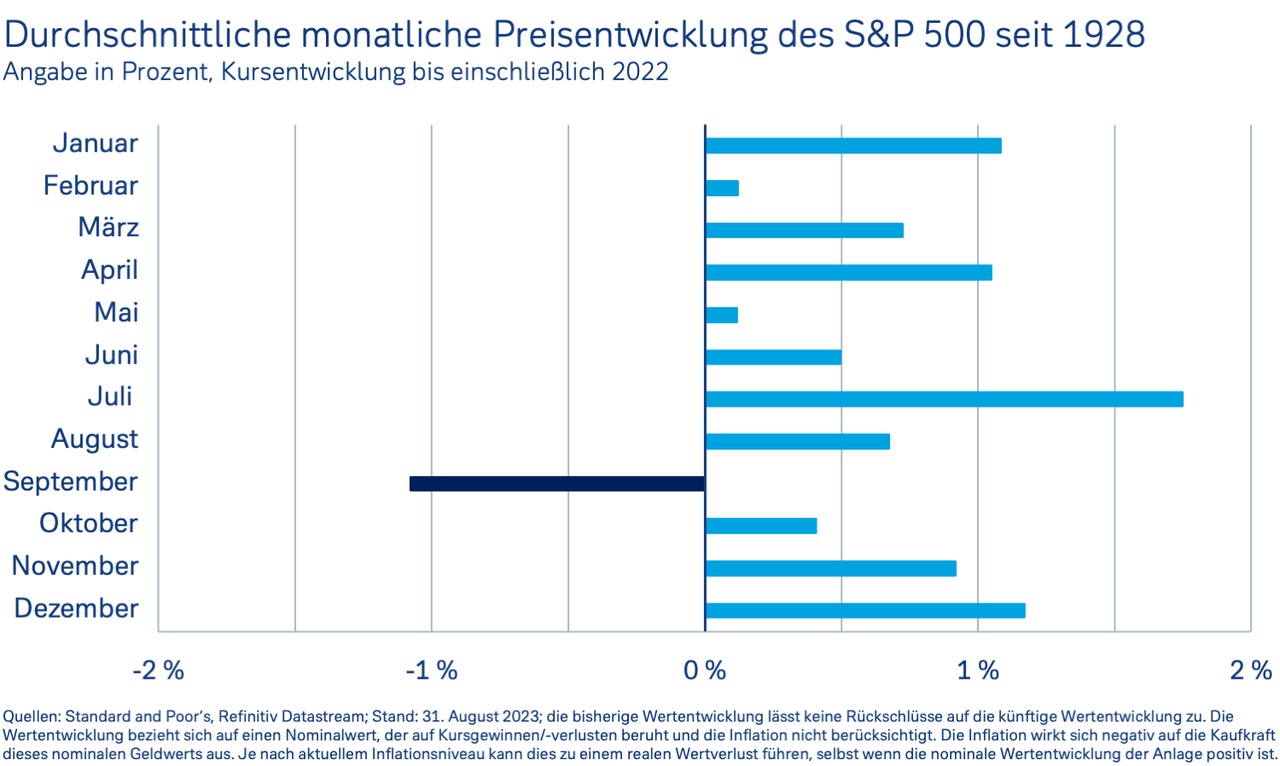
September is now the worst of all stock market months and also the only one with a long-term average negative performance.

In the appendix you will find an analysis of the S&P 500 development from 1928 to 2022. While the months July, December, January and April belong to the best, the S&P 500 loses ~1% in September on a long term average..

Various studies have already looked into this, but have not found any real reasons for this underperformance.


So at least statistically nothing stands in the way of a slight correction in September - Also in my portfolio all 3 September since 2020 were negative, so let's see what this September will bring.


What do you expect for September?


#dividends
#dividende
#rückblick
#depotupdate
#aktie
#stocks
#etfs
#crypto
#personalstrategy
attachment
attachment
attachment
attachment
Check out my Dashboard now!
33
22 Comments

profile image
Why don't you use getquin's performance analysis and heatmaps? :)
10
profile image
@christian In fact, primarily habit and the possibility to really configure everything manually (For many probably a nightmare :D). Portfolio Performance I therefore already use since 2016 and have configured the program exactly so that it represents the optimal view for me. If screenshots from other programs are not desired, but I can of course understand.
1
profile image
Would love to do that too, if you could cleanly include a clearing account - just to name one option where PP has a head start.
1
Deleted User
1Yr
Comment was deleted
profile image
@Mister_ultra No problem with the screenshots, just asked to know if something is missing or not working for us :). PS: Nice portfolio!
1
profile image
@randomdude Yes - Cash import we need to improve and we are already on it.
2
profile image
@D-Duck But does PP offer live prices? Or what exactly is better solved there?
profile image
@christian For example, it would also be nice to be able to see the heatmap not only quarterly but also monthly on the cell phone.
1
profile image
@christian All right, got it! I can also only join @D-Duck! You do a super good job and I am mega happy that this platform exists. That's why I like to use both: - getquin for sharing, on mobile and for a nice, efficient display - PP I use on PC and to generate a very individual view (e.g. the possibility to categorize stocks into sectors that are logical for me, heatmaps that show only certain parts of the portfolio,...). But of course all connected with manual work and focus on things that are probably not important for many people
2
profile image
@christian maybe because you need Getquin Premium for the heatmap view and PP offers it for free 🤷🏻‍♂️
4
profile image
@christian No, PP does not have the live prices and they are really ingenious at gq. However, what is better solved in PP: a) The clearing account with all performance-relevant details such as fee and tax credits, b) Generally the topic of accuracy (e.g. decimal places for fractions and c) Consideration of all performance-relevant factors in the chart display. The possibility to show the performance of a portfolio really comprehensively would also bring new aspects to this community in terms of content. Often only single trades are shown here. This is quite nice, but if over a long time 80% of the assets are on the clearing account, this contributes little to wealth creation. If you had a comprehensive view in the app, that would broaden the view.
View one more answer
profile image
Strong portfolio
1
profile image
1
profile image
Beautiful portfolio. 😋 I'm still a little away from...from the size 🙃
1
profile image
@Bart_S You're still little. Wait until you are a real homer
1
profile image
@Bart_S as always, size doesn't matter 😉😂 Seriously, investing in particular simply takes time.@DividendenWaschbaer To quote Homer: I have 3 kids and no money. Why can't I have no kids and 3 money?
2
profile image
@DividendenWaschbaer that's probably right 😅
profile image
Have you really invested over 200k at 0€ fees? Since I am with my 799 € I have already thrown the comdirect in the greedy maw really bad. Buy now also only about 0 € / 1 € broker
profile image
@CMustermann No, actually not. Especially in the early years before the neobrokers I had to pay more often around ~8 euros per trade, since a few years I only trade via Trade Republic and that mostly by savings plan - Therefore I really have very low fees. But they are still not 0, just as of course the taxes. I have decided for me that I track my portfolio but only on a gross basis, because fees and especially taxes change too often. In addition, I compare myself with a benchmark that does not include fees and taxes. To compare with equal, I do not track fees and taxes :)
1
profile image
@Mister_ultra makes sense, thank you. I also started in 2019, when free trading was not yet so widespread
profile image
You invest for the long term and analyze your portfolio every month? Ok. Good performance in any case
profile image
@SquirtGame I invest for the next 40 years and still look every day in the depot ;) The one has nothing to do with the other for me. Stock market is also partly a hobby, so I always like to know what's going on, but will not buy or sell because of every little thing.
1
Join the conversation