
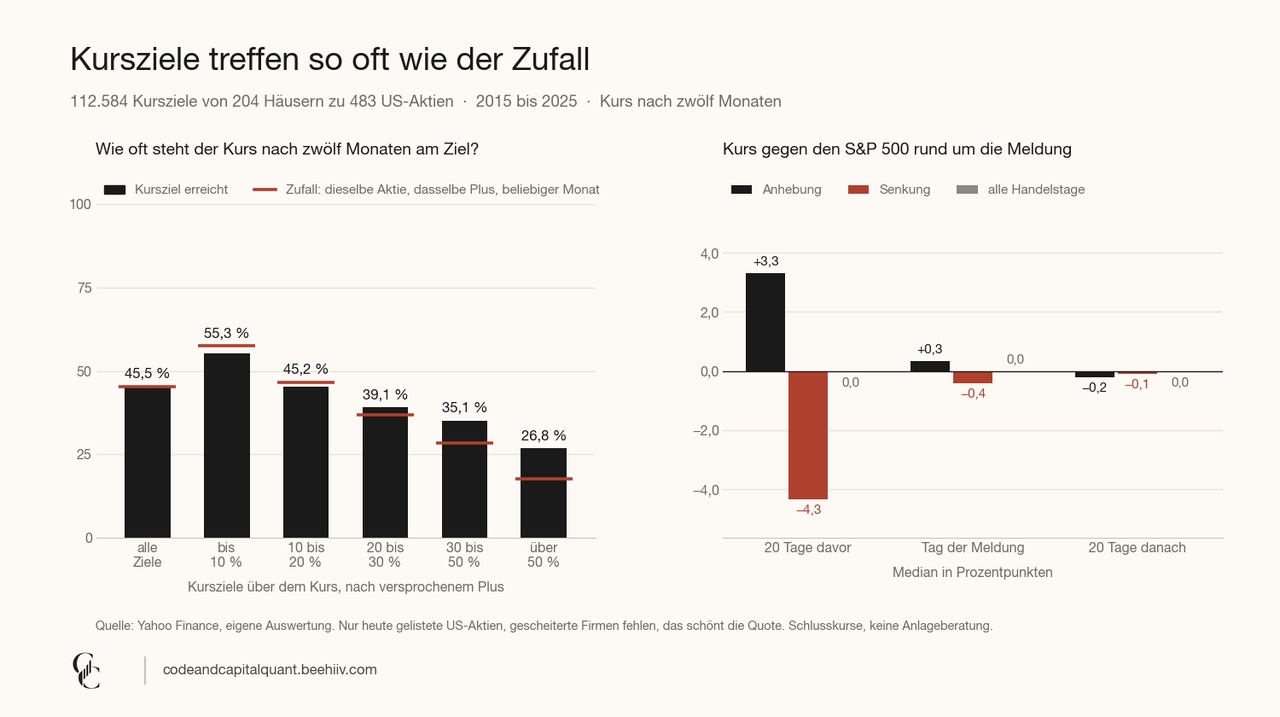
45.5 percent. That’s how often a stock was at or above its price target 12 months after the target was set. I counted all price targets that were higher than the stock’s price at the time. That came to 97,872 U.S. stocks, issued between 2015 and September 2025.
I started this because almost every stock news report includes some kind of price target. I wanted to know whether these targets are worth paying any attention to at all.
On its own, the number doesn’t mean much. You can’t tell whether 45 percent is good or bad without a comparison. So, for each price target, I recalculated the same stock without using an analyst’s estimate. I assume I buy at the beginning of any given month between 2015 and 2025 and see if the stock achieves the same gain in twelve months that the analyst promised. This is more a reflection of the stock’s baseline performance than pure chance. It works out 45.3 percent of the time. The difference is two-tenths of a percentage point.
🔎 Where the numbers come from
The data is from Yahoo Finance. There, for U.S. stocks, every upgrade and downgrade is listed along with the date and price target from the respective firm. I tested 112,584 price targets from 204 firms for 483 stocks, all at least one year old. The starting point is the closing price on the day before the announcement. I adjusted targets from before a stock split to today’s price basis. Otherwise, for Nvidia, $NVDA (-1,61%) every old target would have been significantly too high. I excluded 93 obviously incorrect entries, such as a $5 price target for Eli Lilly $LLY (+3,15%) at a price of $71.
1️⃣ More Promised Than Delivered
On average, a price target is 14.9 percent above the current price. After one year, the stocks delivered an 11.7 percent return. A good third were even in the red after twelve months, even though an analyst saw upside potential.
The stock price has hit the target significantly more often. In 68.9 percent of cases, it reaches the target at some point during the year. On the reporting date, it’s above the target in 45.5 percent of cases. Of those that reach the target, about two-thirds maintain that level until the end of the year. One-third fall back below it.
The higher the target, the less often it is met. For modest targets of up to 10 percent, the stock actually outperforms without an analyst, 57.5 to 55.3. For gains of over 50 percent, analysts are clearly ahead, 26.8 to 17.7. That sounds like a signal, but I’d be cautious. My data only includes stocks that are still in my portfolio today. This means that, especially with the bold targets, the failures are missing from the picture.
The recommendation itself isn’t very helpful. Price targets with a “Buy” recommendation promise a median of 18.2 percent and deliver 12.4. Price targets with a “Hold” recommendation promise 7.0 and deliver 10.0. The difference between the promise and the actual result is 11 points; in the end, it’s 2.4.
2️⃣ The Firm Matters Less Than the Year
Of the 2020 targets, 76.4 percent were correct; of the 2021 targets, only 26.3 percent were. How well a given year’s targets perform depends primarily on how the market performs afterward.
The 47 firms with at least 300 targets ranged from 39.1 to 59.1 percent. I stumbled when looking at the best and worst-performing firms. It’s the same bank. SunTrust Robinson Humphrey has been called Truist Securities since August 2020. The 20-point gap is therefore likely due to the time period and not the analysts.
3️⃣ First the price, then the target
This surprised me more than the accuracy rate. In the 20 trading days leading up to a price target increase, the stock was, on average, 3.3 percentage points ahead of the S&P 500. In 70 percent of cases, it outperformed the index. Before a price target cut, the opposite was true: it trailed by 4.3 points. On a normal trading day, this figure is zero.
After the raise, nothing happens. Twenty trading days later, the stock is, on average, 0.2 points behind the index. The price target trails the stock price, not the other way around.
On the day of the announcement itself, a price target increase barely moves the stock price—by a median of 0.3 points relative to the index. The situation is different when a firm changes its rating, for example, from “Hold” to “Buy.” In that case, the move on that day is 1.1 points, with an upward move in 76 percent of cases. After that, nothing happens there either.
⚠️ Where the Test Has Gaps
It only includes U.S. stocks; Yahoo almost never has ratings for Europe and Asia. Many targets for the same stock overlap in time, so the cases are not independent of one another. Dividends aren’t factored into the hit rate. Failed companies are missing. This skews the analysts’ hit rate and that of stocks without analysts; I can’t say whether the two are equally strong.
Price targets are definitely inaccurate. According to my data, they’re not worthless—the information is just quickly reflected in the price. Incidentally, as of September 20, 74.6 percent of the 870 stocks in my universe have a consensus rating of “Buy” or “Strong Buy.”
❓ Do you look at price targets when buying? And if so, do you look at the target price itself or at which analyst is raising it?
👇 Let us know in the comments!
🗞️ Once a month, I send out the top 50 list from my model, including all six factor scores: codeandcapitalquant.beehiiv.com
Not investment advice; based on my own research. Past performance is not indicative of future results.
