
As things went quite downhill yesterday evening, here is an updated status of the project. A weekly review probably makes little sense while the stock market is still open.
Future updates will be posted on Saturdays or Sundays.
_________________________
The first full trading week of 2026 is over - and contrary to expectations, it was probably greener than expected (for you too, I'm sure) ☘️
Let's take a look at the current status of the project together:
As a reminder, the project started with around €2,500, which was divided almost equally between the five stocks in the portfolio.
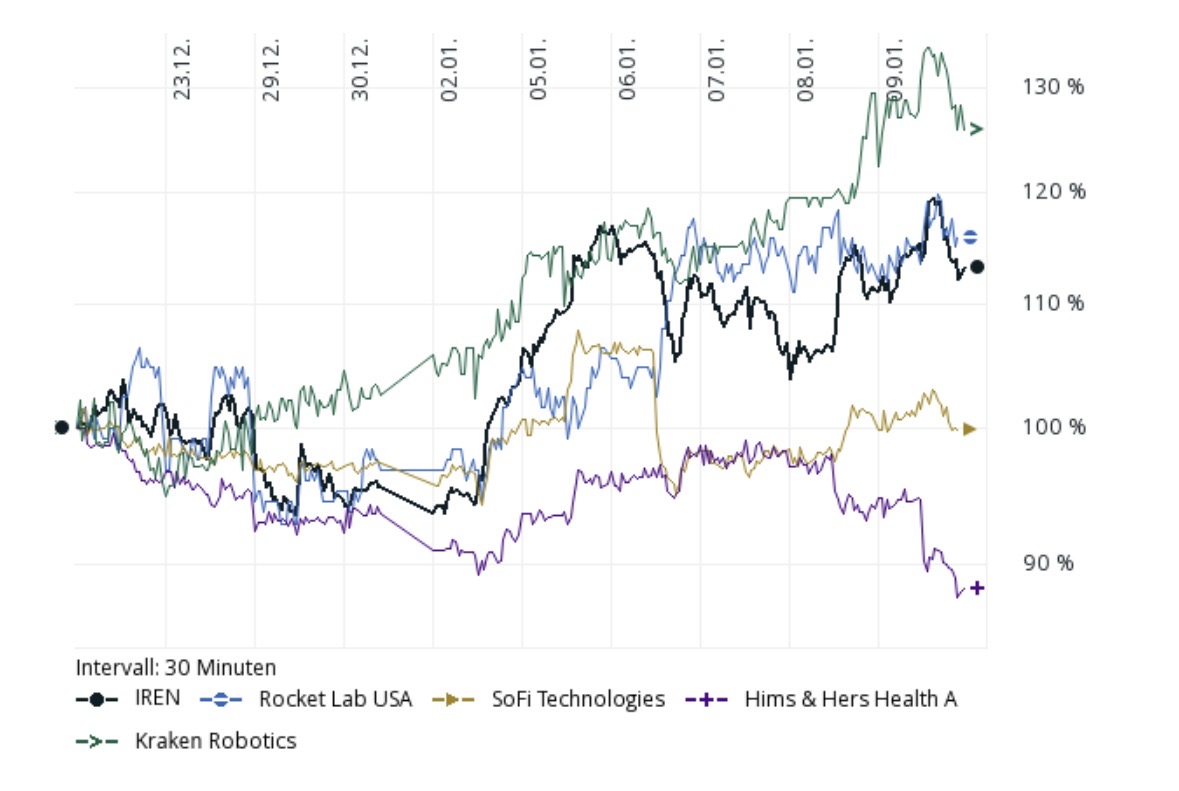
Below are the five stocks selected by you for the project and their performance to date since 12.11.2025:
- Rocket Lab +61,34% 📈
- Since last week: +20.08% 📈
- Kraken Robotics +40,56% 📈
- Since last week: +22.78% 📈
- SoFi Technologies -15,72% 📉
- Since last week: +2.69% 📈
- Iris Energy -17,41% 📉
- Since last week: +18.13% 📈
- Hims & Hers -21,08% 📉
- Since last week: -6.39% 📉

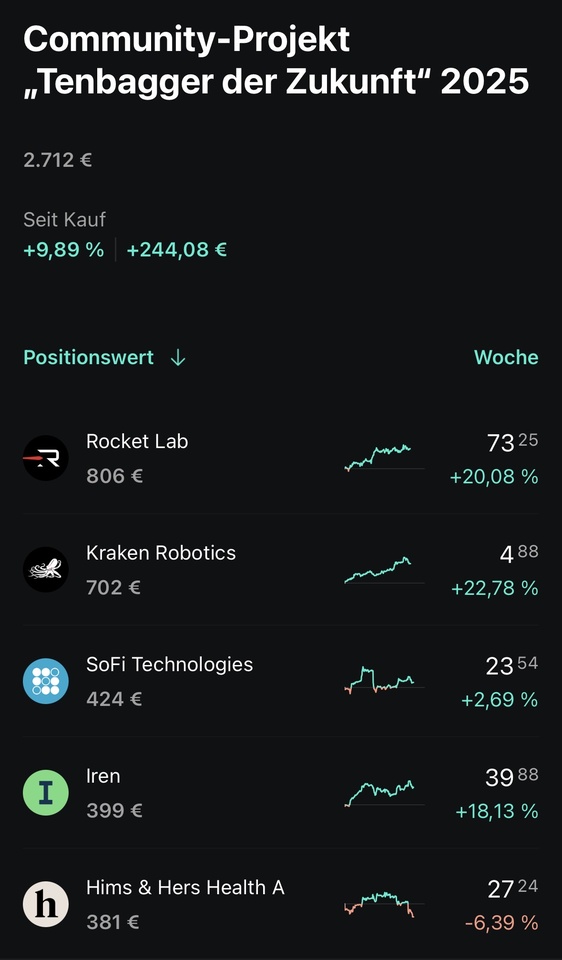
This week's top performer is therefore Kraken Robotics, closely followed by Rocket Lab and Iris Energy.
Bringing up the rear is Hims & Hers - last week Iris Energy was at the bottom, but managed to make up a few percent this week!
_________________________
The beta value is: 1,79
The beta value (β) of a share measures its performance
Marktvolatilität compared to the overall market: a beta of 1 means the share moves in sync with the market; a beta > 1 means it fluctuates more (e.g. at 1.5 it rises or falls by 1.5 % if the market rises/falls by 1 %); a beta < 1 shows less fluctuation, while a beta < 0 indicates an opposite movement to the market. It helps investors to assess the systematic risk (market risk) of a share.
_________________________
Due to the high volatility, the stocks are represented as follows
Rocket Lab: 29,72%
Kraken Robotics: 25,88%
SoFi Technologies: 15,63%
Iris Energy: 14,71%
Hims & Hers: 14,06%
_________________________
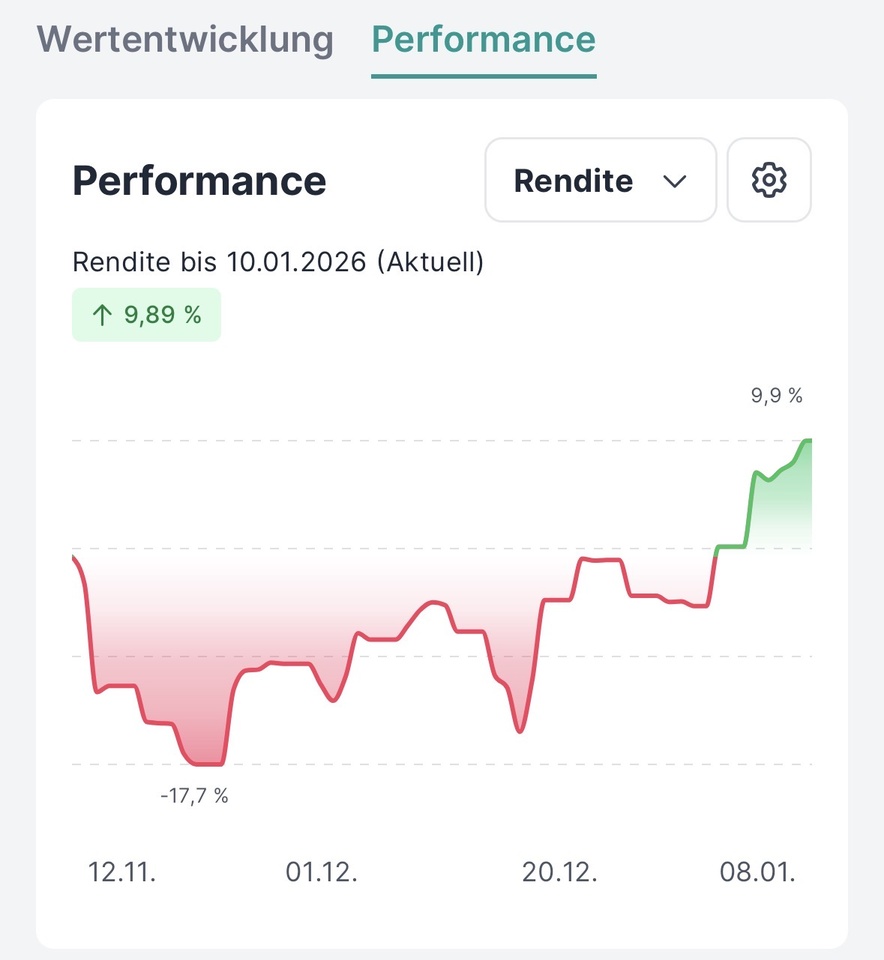
Yield:
Since the start of the project:
The return on the portfolio is currently positive and is at +9,89% 📈, at the last update it was still at +1,9%📈. It has therefore increased more than quintupled🥳
The yield reached its lowest point on 21.11. at -17,7% 📉
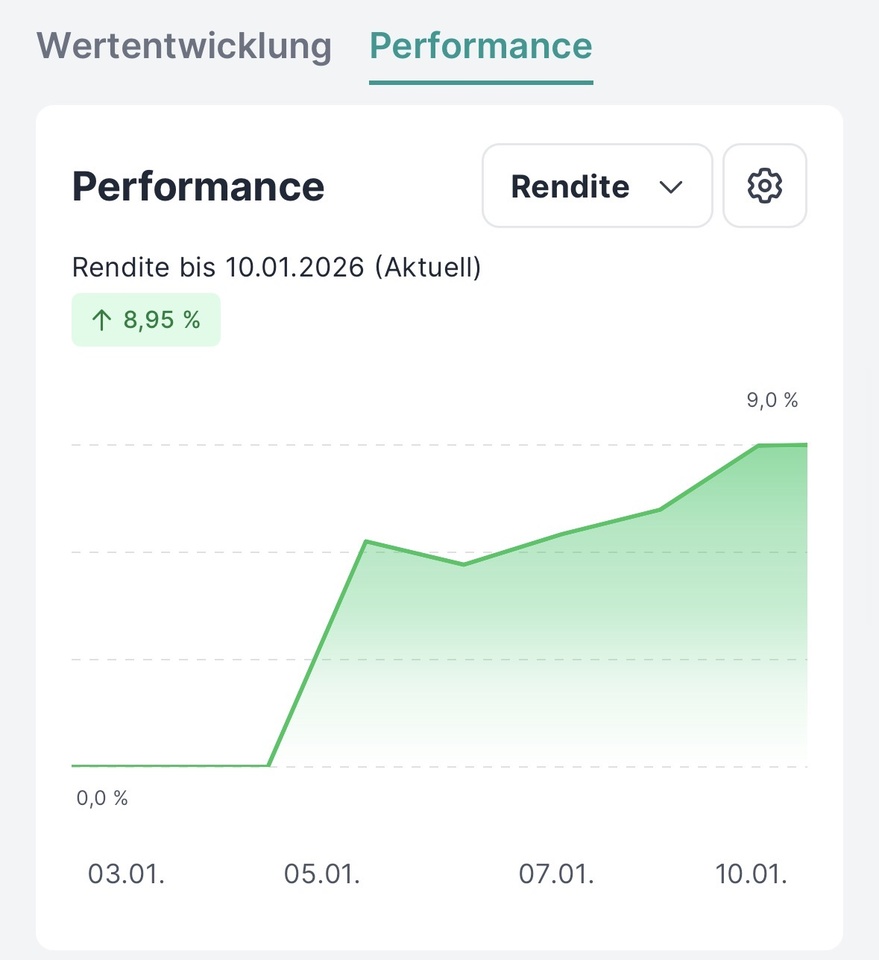
In the last week:
Since last week, the project has achieved +8,95% 📈.
_________________________
The 14-day RSI looks as follows:
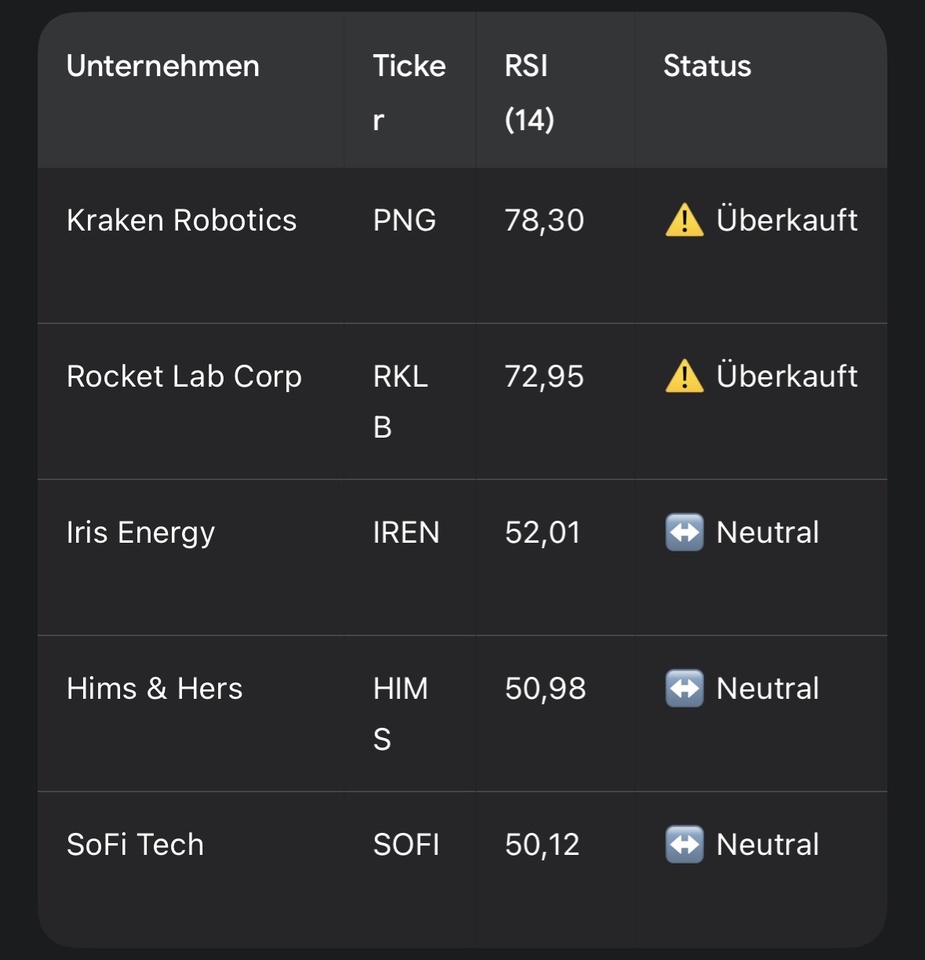
The 14-day RSI is a momentum oscillator that evaluates the ratio of upward to downward movements over two trading weeks. Values above 70 signal an overbought market situation (potential overheating), while values below 30 indicate an oversold state and a possible countermovement. It therefore serves as an indicator for the relative strength of a trend and for identifying potential technical turning points.
_________________________
Below is the trend of the last ten days:
$RKLB (+2,74%)
$PNG (+6,09%)
$SOFI (-2,89%)
$IREN (+7,75%)
$HIMS (+1,54%)