3D·

Trading | Help wanted for trading leveraged ETFs

Hi folks,


I have been dealing with the topic of 2x index ETFs for a long time. $CL2 (-2,07%) and quickly realized that due to path dependency and volatility decay this product is rather not for buy and hold.


Now with the release of the 2x MSCI World from Amundi $LVWC (-1,47%) my interest came back and I would like to make short to medium-term swing trades with the 2x S&P500 $DBPG (-2,32%) with the 2x S&P500.


My trading idea is as follows:

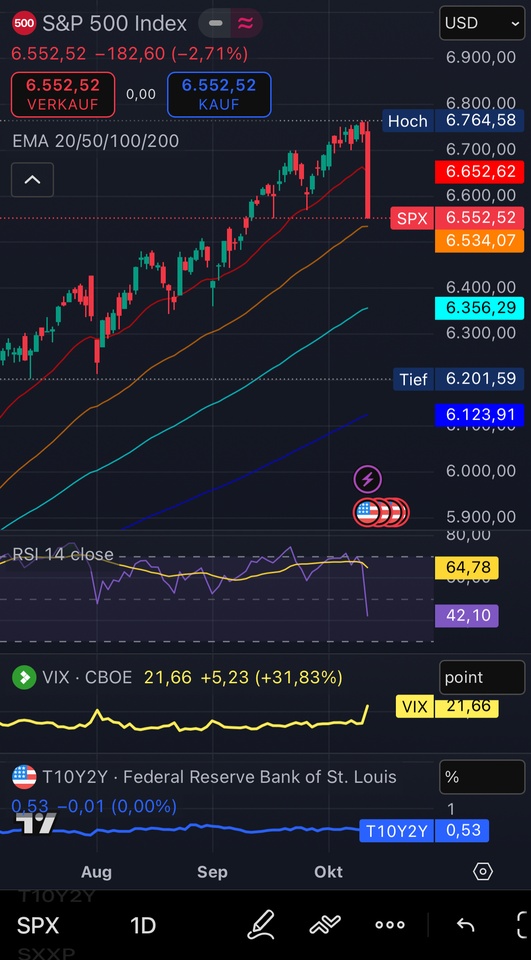
If the market corrects dynamically, similar to Friday due to the information Donald Trump shared via TRUTH SOCIAL, then provided the macro environment and the uptrend (price is above 200 EMA) are still in tact and the 20 EMA line is crossed I would like to set my entry at the 50 EMA line.


Conditions for entry based on the following indicators on a daily basis:

  • VIX <25
  • US government bond yield curve 10Y2Y >0
  • RSI <70

and

  • 20 EMA crossed, but price is above the 200 EMA


Conditions for exit based on the following indicators:

  • VIX >25
  • US government bond yield curve 10Y2Y <0
  • RSI >70

or

  • Stop loss triggered at -5% of the purchase price


I have set up a "macro cockpit" at TradingView (free version) to be able to estimate whether the upward trend is in tact or whether the trend has broken and I should speculate on better entries.


Screenshot of the macro cockpit:

attachment

I would love to hear your opinion on my plan and look forward to your feedback.

Please bear with me, I am a classic buy and hold savings plan investor and have not yet had much to do with chart analysis and the like.


Best regards

1
9 Comentários

imagem de perfil
Just leave it
5
imagem de perfil
Do 2xSPYTIPS as @Epi once presented.
2
imagem de perfil
Take a look at momentum indicators such as SMI or StochRSI. You usually open a position when the price is in a sideways trend or when the MACD shows signs of a trend reversal and both indicators are trending upwards. Regarding the RSI: If it falls below 70 again, you can get out, but it doesn't always fit. Good luck 😉
2
imagem de perfil
@BeachPlease Thanks for the tips, I'll look into it.
These were my first thoughts on my project, thought it would be good to share them with experienced people.
1
imagem de perfil
Have you put your system through a backtest?
imagem de perfil
@Epi I suspect that my "backtest" is giving you a headache 😂

So far I have looked at the chart of the S&P 500 retrospectively in conjunction with the indicators I have chosen to find out whether the continuation of the upward trend coincides with my interpretation of the indicators.

From my point of view, there were correlations and so I thought I'd share my thoughts on the whole endeavor here on qetquin to hear the opinions of people who are much deeper into trading than I am.
1
imagem de perfil
@BruceBullridge Hmm, yes, a backtest involves a little more, especially quantitative comparative values, especially for changed parameters.
Why not get a good AI bot to build you a backtest tool like this? 🤷
1
imagem de perfil
@Epi sounds interesting. Do you have a special one in use or common AIs like ChatGPT, Gemini, etc.?
imagem de perfil
@BruceBullridge Claude is said to be very good. Otherwise Perplexity Pro.

You can also set up a trial account at Portfoliovisualizer.com and test it out a bit.
1
Participar na conversa