

Hello my dears,
this week I have posted two innovations and solutions from L3 $LHX (+2,65%) Harries.
This was immediately followed by a complaint from my friend Mr. Prompt @Raketentoni .
I would sell a story without fundamental key figures 🙈.
But faster than the 🚀 that L3 Harries builds, he analyzed it down to the smallest detail.
And now buckle up, the SURPRISE was that I was finally able to satisfy Mr. Prompt for the first time in a long time.
Of course, I didn't want to withhold Mr. Prompt's analysis from you.
As always, his analysis is followed by my company presentation.
In a nutshell:
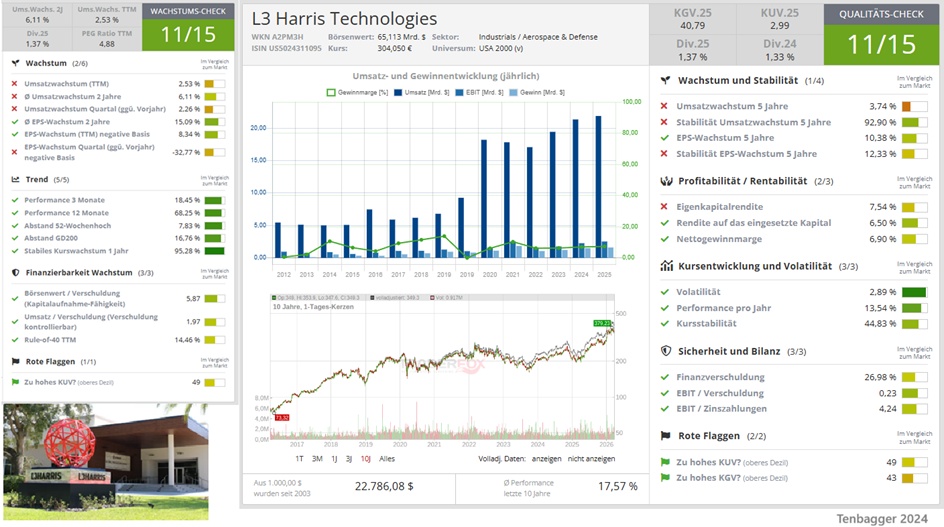
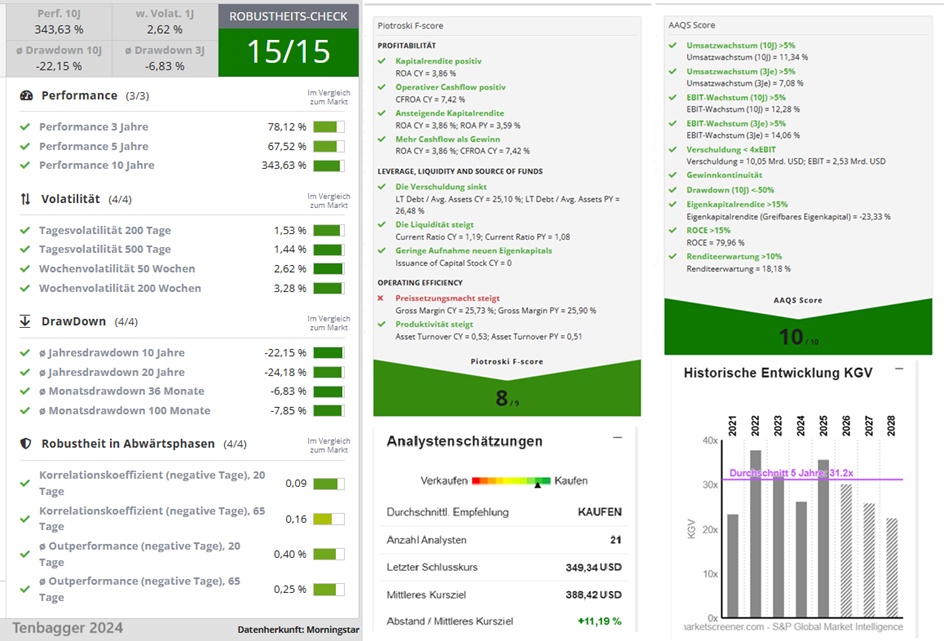
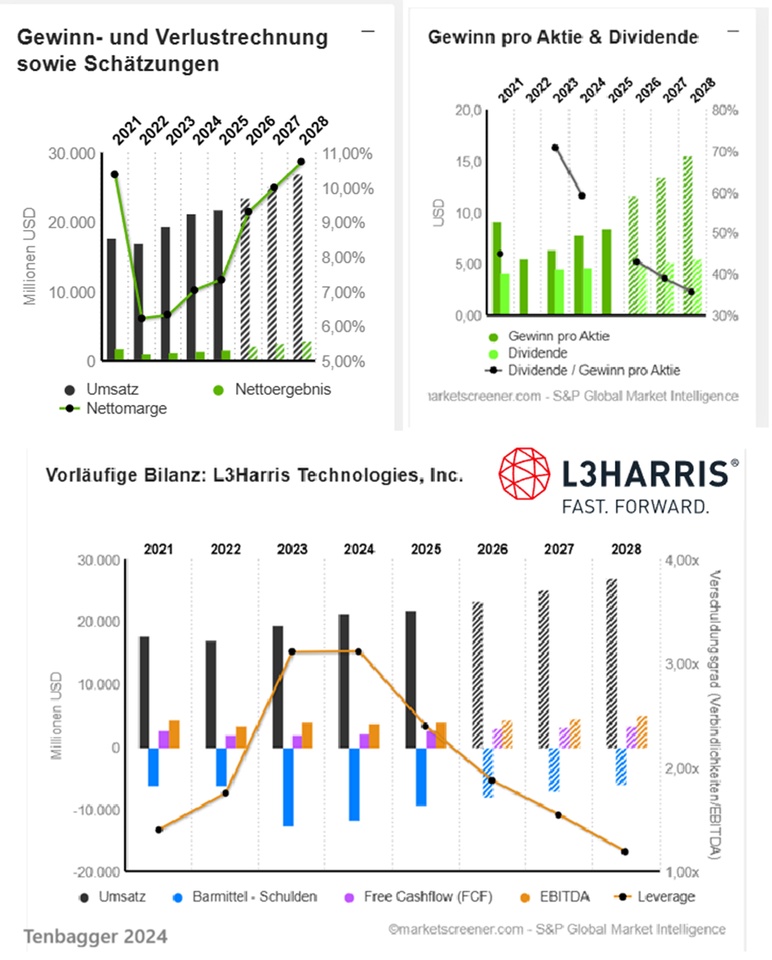
- What impresses me about L3 Harries is the consistency and uniformity with which sales and profits are increased. And keeping margins constant.
⬇️ ANALYSIS MR. PROMPT
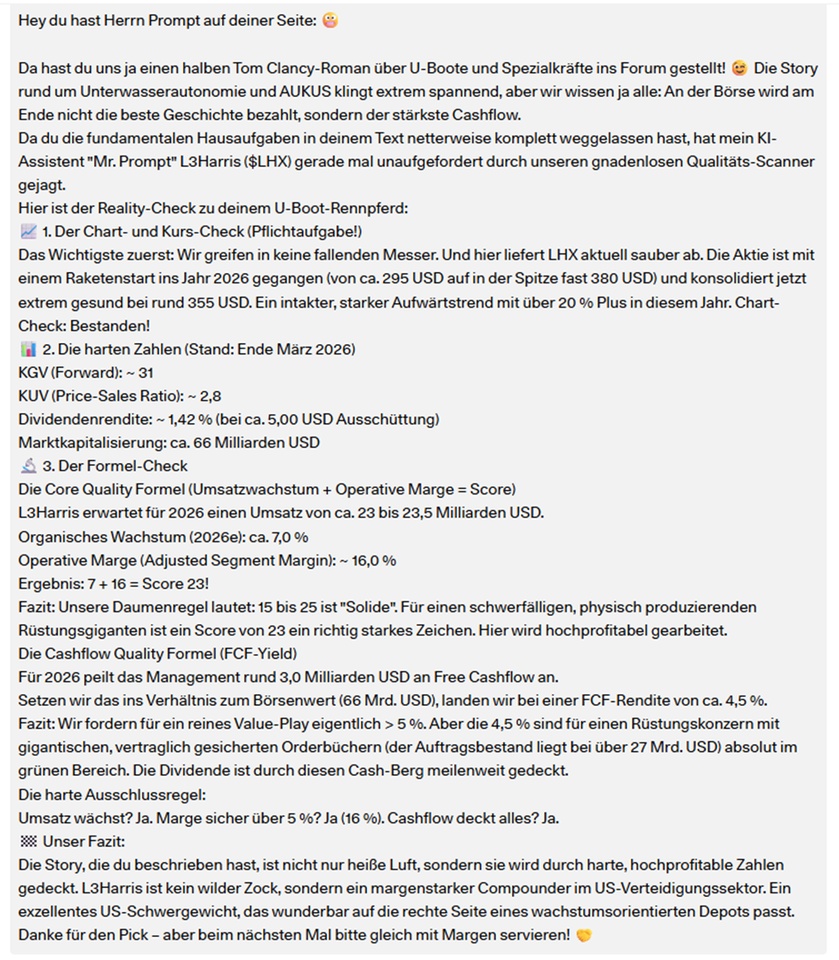
Hey, you've got Mr. Prompt on your side:
You've put half a Tom Clancy novel about submarines and special forces on the forum! The story
and AUKUS sounds extremely exciting, but we all know that on the stock market, it's not the best story that pays off in the end.
not the best story, but the strongest cash flow.
Since you have kindly left out the fundamental homework in your text, my AI assistant
assistant "Mr. Prompt" L3Harris ($LHX) has just run you through our merciless quality scanner without being asked.
without being asked.
Here's the reality check on your submarine racehorse:
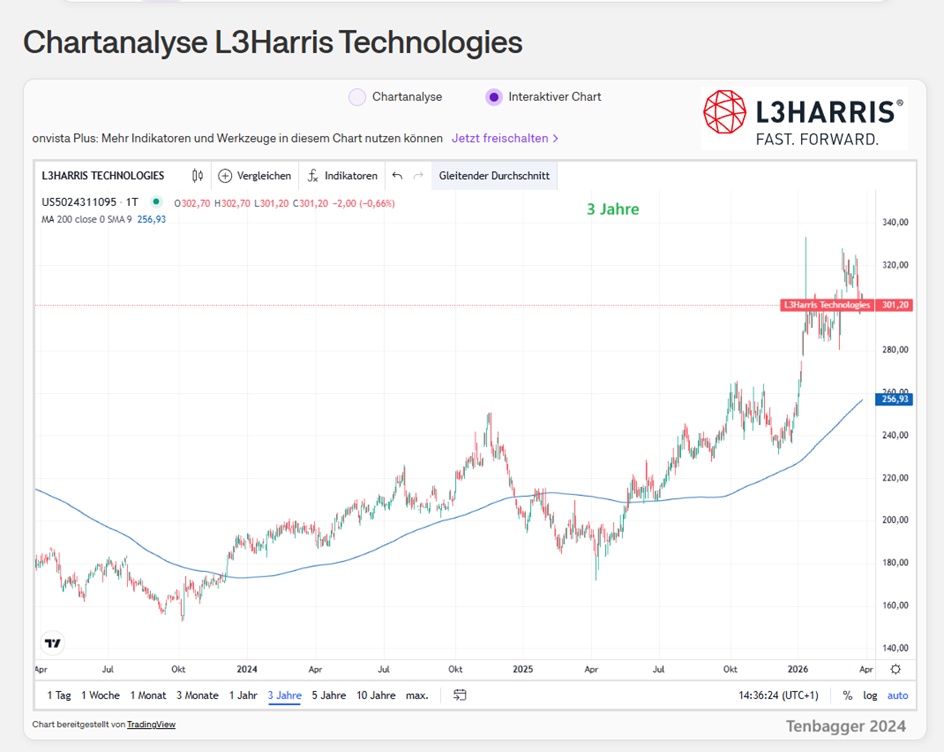
1. the chart and price check (mandatory task!)
The most important thing first: we don't go into falling knives. And here LHX is currently delivering cleanly. The share is off to a
rocket into 2026 (from around USD 295 to a peak of almost USD 380) and is now consolidating at an extremely healthy
extremely healthy at around USD 355. An intact, strong upward trend with gains of over 20% this year. Chart
Check: Passed!
2. the hard figures (as at the end of March 2026)
P/E ratio (forward): ~ 31
P/E ratio (price-sales ratio): ~ 2.8
Dividend yield: ~ 1.42 % (with approx. USD 5.00 payout)
Market capitalization: approx. USD 66 billion
3. the formula check
The core quality formula (sales growth + operating margin = score)
L3Harris expects sales of approx. USD 23 to 23.5 billion for 2026.
Organic growth (2026e): approx. 7.0%
Operating margin (adjusted segment margin): ~ 16,0 %
Result: 7 + 16 = score 23!
Conclusion: Our rule of thumb is: 15 to 25 is "Solid". For a cumbersome, physically producing
armaments giant, a score of 23 is a really strong sign. The company is highly profitable.
The cash flow quality formula (FCF yield)
Management is targeting around USD 3.0 billion in free cash flow for 2026.
If we put this in relation to the market capitalization (USD 66 billion), we end up with an FCF yield of around 4.5 %.
Conclusion: We actually require > 5 % for a pure value play. But the 4.5 % is too high for a defense company with
gigantic, contractually secured order books (the order backlog is over USD 27 bn) is absolutely in the
green area. The dividend is covered for miles by this mountain of cash.
The hard exclusion rule:
Sales growing? Yes. Margin safely above 5 %? Yes (16 %). Cash flow covers everything? Yes.
Our conclusion:
The story you have described is not just hot air, it is backed up by hard, highly profitable figures
backed up. L3Harris is not a wild gamble, but a high-margin compounder in the US defense sector. An
excellent US heavyweight that fits perfectly on the right-hand side of a growth-oriented portfolio.
Thanks for the pick - but next time please serve it with margins!
MY COMPANY PRESENTATION
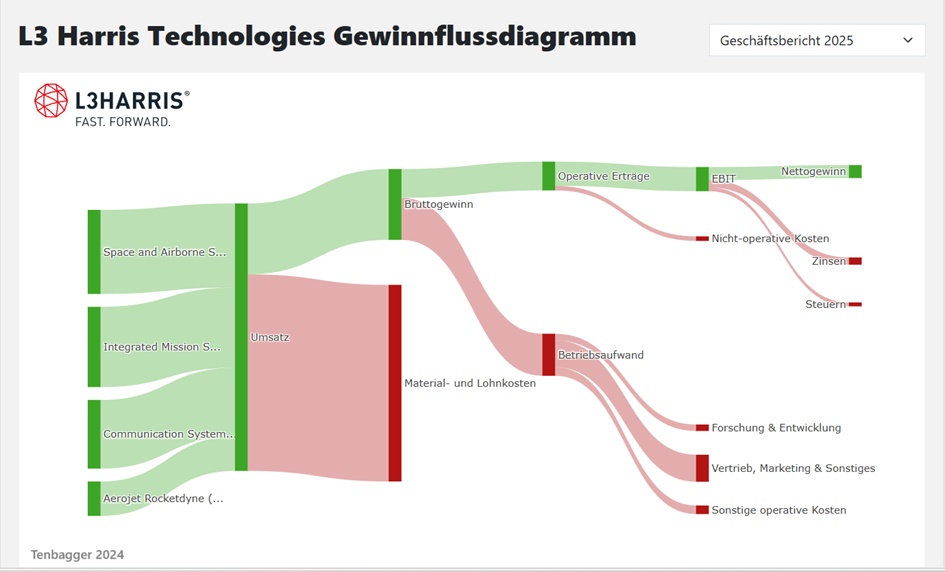
L3Harris Technologies, Inc. specializes in the design, manufacture and marketing of information and communications equipment for the defense, government and commercial markets. Net sales by product family are as follows:
- Integrated Mission Systems (31.4%): Intelligence, surveillance and reconnaissance systems, communication systems, electrical and electronic systems for naval platforms, advanced electro-optical and infrared solutions, etc.;
- Space and aerospace systems (30%): Payload systems, sensors, complete mission solutions, confidential intelligence systems, cyber defense solutions, electronic warfare systems, etc.;
- Communication systems (25.7%): tactical communication systems, broadband communication, integrated visual communication solutions, etc;
- propulsion, power generation and defense systems (12.9%).
Net sales are broken down by revenue source into product sales (70.8%) and services (29.2%).
The United States accounts for 77.2 % of net sales.
Number of employees: 45,000
Domains
Industries
Solutions
- Aircraft mission control and avionics
- Software, cyber and robotics solutions
- Integrated vision solutions
- Weapon systems and components
- Electronic warfare
- Resilient communication and networks
- Space, civil space
- Command and control
- Counter-unmanned systems (C-UxS)
- Missile warning and defense
- Public safety and critical communications
- Space, defense space
- Autonomous systems
- ISR and SIGINT
- Underwater warfare
- Maritime Solutions
L3Harris announces a reorganization of its business units
L3Harris kündigt eine Reorganisation seiner Geschäftsbereiche an | L3Harris® schnell. Vorwärts.
L3Harris sells majority stake in Space Propulsion & Power business to AE Industrial Partners

L3Harris 4Q25 Earnings Presentation
USD in millions
Estimates
Year Sales Change
2024 21.325 9,82 %
2025 21.865 2,53 %
2026 23.427 7,14 %
2027 25.216 7,64 %
2028 27.085 7,41 %
Year EBIT Change
2024 3.292 14,54 %
2025 3.451 4,83 %
2026 3.765 9,1 %
2027 4.070 8,09 %
2028 4.376 7,52 %
Year Net result Change
2024 1.502 22,41 %
2025 1.606 6,92 %
2026 2.175 35,4 %
2027 2.523 16,04 %
2028 2.904 15,1 %
Year Net debt CAPEX
2024 11.621 407
2025 9.374 424
2026 7.982 601,5
2027 7.071 1.045
2028 6.005 1.214
Year Free cash flow Change
2024 2.152 7,12 %
2025 2.736 27,14 %
2026 3.002 9,72 %
2027 3.166 5,48 %
2028 3.406 7,58 %
Year EBIT margin ROE
2024 15,44 % 13,01 %
2025 15,78 % 8,19 %
2026 16,07 % 10,88 %
2027 16,14 % 11,98 %
2028 16,16 % 13,05 %
Year Earnings per share Change
2024 7,87 22,2 %
2025 8,53 8,39 %
2026 11,58 35,75 %
2027 13,51 16,63 %
2028 15,54 15,1 %
Year Dividend p share Yield
2026 4,997 1,43 %
2027 5,257 1,5 %
2028 5,545 1,59 %
Year FCF Yield
2024 4,22 %
2025 4,12 %
2026 4,1 %
2027 4,38 %
2028 4,78 %
Year P/E ratio PEG
2024 26.3x 2.02x 1.2x
2025 35.7x 2.92x 4.26x
2026 30.2x 3.13x 0.8x
2027 25.9x 3.04x 1.6x
2028 22.5x 2.87x 1.5x
Market value 65,248
Number of shares (in thousands) 186,776
Date of publication 29.01.2026
@Get_Rich_or_Die_Tryin
@Klein-Anleger
@schlimmschlimm
@Multibagger
@Dividendenopi and many more


