2D·

3xGTAA - The big backtest (part 2)

Hello dear 3XGTAA fans,


EDIT: there are still a few misconceptions in the model, if they are clarified I will delete the amount and repost it corrected.


now that you have seen in my first part(https://getqu.in/fPyOV5/) how I synthesized the assets, today it's about the backtest of the strategy itself.


3xGTAA


As the 3xGTAA has changed several times over time, here is a short and clear summary of the strategy:


The assets of 3xGTAA

  • 3x Nasdaq 100
  • 1x Bitcoin (BTC) (as of 2018)
  • 3x Gold
  • 1x money market
  • 7x USD / EUR
  • 7x EUR / USD
  • 2x oil
  • 5x US Treasuries (TLT)
  • 3x Euro Stoxx 50
  • Money market


Rules of 3xGTAA

On the first trading day of the month, take all assets that are above the 150SMA.

Sort them according to the 1+3+6+9 month momentum in descending order.

Select the top 3 assets and hold them each with 1/3 of the capital, special rule if no 3 assets are above the 150SMA money market is bought.

The marginal assumptions of the backtest

My aim for this backtest was to replicate the strategy as realistically as possible. This means that I tried to take into account all costs and fees that would be incurred in a real trade.

These include:

  • Spread, I have set this at 0.2% per trade.
  • Ongoing costs of the wikifolio (0.95% p.a.)
  • The Highwater Mark fee of the Wikifolio (5% of the profit), unfortunately this is calculated on a USD basis and not in euros, which can lead to small inaccuracies - but all in all these should be negligible.
  • At the end of the term, I tax the profits of the wikifolio at a flat rate of 26.375% (capital gains tax + solidarity surcharge), but I always give you the result before taxes.


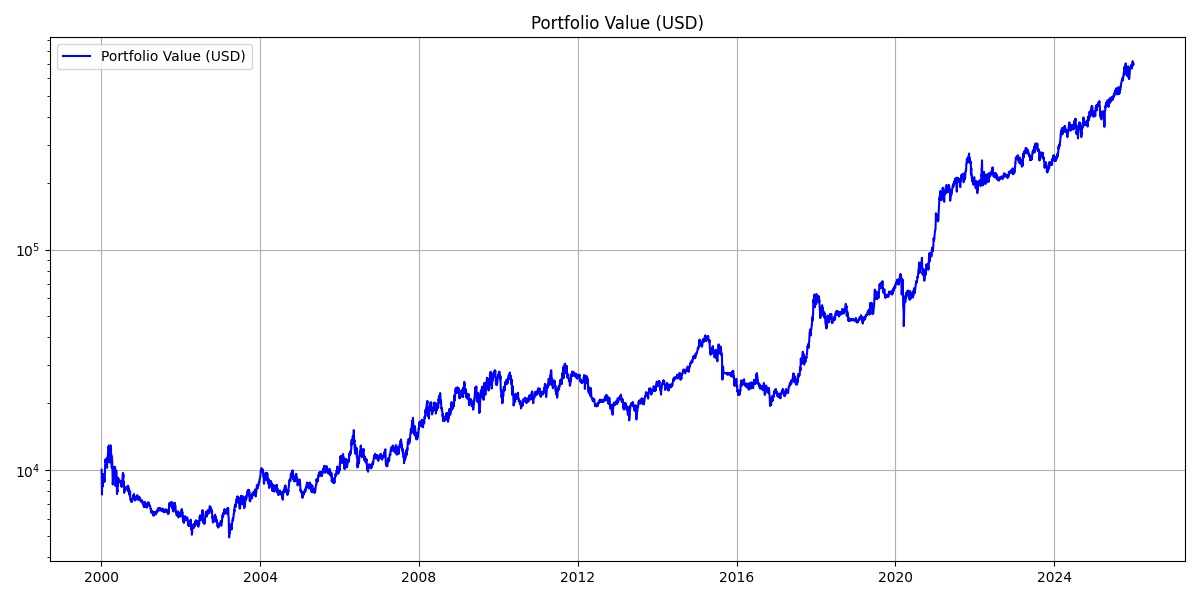
Key performance figures (2000 - 2025)

  • Gross CAGR (USD): 17,07%
  • Net CAGR (USD): 12,57%
  • Gross CAGR (EUR): 16,39%
  • Net CAGR (EUR): 12,06%
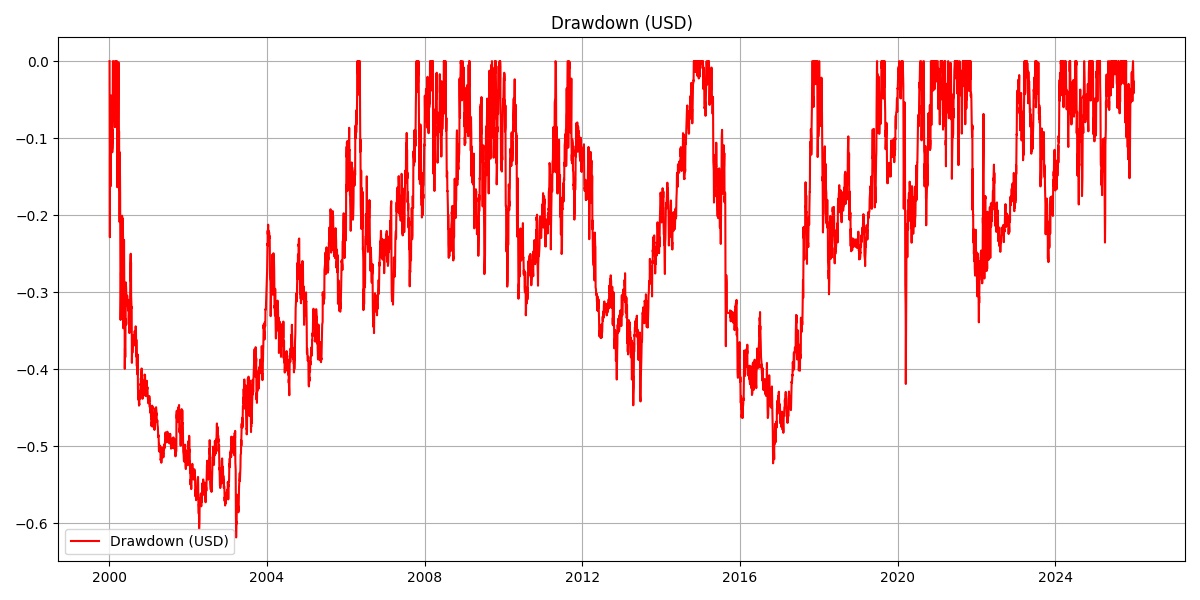
  • Max. Drawdown (USD): -70,45%
  • Max. Drawdown (EUR): -69,69%


Getquin does not support Markdown so you will have to live with the screenshot.

attachment
attachment
attachment


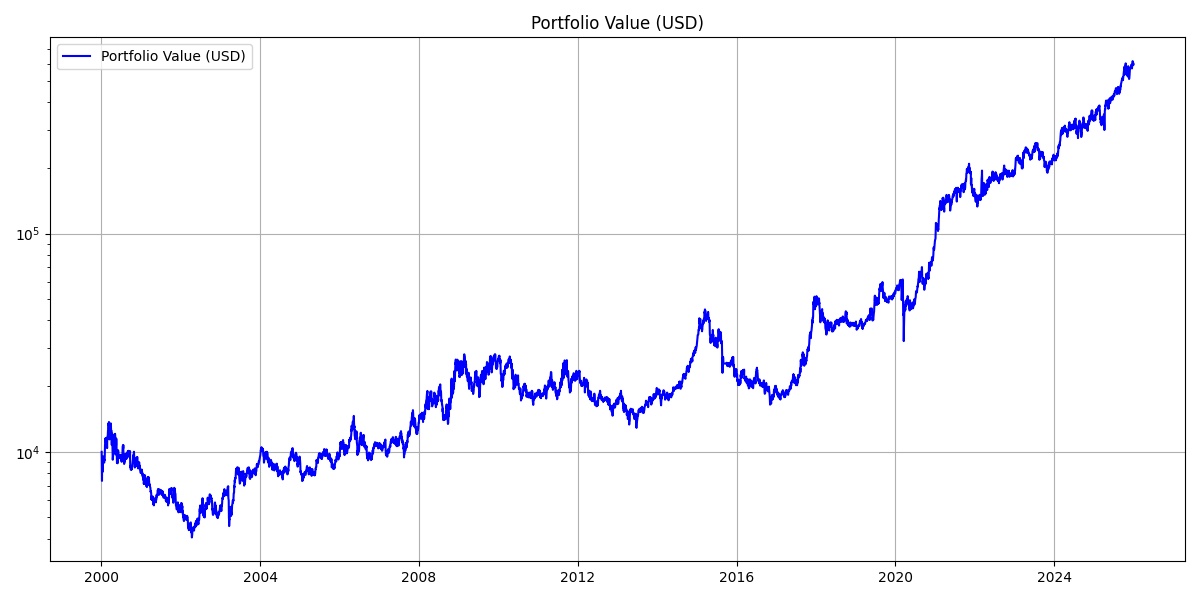
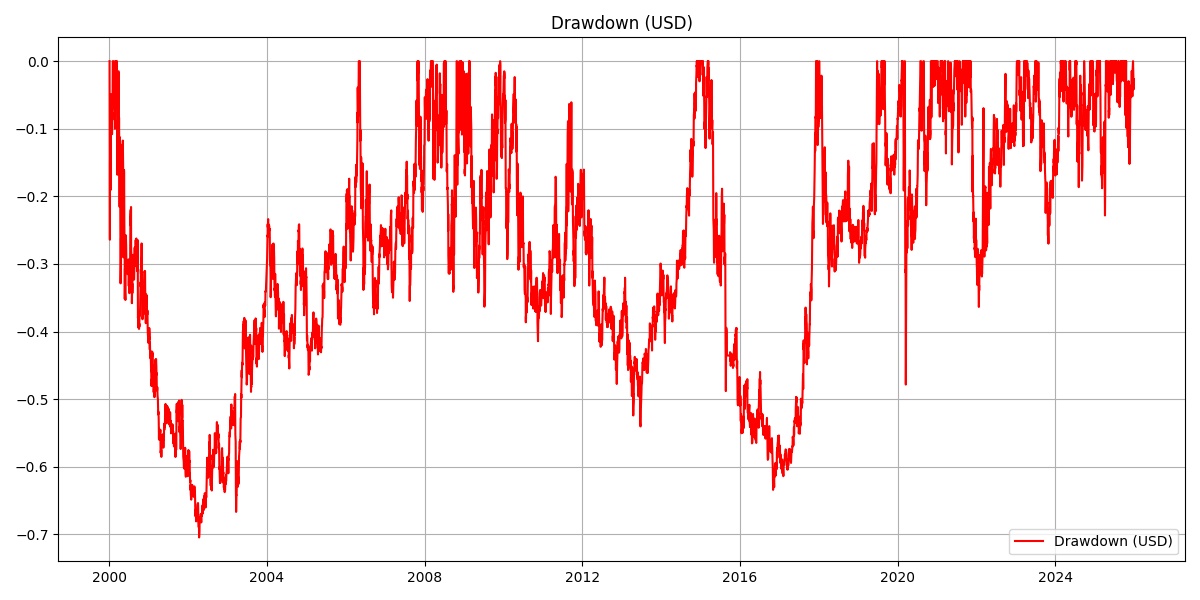
These results are completely acceptable in terms of return, but the drawdown is clearly too high.

In addition, this occurs during the dotcom crash - the 3xGTAA is actually an anti-cyclical strategy and should not actually fall so sharply in such phases.

The problem here is that we can only rebalance at the beginning of the month and therefore cannot react to the crash dynamics. I don't yet know whether there is a solution to this, but I would like to go into this in more detail in a later article.
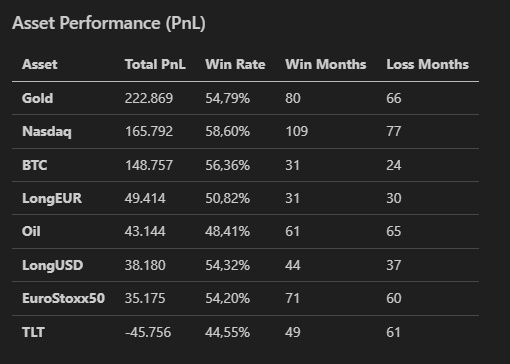
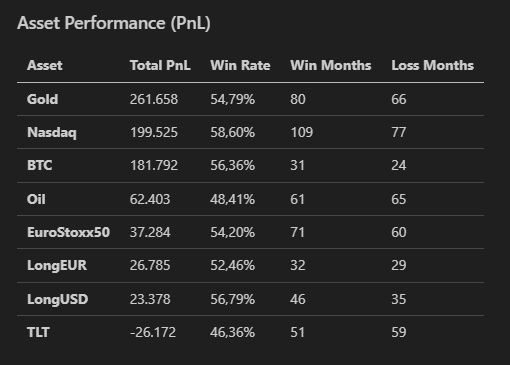

The culprits

As you can clearly see in the PnL table, TLTs are the main problem child. The high leverage leads to massive drawdowns in volatile market phases, which are not sufficiently compensated for by the return. In general, leverage above a factor of 3 is the devil's play for me and should only be used with extreme caution.


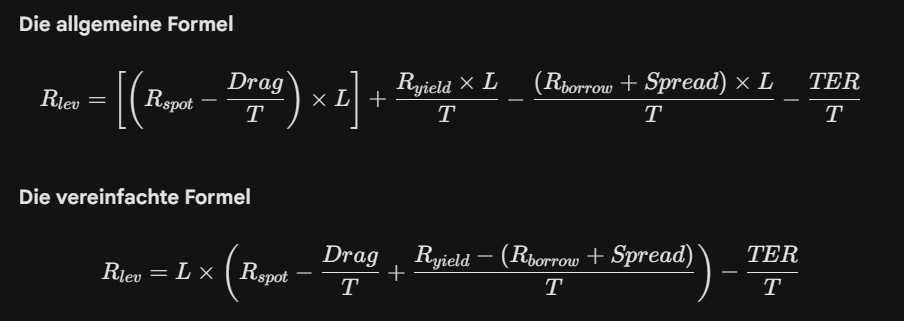
3-factor leverage construction

To build a stable 3x leverage from existing certificates (e.g. a 5x or 7x long), you use cash or the unleveraged underlying (1x) for "dilution".

The formula is: Target leverage (3x) = Leverage_A * (1 - p) + Leverage_B * p


From 5x to 3x (with 1x): 3 = 5 * (1 - 0.5) + 1 * 0.5 -> 50% 5x certificate + 50% 1x certificate.


Thanks to the monthly rebalancing in the Wikifolio, the effect of path dependency is kept within limits, even if the construction does not mathematically deliver exactly 3x every day.


3xGTAA better stay 3xGTAA


For the sake of completeness, here are the assets again:

  • 3x Nasdaq 100
  • 1x Bitcoin (BTC) (as of 2018)
  • 3x Gold
  • 1x money market
  • 3x USD / EUR
  • 3x EUR / USD
  • 2x oil
  • 3x US Treasuries (TLT)
  • 3x Euro Stoxx 50


Here are the results of the optimized 3xGTAA:

Key performance indicators (2000 - 2025)

  • Gross CAGR (USD): 17,75%
  • Net CAGR (USD): 13,07%
  • Gross CAGR (EUR): 17,06%
  • Net CAGR (EUR): 12,56%
  • Max. Drawdown (USD): -61,85%
  • Max. Drawdown (EUR): -65,31%


attachment
attachment
attachment


As you can see, a 3xGTAA which does not go beyond leverage 3 beats the current 3xGTAA in MaxDD as well as CAGR and is therefore better in both of our target dimensions.


Conclusion and outlook

The 3xGTAA has a higher drawdown than expected, but this can be remedied by adjusting the leverage of the 5x and 7x assets to 3x.


There are many other things to consider, for example the performance of the strategy is significantly worse if the sigans are not evaluated on the 1st trading day of the month but on the Xth trading day of the month.

You can see exactly what the problem looks like in the next part of this series - I don't know if there is a solution yet, but I will find out.


I also need to take a critical look at how the 3xGTAA assets are selected, especially with regard to overfitting and survivorship bias.


As you can see, there is still a lot to do!

previw image
66
46 Comentários

imagem de perfil
I couldn't cope with these brackets and letters at school😂😎 I'm very good at mental arithmetic and anything with numbers. But I'm disastrous at math. That's why I live with the higher drawdown with my high leverage. But thanks for the great insights into general strategy.
12
imagem de perfil
Thanks for the backtest.
There are a few questions about this, of which @randomdude has already asked the most important ones, but the tendency to leave the leverage at <=3 does seem relevant. I will consider this again. So far, these assets have not played a role in the real portfolio.

The addition of BTC seems to be decisive for the model performance. It's just difficult to backtest until 2000.

Otherwise, the model has no silver and TLT has already been identified as a problem child because the 5xTLT also leverages the USD 5x, which is usually stronger than TLT. At the moment there is no hedged product on the market. As things stand, the unhedged TLT is likely to remain unhedged.

What does the backtest look like with these two modifications?
4
imagem de perfil
@Epi Silver is not included in the tests, it just slipped into the description - silver is also missing in the PnL table.
2
imagem de perfil
@Epi But I still have a question about BTC: Why can it be considered an asset from 2018? Why was it already clear that it could serve as an asset in its own right? I would not tend to extrapolate the returns from 2018 to 2021 into the future. I think 2021 is a better year BTC was then approved as a future ETF in the US and the first ETN/ETPs on Bitcoin were listed in Europe - but I'm not deeply involved in the topic and I'd be interested to know how you justify this.
1
imagem de perfil
@Jesko I decided to start in 2018 because BTC had ended its absurd performance by then and was relatively easy for the masses to invest in from then on. In addition, 2018 was not a good year for BTC, so there are fewer positive distortions here. You have to start somewhere. Later would have shortened the backtest series too much.
2
imagem de perfil
@Epi I am still a bit reluctant to accept BTC from 2018 ~1000% from 2018 to peak is a bit too optimistic for me.
1
imagem de perfil
@Jesko Hmm, BTC was at 20k at the beginning of 2018, now at 70k. The performance isn't that overwhelming either.
1
imagem de perfil
@Epi $BTC At the end of January 2018, it stood at around €8,000, with a peak of well over €9,000, which I would say is quite overwhelming.
imagem de perfil
@Jesko Why are you calculating with February 1, 2018? Why not January 1?
imagem de perfil
@Epi I have it in the model from 1.1.2018 but I don't have it to hand right now.
1
I find your backtest analyses super exciting, thanks for the effort
3
imagem de perfil
Super! Four questions/suggestions:
(a) Have you made sure that only assets with positive 1/3/6/9-month momenta are held and money market ETFs only if the return is positive (otherwise cash)?
b) Have you calculated the momenta with euro exchange rates to determine the euro yield?
c) What happens if you leave out silver? Did it ever play a role before 2025?
d) What is the CAGR in the period before Bitcoin and with?
2
imagem de perfil
@randomdude

a) No, I'll add that now - thanks for the tip
b)No, the entire backtest is calculated in USD and then the portfolio is converted into EURO
c) I only accidentally used the Fasche Readme in the description, the backtest is without silver.
d) They will come later, I have just posted figures here that already include an experimental change to the strategy.
1
imagem de perfil
@randomdude Does each of the 1,3,6 and 9 month momentums have to be positive or just the sum of the whole?
1
imagem de perfil
@Jesko Only the sum.
And to b: The result will probably not differ significantly, but for euro returns I would also work with euro momenta.
imagem de perfil
@randomdude I don't think it will change that either, I always calculate the momentum in the base currency of the asset - so always USD except for the EuroStoxx50. However, I am now calculating the performance since 2000 to 2018 and 2018 to 2025.
1
imagem de perfil
@randomdude Assets: ['Nasdaq', 'Gold', 'EuroStoxx50', 'TLT', 'Oil', 'LongEUR', 'LongUSD', 'BTC']
SMA: 150
Top N: 3
TER: 0.95%
Perf Fee: 5.0%
Spread: 0.2% per trade
Rebalance Days: [1]
Loading data...
Loaded EUR/USD
Loaded Nasdaq
Loaded Gold
Loaded EuroStoxx50
Loaded TLT
Loaded Oil
Loaded LongEUR
Loaded LongUSD
Loaded BTC
Calculating indicators...

Valid Signal Start Dates (SMA + Momentum ready):
Nasdaq: 1999-12-07
Gold: 1968-12-30
EuroStoxx50: 1999-09-29
TLT: 1999-10-04
Oil: 2001-05-25
LongEUR: 1999-09-24
LongUSD: 1999-09-24
BTC: 2017-07-09
Running backtest...
Backtest finished.

Strategy Results (2000-01-01 - 2017-12-31):
CAGR (USD): 10.10%
CAGR (USD, After Tax): 7.44%
CAGR (EUR): 9.05%
CAGR (EUR, After Tax): 6.66%
Max Drawdown (USD): -61.85%
Max Drawdown (EUR): -65.31%
Final Value (USD): 56471.77
Final Value (EUR): 47087.28

Asset Performance Breakdown:
Total_PnL Total_Profit Total_Loss Months_Held Win_Months Loss_Months Win_Rate
Asset
BTC 26598.932794 22145.973183 -1118.659580 6 5 1 83.333333
Nasdaq 14096.543198 49322.921212 -35660.060242 122 69 53 56.557377
Gold 12442.101963 41018.309831 -28576.207868 96 51 45 53.125000
TLT 10850.771600 33774.315292 -22923.543692 94 47 47 50.000000
LongUSD 2716.454488 18799.323937 -16082.869449 59 32 27 54.237288
EuroStoxx50 2416.697152 28735.447315 -26318.750162 97 54 43 55.670103
LongEUR -4128.461871 4856.956091 -8985.417962 54 27 27 50.000000
Oil -9268.135702 29542.201929 -39627.993031 93 40 53 43.010753
1
imagem de perfil
@randomdude Assets: ['Nasdaq', 'Gold', 'EuroStoxx50', 'TLT', 'Oil', 'LongEUR', 'LongUSD', 'BTC']
SMA: 150
Top N: 3
TER: 0.95%
Perf Fee: 5.0%
Spread: 0.2% per trade
Rebalance Days: [1]
Loading data...
Loaded EUR/USD
Loaded Nasdaq
Loaded Gold
Loaded EuroStoxx50
Loaded TLT
Loaded Oil
Loaded LongEUR
Loaded LongUSD
Loaded BTC
Calculating indicators...

Valid Signal Start Dates (SMA + Momentum ready):
Nasdaq: 1999-12-07
Gold: 1968-12-30
EuroStoxx50: 1999-09-29
TLT: 1999-10-04
Oil: 2001-05-25
LongEUR: 1999-09-24
LongUSD: 1999-09-24
BTC: 2017-07-09
Running backtest...
Backtest finished.

Strategy Results (2018-01-01 - 2025-12-31):
CAGR (USD): 36.49%
CAGR (USD, After Tax): 26.87%
CAGR (EUR): 36.93%
CAGR (EUR, After Tax): 27.19%
Max Drawdown (USD): -41.92%
Max Drawdown (EUR): -42.54%
Final Value (USD): 120136.14
Final Value (EUR): 102182.65

Asset Performance Breakdown:
Total_PnL Total_Profit Total_Loss Months_Held Win_Months Loss_Months Win_Rate
Asset
Gold 42844.028863 56123.841960 -16094.768109 50 29 21 58.000000
Nasdaq 31727.848087 58767.270174 -27169.298326 63 39 24 61.904762
BTC 26587.883044 54945.172093 -28357.289049 48 25 23 52.083333
Oil 12329.295476 32496.723447 -20167.427971 32 20 12 62.500000
EuroStoxx50 5994.241179 20890.686721 -17913.194588 34 17 17 50.000000
LongEUR 5314.599331 5765.270870 -450.671540 7 5 2 71.428571
LongUSD 3552.016298 6637.540074 -3085.523776 22 14 8 63.636364
TLT -6364.920977 2462.114301 -8827.035279 16 4 12 25.000000
1
imagem de perfil
As of 2018, it fits in well with my results.
2
imagem de perfil
@randomdude The backtests also fit well with the course of the wikifolio, there are a few months where the assets differ on the whole, but the CAGR is 55% until the end of last year and a max DD. of slightly less than 30%.

So all in all the backtest seems to be working or do you have any ideas what is not working just before 2018?
2
imagem de perfil
@Jesko It's no secret that 3xGTAA is optimized for today's conditions. And that was precisely one of the ideas: Finding a strategy that suits BTC. It may not perform as well in 5 or 10 years and you will have to make adjustments. But it has been proven that the basic principle of GTAA works, can be successfully implemented and can be varied.
2
imagem de perfil
@Jesko And: It's good that you've also noticed that the model has a certain robustness. For example, it won't blow up in your face if you can't trade exactly at the turn of the month.
2
Ver todas as 3 restantes respostas
imagem de perfil
Really good analysis
1
imagem de perfil
Have you considered that you would only go into the money market if interest rates were >0? There was a negative interest rate phase for a long time, so nobody would have invested in the product. I simply capped the ECB key interest rates at 0 and then synthesized the index.
1
imagem de perfil
@SemiGrowth No, I have not modeled that. But it will probably make a difference if you buy 3xGTAA, which almost never uses cash, so -0.5% on an asset that is almost never held makes almost no difference.
imagem de perfil
@Jesko That's probably true
imagem de perfil
Can you also show us the returns for the individual years from 2000 onwards?
imagem de perfil
@Krush82 Yes, I'll generate it for you. Would you like to limit everything to 3x or 5xTLT and 7xcurrencies?
imagem de perfil
@Jesko believe that TLT and currencies don't have the mega impact anyway so for the sake of simplicity everything can be at 3x
1
imagem de perfil
@Krush82 Well then, here is the answer. Unfortunately, I can't upload it as an image. So that the format is halfway right, I'll do it in an extra comment.
imagem de perfil
@Krush82 Year Return (USD) Return (EUR)
2000 -27.98% -21.90%
2001 -14.82% -10.07%
2002 -6.89% -21.75%
2003 +62.45% +34.89%
2004 -4.32% -11.28%
2005 +11.50% +28.74%
2006 +15.21% +3.20%
2007 +34.37% +20.22%
2008 +53.36% +60.14%
2009 +13.18% +11.28%
2010 -14.82% -8.03%
2011 +16.99% +20.07%
2012 -25.00% -26.39%
2013 +25.43% +19.97%
2014 +35.74% +53.86%
2015 -24.68% -16.17%
2016 -11.87% -8.65%
2017 +151.35% +120.92%
2018 -15.68% -11.71%
2019 +41.00% +44.34%
2020 +80.70% +64.64%
2021 +69.57% +83.74%
2022 +8.93% +15.75%
2023 +16.87% +12.81%
2024 +53.21% +62.10%
2025 +74.16% +54.71%
3
imagem de perfil
@Jesko you have forgotten the years 2026-2031...
2
imagem de perfil
@Jesko Could you also indicate the assets to hold for the loss years?
imagem de perfil
@Krush82 So the complete list of when which assets are held?

Unfortunately, I don't understand exactly what you mean.
imagem de perfil
@Jesko I would like to see which assets were in the respective years from 2000 - 2002. So only the trades
imagem de perfil
Thank you for your work. I also backtested this two weeks ago - not as detailed as you, but the drawdowns and volatility are clearly too high for me.
I then did a test with ChatGPT to see how long it would take to outperform the system with a different set of products if you weren't actively trading both.
imagem de perfil
@Koenigmidas can you tell us what the results of the test were?
1
imagem de perfil
@Krush82 I deliberately left out Bitcoin in the model portfolio I set up and instead weighted US equities more heavily (MSCI World, Euro Stoxx 50, Nasdaq 100). I supplemented the portfolio with a slight leverage element (10% Nasdaq 2×), gold as a hedge and short-term bonds as a buffer.
My backtest, similar to the one above, aimed to keep drawdowns and volatility as low as possible. I therefore shifted the focus from the past to the future. Regardless of the expected return, I wanted to know how long it would take for a non-active management to beat its index, with the same denominator applying within ten years. The result: this would already be the case between the first and second year.
For a reality check, I started a sample portfolio on the 28th. In principle, his certificate was outperformed after just one day: he was at -2.28 %, mine at -1.5 %. As of yesterday: his product -20.15 %, mine -4.92 %.
If his products go up, he beats me by a factor of three, as the name suggests. But if it goes down, he makes more than four times the losses. That's the theory. For me personally, however, backtests are too much like reading coffee grounds. At the same time, I started two model portfolios with fantasy stocks - one was an Italian index that has been in the black since the 28th and the other was based on the stock market magic formula and has a loss of only 2.3%. Of course, everyone picks the best stock.
imagem de perfil
@Koenigmidas the "not actively" trading means that you are simply buy & hold or how should I imagine that exactly. So holding all the assets you mentioned at the same time? A comparison over such a short period of time is no more meaningful than a backtest. Or do you just want to check how high the max DD should be for you?
imagem de perfil
@Krush82 By "not actively trading" I mean that neither of us had changed anything as of January 28.
His three trades from February 2 are not included in my calculation. And therefore refers to the old values. Of course, you could test all products and the trade dates again in more detail since 2024
Moreover, a direct comparison is only meaningful for me in the long term over a period of 3 to 5 years.
imagem de perfil
@Krush82 another question do you want to make your certificate non-investable?
imagem de perfil
@Koenigmidas is doh already introduced, would you like to test it too?
imagem de perfil
@Krush82 no 😅 it's hard to believe, but I also have a private life. And my wife always grumbles when I work so much on Getquin
2
Participar na conversa