
Hardly gives way $HIMS (-0,67%) for $ONDS (-11,34%) the project is doing well again. 📈
Let's take a look at the current status of the project together Tenbagger der Zukunft together:
As a reminder, the project started with around €2,500, which was divided almost equally between the five titles in the portfolio.
$HIMS (-0,67%) was completed with almost exactly 50% loss was sold. For the new value $ONDS (-11,34%) was topped up again to €500 - in the end, 64 shares ended up in the Tenbagger portfolio.
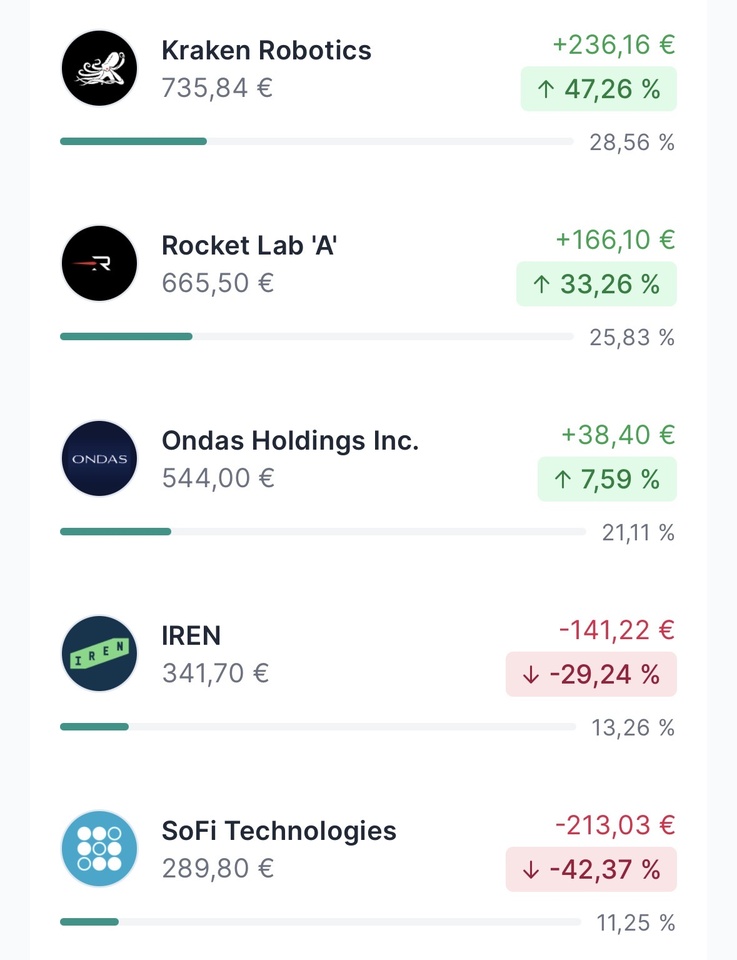
Below are the five values of the project selected by you and their development to date since 12.11.2025:
- Kraken Robotics +47% 📈
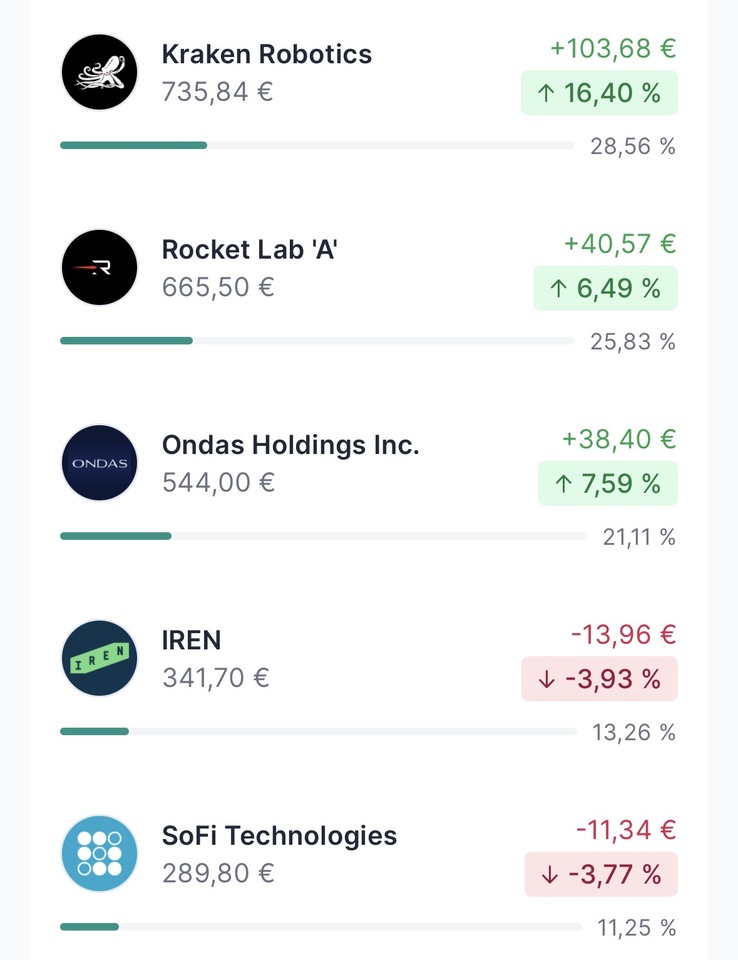
- Since last week: +16% 📈
- Rocket Lab +33% 📈
- Since last week: +6% 📈
- Ondas Holdings +8% 📈
- In the portfolio since Tuesday
- Iris Energy -29% 📉
- Since last week: -4% 📉
- SoFi Technologies -42% 📉
- Since last week: -4% 📉
Since start:
Last 7 days:
This week was able to $PNG (+1,38%) catch up well and $RKLB (-6,56%) from the throne.
Bringing up the rear, as so often $IREN (-6,41%) and $SOFI (-1,41%) which are among the most volatile stocks in the project.
_________________________
The beta value is: 2,08
The beta value (β) of a share measures its performance
Marktvolatilität compared to the overall market: a beta of 1 means the share moves in sync with the market; a beta > 1 means it fluctuates more (e.g. at 1.5 it rises or falls by 1.5 % if the market rises/falls by 1 %); a beta < 1 shows less fluctuation, while a beta < 0 indicates an opposite movement to the market. It helps investors to assess the systematic risk (market risk) of a share.
_________________________
Due to the sometimes high volatility, the stocks are represented as follows
Rocket Lab: 26%
Kraken Robotics: 29%
Ondas Holdings: 21%
Iris Energy: 13%
SoFi Technologies: 11%
_________________________
Return without taking into account the loss of $HIMS (-0,67%):
The return with consideration of the loss of $HIMS (-0,67%) is -6.5% 📉
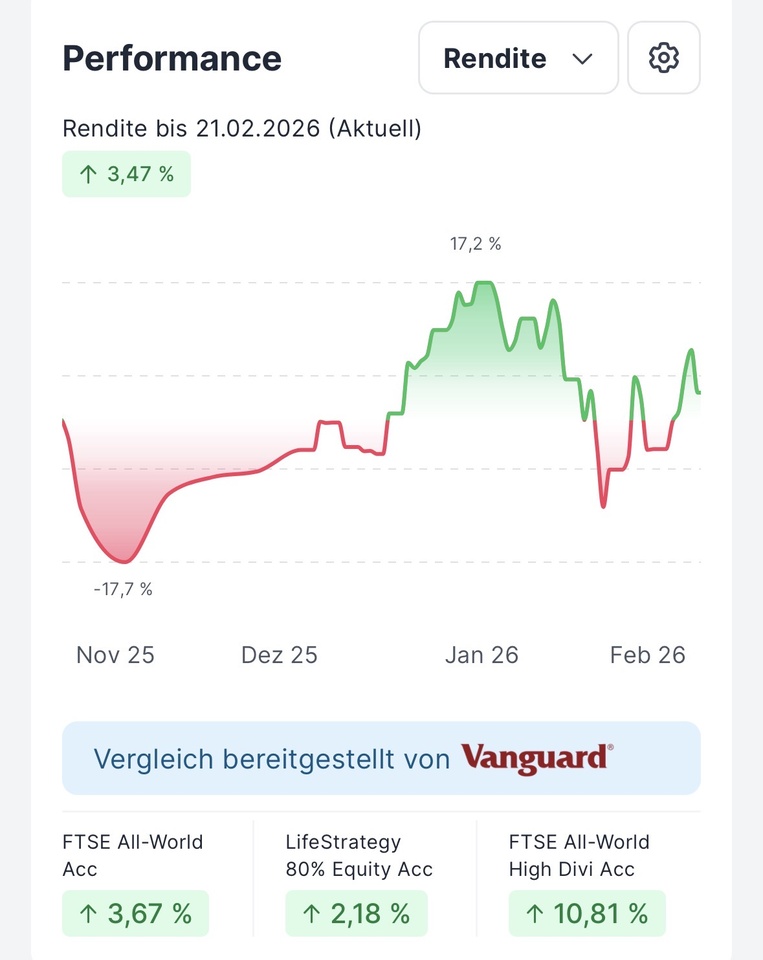
Since the start of the project:
The return on the portfolio is (without taking into account the loss of $HIMS (-0,67%) ) is currently positive and stands at +3,5% 📈, at the last update it was still at +4,7%📈.
The return on the portfolio is (with taking into account the loss of $HIMS (-0,67%) ) is currently negative and stands at -6,5% 📉, at the last update it was still at +4,7%📈.
The yield reached its lowest point on 21.11. at -17,7% 📉, the high on 16.01. with +23,7% 📈.
Since the beginning of the year (without taking into account the loss of $HIMS (-0,67%) ):
+4,9% 📈
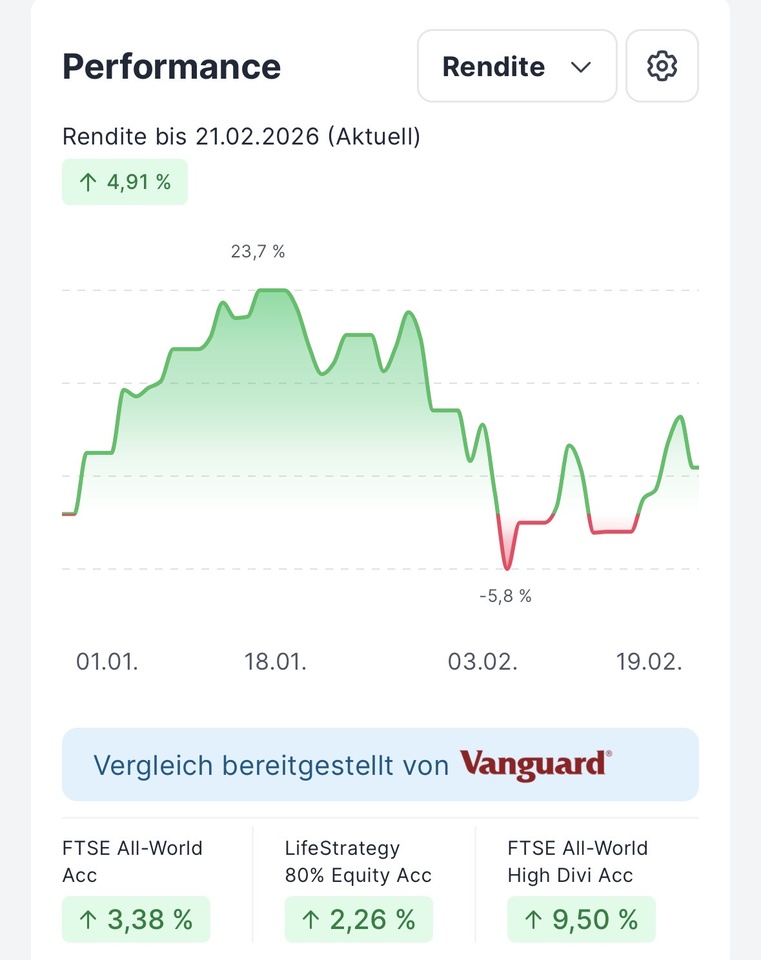
Since the beginning of the year (with taking into account the loss of $HIMS (-0,67%) ):
-5,1% 📉
_________________________
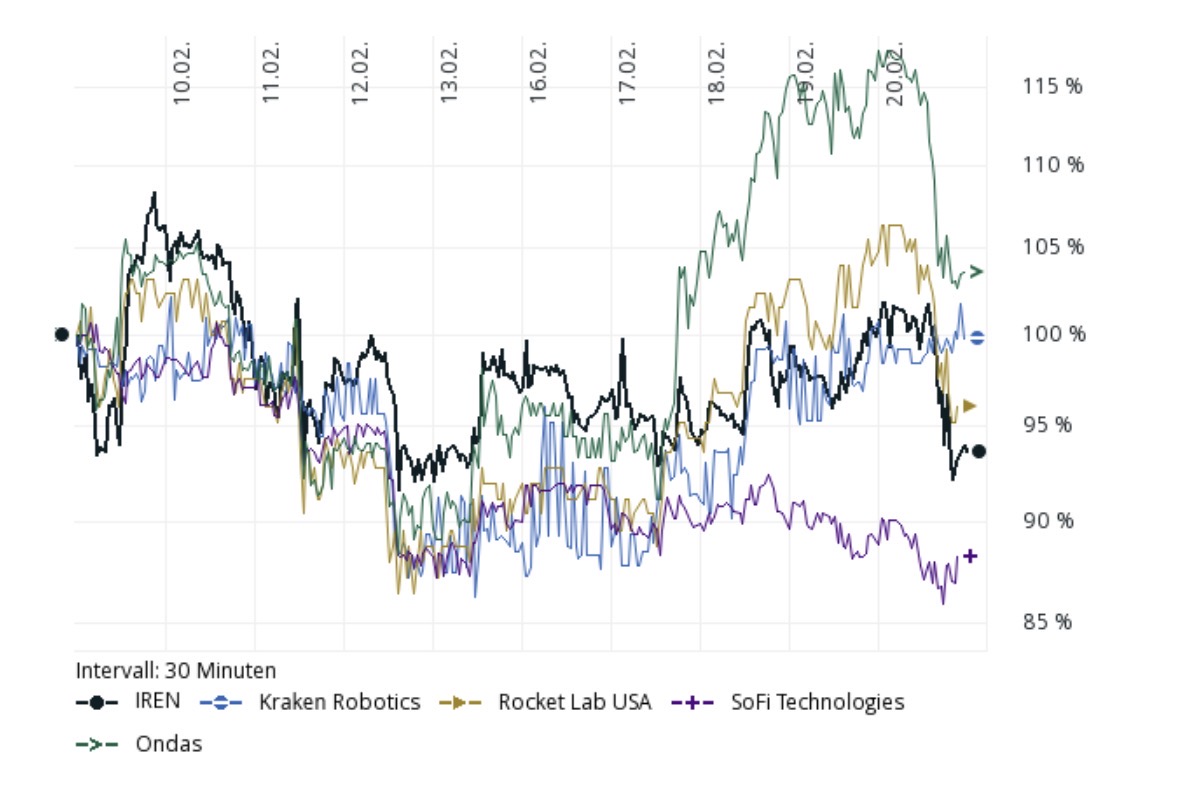
Below is the trend over the last ten days:
What do you think? Do you already have any guesses as to where we will be at the end of the year?


