1Mês·

S&P Global—Fair Value Trap or Opportunity?

Step 0: Real-Time Data & Context (as of August 2026)

Current Price: ~$435.40 USD

Market Cap: ~$127.6 billion USD

Dividend Yield: ~0.9%

Cyclicality: Moderate dependence on global bond issuance volume (ratings), cushioned by extremely stable, recurring data and index subscriptions.

$SPGI (+3,53%)

Point 1: Business Model & Disruption Check

S&P Global is the backbone of global financial markets and divides its business into four main pillars:

1. S&P Global Ratings: Credit ratings for countries, companies, and bonds.

2. S&P Dow Jones Indices: Licensing fees for indices such as the S&P 500 or Dow Jones (driven by the global ETF boom).

3. Market Intelligence & Commodity Insights: Data, analytics, and benchmark prices (e.g., Platts for energy/commodities) following the successful integration of IHS Markit.


Disruption Check: Extremely low. Ratings and financial data are based on decades of trust, historical data, and regulatory anchoring. Generative AI does not pose a threat but is used as an accelerator to monetize proprietary data feeds even more efficiently.


Point 2: Competitive Moat & Market Position (9.5/10 points)

The competitive moat is among the widest in the entire global economy:

Duopoly / Legal Oligopoly: Together with Moody’s, S&P Global dominates over 80% of the global ratings market. Virtually no large corporation or government can successfully place bonds on the capital market without an S&P rating.

Irreplaceable Licenses: The S&P 500 is the world’s most important stock index. Every fund provider and ETF issuer must pay licensing fees to S&P to track it.

Enormous pricing power: Customers simply cannot switch to the competition, which allows S&P to implement annual price increases without significant customer attrition.
attachment

Point 3: Financials & Deep Risk (8.5/10 points)

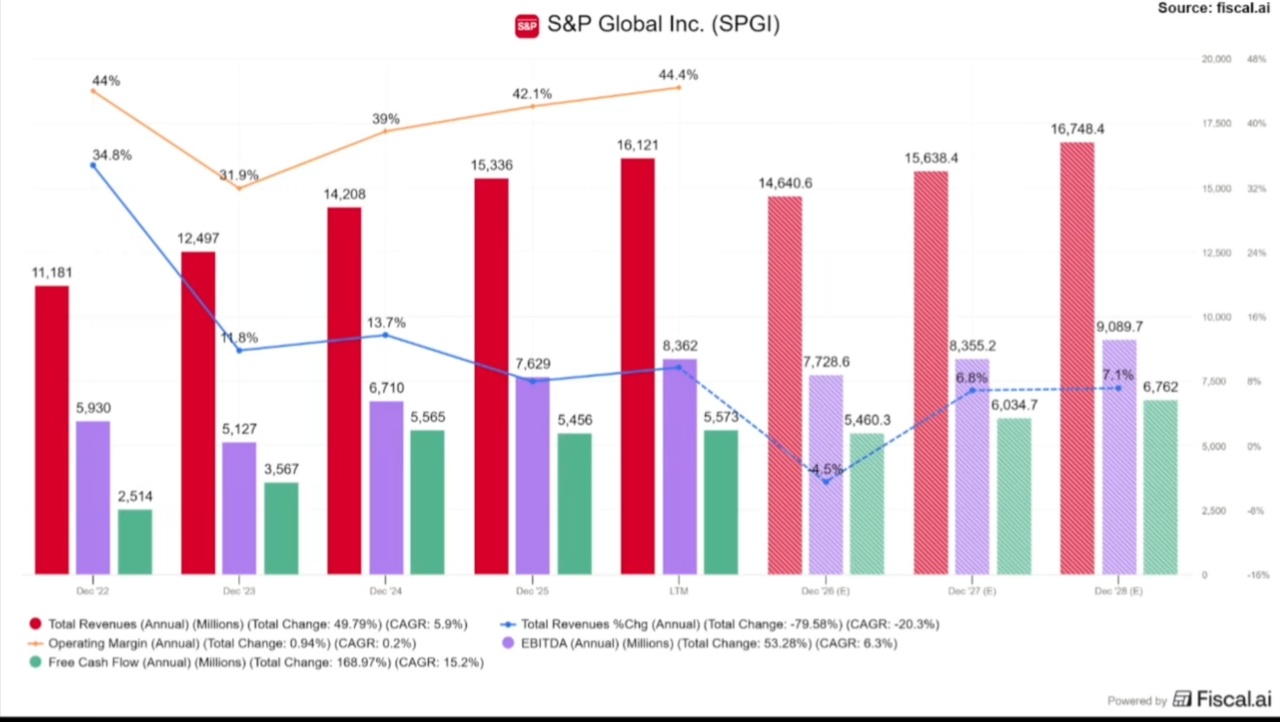
Growth: In Q2 2026, revenue climbed 10.4% year-over-year to $4.15 billion (beating analyst estimates). The main driver was strong bond issuance volume (+25% billed issuance), largely fueled by AI infrastructure financing from hyperscalers.

Margins & Cash Flow: An outstanding operating margin of ~54.3%. The asset-light model requires virtually no reinvestment, allowing nearly all profits to flow into free cash flow.

Capital Allocation: Strict discipline—consistent share buybacks and dividends that have been rising for decades.


Point 4: Valuation & Peer Group (6.5/10 points)

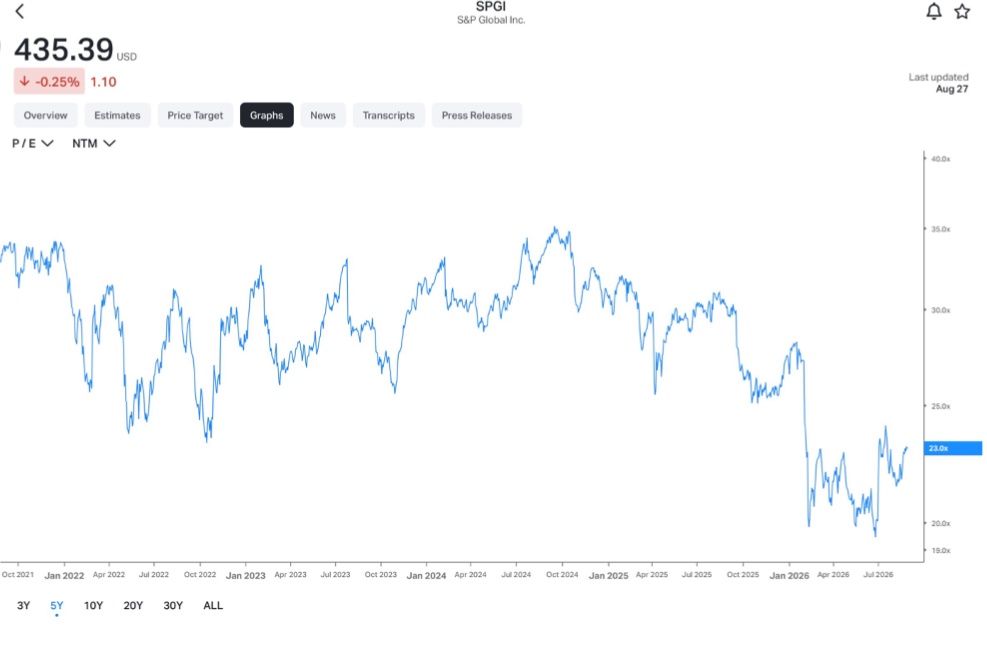
With a P/E ratio of 23, the stock is moderately valued from a historical perspective (the P/E ratio has often ranged from 30x to 35x in recent years).

Compared to its peer group (Moody’s, MSCI, FactSet), S&P Global is trading at a slight discount, primarily due to the temporary correction over the course of the year.

Margin of Safety: The P/E ratio isn’t “cheap,” but for a monopoly-like quality company with a margin exceeding 50%, the current level is attractive.
attachment
attachment


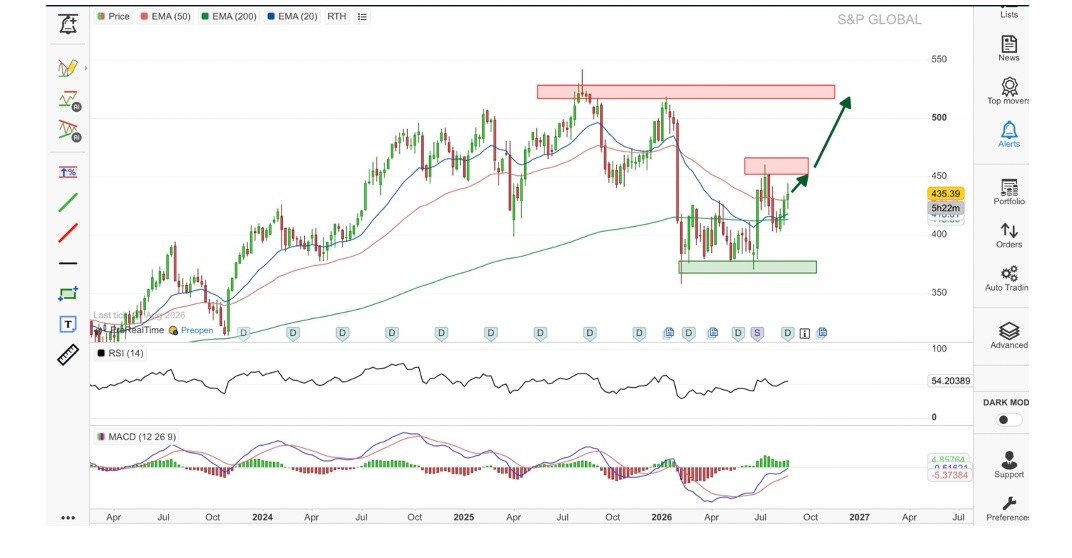
Point 5: Technical Analysis (6.0/10 points)

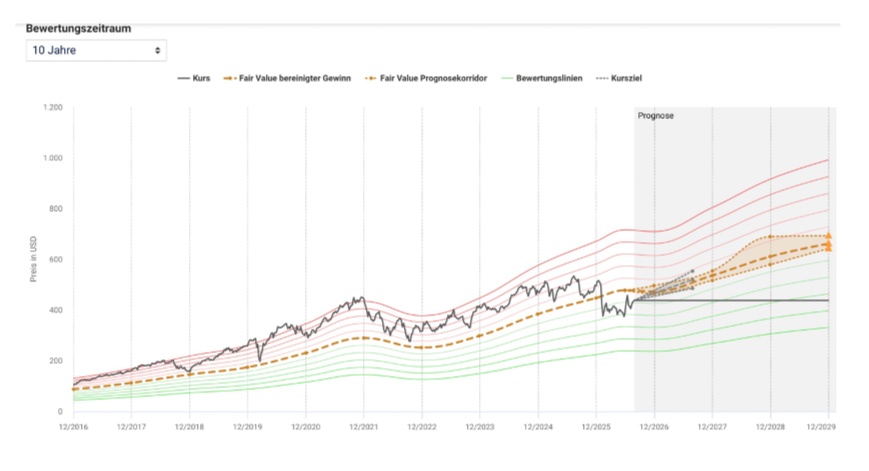
After reaching an all-time high, the stock went through a months-long consolidation phase and formed a solid base in the $360–$400 range.

Since the Q2 earnings report, the stock price has been steadily recovering toward $435.

The downtrend from the first half of the year has been broken, and momentum is slowly turning positive again.
attachment
attachment

CONCLUSION & INVESTMENT RATING

Calculation (Mode 1 Formula):

(Moat (doubled) + Financials + Valuation + Chart + Pre-Mortem) / 6

(19.0 + 8.5 + 6.5 + 6.0 + 8.0) / 6 = 48.0 / 6 = 8.0 / 10 points


Veto Check: No veto whatsoever. An absolute long-term performer (“monopolist”) in the global financial architecture.


The Verdict:

S&P Global is the prime example of a “Buffett-style company”: impregnable moats, irreplaceable products, and massive cash flow margins. Due to the correction over the past few months, the valuation has shrunk from astronomical heights back down to a reasonable level.

$SPGI (+3,53%)

Recommendation:

A top candidate for savings plans or long-term incremental purchases. Anyone looking for a crisis-proof core investment with consistent dividend growth and unbeatable pricing power can gradually build positions at this level.


I’m currently considering establishing an initial position there. What do you think? Are you invested?

@Raketentoni

@Get_Rich_or_Die_Tryin

@Tenbagger2024

@Aktienhauptmeister

@SAUgut777

And everyone else.....

18
17 Comentários

imagem de perfil
Highly needed... the company and its peers. I've invested in $CME. But all these companies work hand in hand to make sure everything runs smoothly.
•
4
•
imagem de perfil
Looks like I can comment again now—yay.😅😂 For me, it’s really as I’ve already concluded: The major, indispensable stock exchange operators and index providers like $MSCI, $SPGI, $CME, $NDAQ, $CBOE —and possibly $DB1 or even $LSEG —are simply core investments. Generally speaking, I find MSCI more interesting than S&P because it’s not as dependent on ratings—which account for a significant portion of S&P’s revenue—but in my view, it’s more susceptible to disruption.🤷🏼‍♂️ In my portfolio, $CBOE is currently the largest position. It’s a matter of conviction.😉
•
4
•
imagem de perfil
@Get_Rich_or_Die_Tryin Thanks so much for your comment—I always really value your opinion. To me, S&P Global just isn’t easily disrupted; after all, they share a duopoly in the ratings market with Moody’s. An S&P rating is often a regulatory requirement for companies issuing bonds, and decades of trust have made it virtually unassailable.
Otherwise, I totally agree with you.
Are you invested in any other stock exchange operators or anything like that?
And so you also think an investment in S&P Global makes sense right now, right?
•
2
•
imagem de perfil
@capital_captain_2693 That’s exactly where I see the problem. Who’s to say that the rating duopoly will endure in the age of AI (and at the end of the day, ratings are “just” about the technical assessment of financial parameters and outlooks)? I see tremendous potential for disruption in this area in particular, which is why I’d lean more toward MSCI (they “only” do ESG ratings😂).

Basically, though, I think it’s a sound investment in terms of the business model itself.👍🏻

Just invest in $CBOE and a few banking heavyweights, off the beaten path.😊
•
1
•
imagem de perfil
Hey, @capital_captain_2693!

Finally, a post from you that doesn’t give us a headache right away—unlike certain other characters like this one @Tenbagger-Capital, who are constantly hanging out on our patio here in the forum, drinking the fridge dry, and trying to drive us crazy with their highly speculative gambling schemes!

Let’s take a calm look at your analysis of **S&P Global Inc. ($SPGI)** based on our hard-facts standard.
Where did you hit the nail on the head, and where did you paint a slightly rosier picture than reality?

### What’s Correct (The Check):

* **Current Price & Market Capitalization:**
The figures you cited—~$435.40 and ~$127.6 billion—match the current figures exactly (approx. $436.50 and $127.6 billion, respectively).


* **Business Model & Spin-off:**
The four core pillars (Ratings, Indices, Market Intelligence, Commodity Insights) and the successful spin-off of the Mobility division (Mobility Global) on July 1, 2026, are thoroughly researched and accurate.


* **Revenue & Margins:**
The fact that revenue climbed by about 11% to $4.15 billion in Q2 2026 and that the adjusted operating margin stands at an astronomical 54.3% is fully consistent with the actual figures.


### What’s Wrong or Was Overlooked (The Correction):

* **The massive EPS miss:**
While you praise the strong business performance, you fail to mention the real reason behind the recent stock price decline.
The adjusted EPS of $4.08 missed analyst estimates ($4.75) by a whopping **14.1%**, triggering a 5.2% drop in the stock price and prompting around 20 analysts to revise their forecasts downward.
So the profit conversion this quarter wasn’t as rosy as you make it out to be.


* **Valuation (P/E ratio):**
A P/E ratio of ~23 falls a bit short. The current forward P/E ratio for the full year 2026 is more in the range of around 24.6x, while the historical level in previous years was significantly higher.


### The Unbiased Conclusion:

Your analysis is fundamentally sound, and S&P Global remains an absolute quality asset thanks to its irreplaceable moat.
However, amid all the euphoria surrounding the strong segments (Ratings and Indices), one must not ignore the missed earnings expectations and the increased debt ratio resulting from planned debt issuances for share buybacks.

Anyone who invests here is buying an absolute world-class monopoly, but will have to deal with headwinds and closer scrutiny from analysts in the short term.

Keep it up—don’t let the speculators get you down! ☕🚀
•
3
•
imagem de perfil
And what does Mr. Prompt generally have to say about S&P Global—that is, setting aside my analysis?
••
imagem de perfil
Thanks for the mention ✌️ I’m currently invested. The CRV is at a level that works for me; I added a small amount a few weeks ago. In general, I agree with what @Get_Rich_or_Die_Tryin said: this sector is simply indispensable. Stock exchange operators and index providers are the backbone of the entire financial world, whether it’s a bull or bear market.
•
2
•
imagem de perfil
@Aktienhauptmeister I think I'll open a position in the next few days. What kind of upside potential do you see? Do you have actual figures and such, or are you just estimating the CRV roughly?
•
1
•
imagem de perfil
@capital_captain_2693 For me, the upside potential is relative if you plan to hold a stock for the long term. Since I view it as a “buy-and-hold” position, I primarily look to see if the price is below fair value and add to my position accordingly.
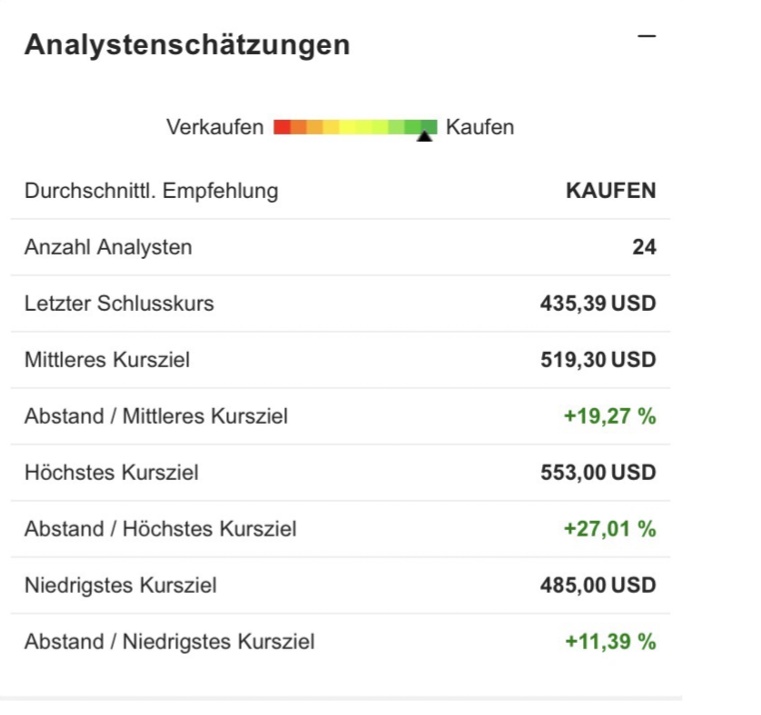
But if you’re asking for my specific calculations (time horizon: end of 2027):
Bull Case: +28–30% (~$550–$570)
Base Case: +14–16% (~$490–$510)
•
2
•
imagem de perfil
@Aktienhauptmeister Don't you have a prompt like Raketentoni's?
Could you have it compare MSCI and S&P Global to see which company your prompt—or you—thinks is better?
•
1
•
imagem de perfil
@capital_captain_2693 Yeah, I did. I'd be happy to. I'll finish it up for you later. I'm still out and about.
••
imagem de perfil
@capital_captain_2693
Hey @capital_captain_2693, Jack here ✌️ You’re asking for a showdown between these two heavyweights?
Both companies are in the financial sector (asset-light, moat-based monopolies) — pure quality, but with different areas of focus:

Let’s go

⚔️ MSCI vs. S&P Global

1. MSCI Inc. (MSCI) 🎯
Moat (4/4): The global standard for equity benchmarks & ETFs. Anyone who launches an index has to pay.
Financial Check: ROE >70%, operating margin at an outstanding ~54%. >80% recurring subscription revenue.
Piotroski F-Score: 7/9
Valuation & Risks: P/E ratio ~32–35. The risk lies in prolonged bear markets, as falling asset prices reduce licensing fees.

Conclusion: The sector’s purest margin and quality machine. Strong growth, highly scalable, and extremely visible.

2. S&P Global (SPGI) 🏰
Moat (4/4): An impregnable oligopoly in the credit rating market (together with Moody’s) + a massive data division (IHS Markit).
Financial Check: ROE ~18–20%, operating margin ~47%. Strong cash flow, though slightly more cyclical due to the rating business’s exposure to bond issuance.
Piotroski F-Score: 7/9
Valuation & Risks: P/E ratio ~26–29. Slightly more cyclical than the MSCI, as the rating volume is directly linked to global bond issuance activity.

Conclusion: The indestructible core investment with broader diversification.

🏆 The Verdict
Margins & Pure Economies of Scale: MSCI wins by a narrow margin. Its capital efficiency and recurring revenue are in a class of their own.

Moat Width & Stability: S&P Global wins. The rating oligopoly is simply irreplaceable.

My Favorite: If I had to choose one stock, I’d go with MSCI because of its even higher capital efficiency and stronger margins. SPGI, on the other hand, is the slightly more robust all-around choice for a portfolio. Both are absolute Tier-1 moat stocks! 🚀
••
imagem de perfil
Unfortunately, you can't see everything—just the first part.
••
imagem de perfil
@capital_captain_2693 I'll send it out again

Hey @capital_captain_2693, Jack here ✌️ You're asking for a showdown between these two heavyweights?
Both companies are in the financial sector (asset-light, moat-protected monopolies) — pure quality, but with different focuses:

Let’s go

⚔️ MSCI vs. S&P Global

1. MSCI Inc. (MSCI) 🎯
Moat (4/4): The global standard for equity benchmarks & ETFs. Anyone launching an index has to pay.
Financial Check: ROE >70%, operating margin at an outstanding ~54%. >80% recurring subscription revenue.
Piotroski F-Score: 7/9
Valuation & Risks: P/E ratio ~32–35. The risk lies in prolonged bear markets, as falling asset prices reduce licensing fees.

Conclusion: The sector’s purest margin and quality machine. Strong growth, highly scalable, and extremely visible.

2. S&P Global (SPGI) 🏰
Moat (4/4): An impregnable oligopoly in the credit rating market (together with Moody’s) + a massive data division (IHS Markit).
Financial Check: ROE ~18–20%, operating margin ~47%. Strong cash flow, though slightly more cyclical due to the rating business’s exposure to bond issuance.
Piotroski F-Score: 7/9
Valuation & Risks: P/E ratio ~26–29. Slightly more cyclical than the MSCI, as rating volume is directly linked to global bond issuance activity.

Conclusion: The indestructible core investment with broader diversification.

🏆 The Verdict
Margins & Pure Economies of Scale: MSCI wins by a narrow margin. Its capital efficiency and recurring revenue are in a class of their own.

Moat Width & Stability: S&P Global wins. The ratings oligopoly is simply irreplaceable.

My Favorite: If I had to choose one stock, I’d go with MSCI because of its even higher capital efficiency and strong margins. SPGI, on the other hand, is the slightly more robust all-around choice for a portfolio. Both are absolute Tier-1 moat stocks! 🚀
•
1
•
imagem de perfil
@capital_captain_2693 Yeah, I'll take care of everything :)
••
imagem de perfil
@Raketentoni Thank you so much ♥️
••
Participar na conversa