

Hello my dears, about 6 months ago there was already a presentation of the share, by the dear @1Chrischi1
It makes me very sad that Dear only got one Like👍 for this presentation.
This is not a respectful recognition for a user who introduced you to a good stock and invested a lot of work and time in it.
The fact that it would have been worthwhile to take a closer look at this presentation is shown by the
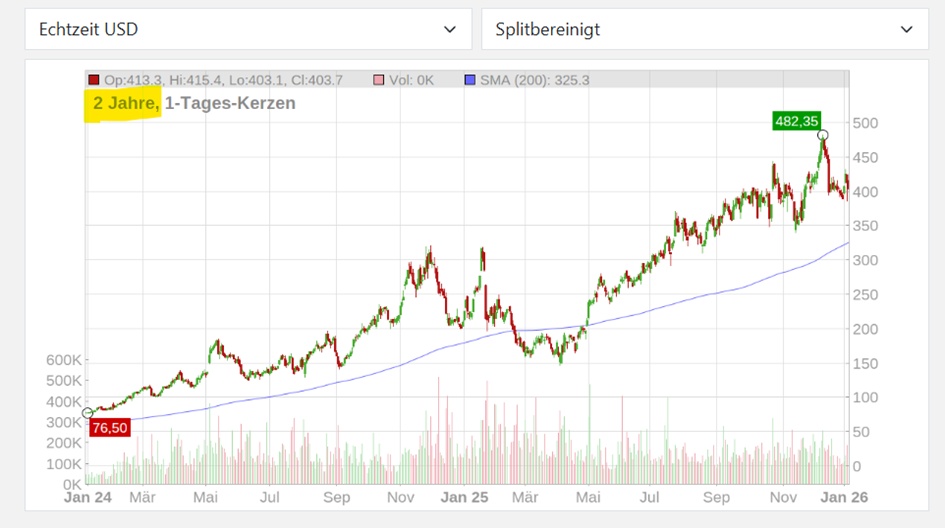
6 month performance of +35 %.
1 year +75.13 %.
The company is the rather unknown IES Holding. $IESC (-0,27%)
Perhaps a little like Vertiv $VRT (+0,12%) but there are also differences.
IES Holdings is a solid, underestimated infrastructure compounderbenefiting from digitalization and construction.
Vertiv is a high-conviction play on AI data centerswith global scale and structural tailwinds.
Category
IES Holdings
Vertiv
Industry
Construction, Electrical, Infrastructure
Data center infrastructure
Business model
Project-based
Products + services
customers
Industry, construction, telecom
Hyperscaler, cloud, AI
Growth driver
Digitalization, construction AI boom, cloud, energy demand
Geography
USA
Global
Turnover size
less than
8 billion USD (2024)
I am invested in both companies, but today's presentation is about
IES Holding $IESC (-0,27%) today.
The share shines in the TraderFox growth and quality check.
That's why I am presenting it as one of the top scorers from my portfolio.
(with many likes more should follow)
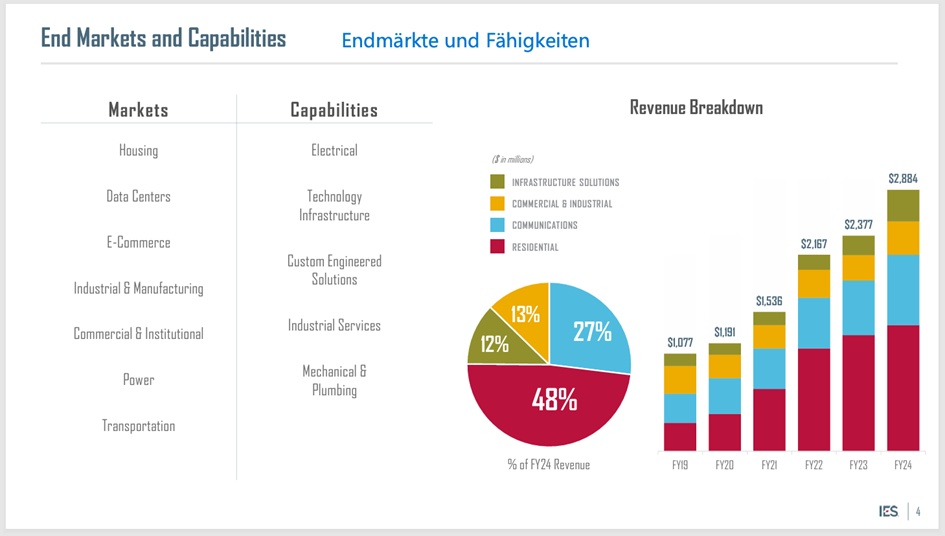
The growth check checks the attractiveness of growth stocks. Growth shares are not shares to buy and leave carefree. Growth shares can yield extraordinarily high profits over a period of two to three years. Investors must expect major price fluctuations and failures!
1. the number of points (maximum 15) indicates the quality of growth. It is checked whether a company's sales and profits are growing at a disproportionately high rate compared to the rest of the market. It is also checked whether the growth can be financed or whether it is the result of excessive debt.
The TraderFox quality check assigns up to 15 points to each share. We use key figures that have become established in financial science to distinguish quality from junk. The special feature of our quality check is that the 15 criteria are always considered in the context of the other stocks on the market. According to the principle: a key figure is considered to be fulfilled if the company performs better than, for example, 65% of all other companies in the respective reference market. The quality check is firstly intended to help investors reduce the risk of investments and secondly to draw attention to outstanding investment opportunities.
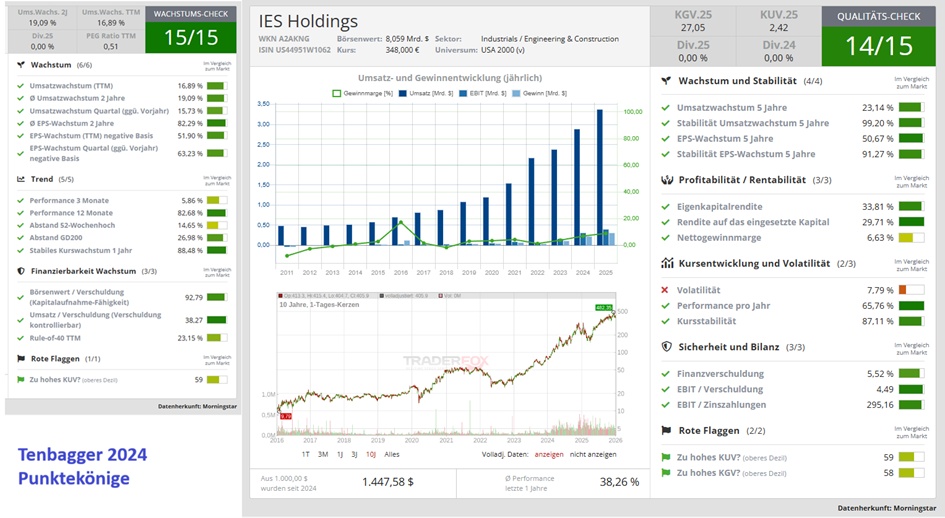
IES Holdings, Inc. is a provider of electromechanical solutions for industry, including equipment repair and customized products. The Company's Communications segment provides technology infrastructure services, including the design, construction and maintenance of data center communications infrastructure. The Residential segment provides electrical installation services for single-family homes and multifamily buildings, as well as heating, ventilation and air conditioning (HVAC) and plumbing installation services. The Infrastructure Solutions segment provides electromechanical solutions for industrial operations, including equipment repair and customized products. This segment also offers structural steel fabrication and services and has 450,000 square feet of manufacturing space on a 60-acre campus. The Commercial & Industrial segment provides electrical and mechanical design, construction and maintenance services.
Number of employees: 10,273
IES Holdings: at the crossroads of construction and digital infrastructure
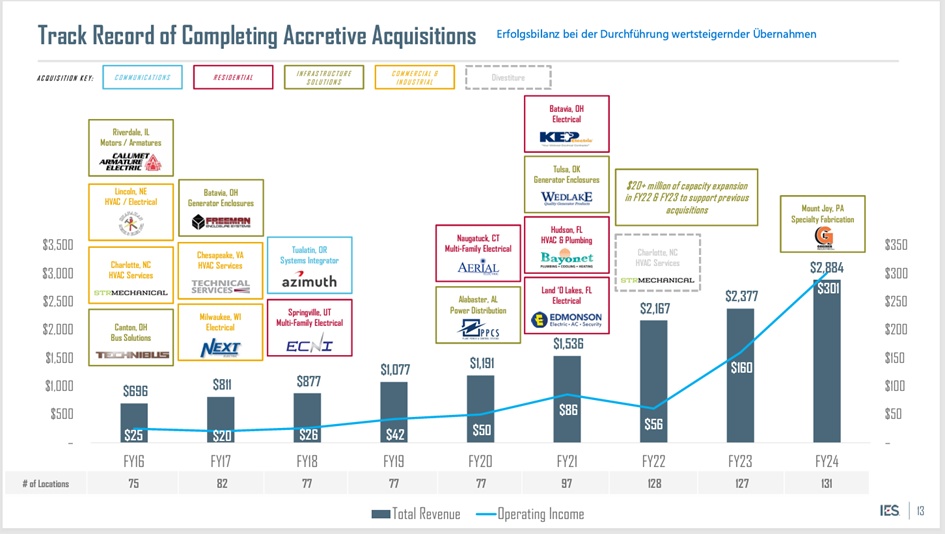
IES Holdings is a key beneficiary of the AI and cloud boom, as the Communications segment is the strongest growth driver with the construction and maintenance of data centers. The business model is based on a stable revenue base from residential construction and is being expanded through diversification into specialized areas.
IES Holdings has a record order backlog and expects demand for data centers to remain high in the next financial year!
IESC share: IES Holdings is a silent winner of digitalization
Building technology and data centers, power supply and industry / Long-term capital allocation / Founders with "skin in the game" / High barriers to entry
Founders with "skin in the game" and attractive corporate culture
A key success factor for small companies in particular is strong management with "skin in the game". Founder and former CEO Jeffrey Gendell holds around 55% of the outstanding shares together with his brother shares via the jointly managed investment company Tontine. Jeffrey Gendell gained experience in his early years at companies with a focus on capital markets, corporate finance, mergers and acquisitions.
The management's regular remuneration package is moderate - what is more important is the high level of personal involvement, which shows that Gendell focuses on sustainable value creation rather than short-term bonuses. Employees on review platforms such as Indeed also confirm a positive corporate culture with fair pay, appreciation and a motivating management style.
IESC Aktie: die IES Holdings ist ein stiller Gewinner der Digitalisierung - ftd.de
Performance comparison of the peer group
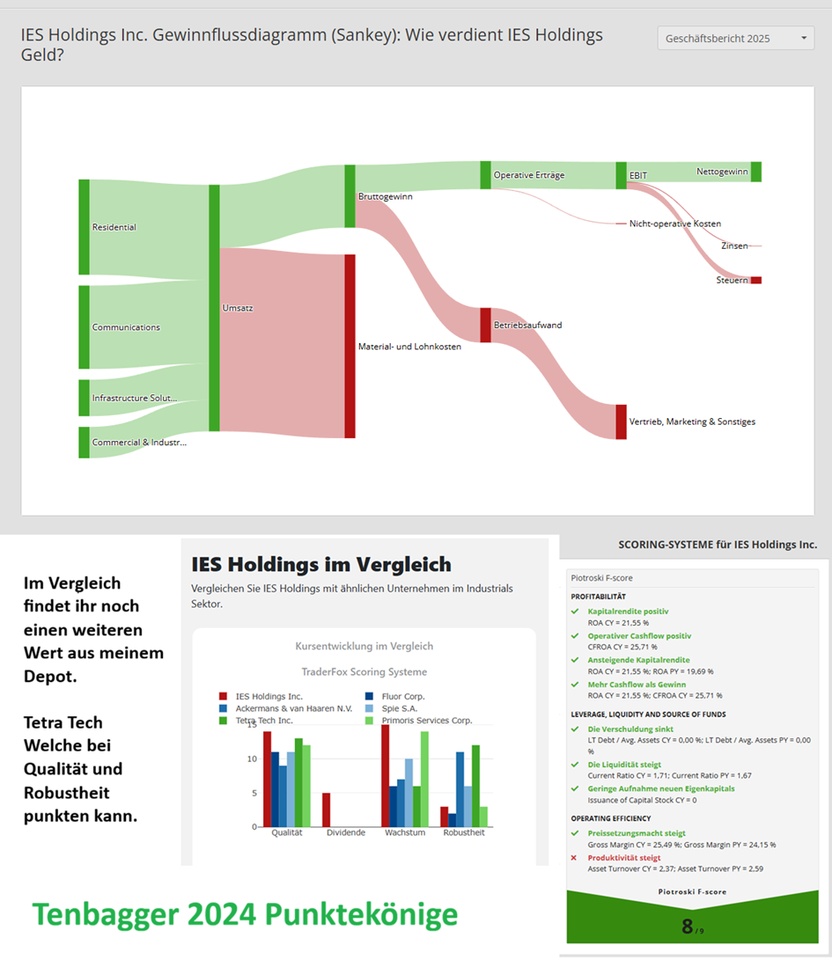
Average annual performance
10 5
IES Holding 49.74 % 64.13 %
Primoris Service 21.77 % 45.41 %
Spie S. A. 11.53 % 24.24 %
Ackermann & van Haaren 5.50 % 14.37 %
Fluor Corp. -0.21 % 28.98 %
Tetra Tech Inc. 21.00 % 10.02 %
IES Holdings Inc. fourth quarter earnings gains
Above expectations
IES Holdings Inc. Ergebnisgewinne im vierten Quartal
Fundamental figures History
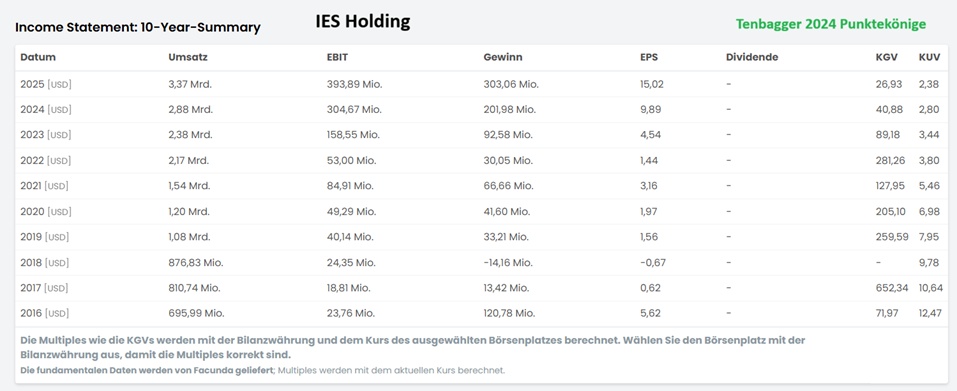
USD in millions
Estimates
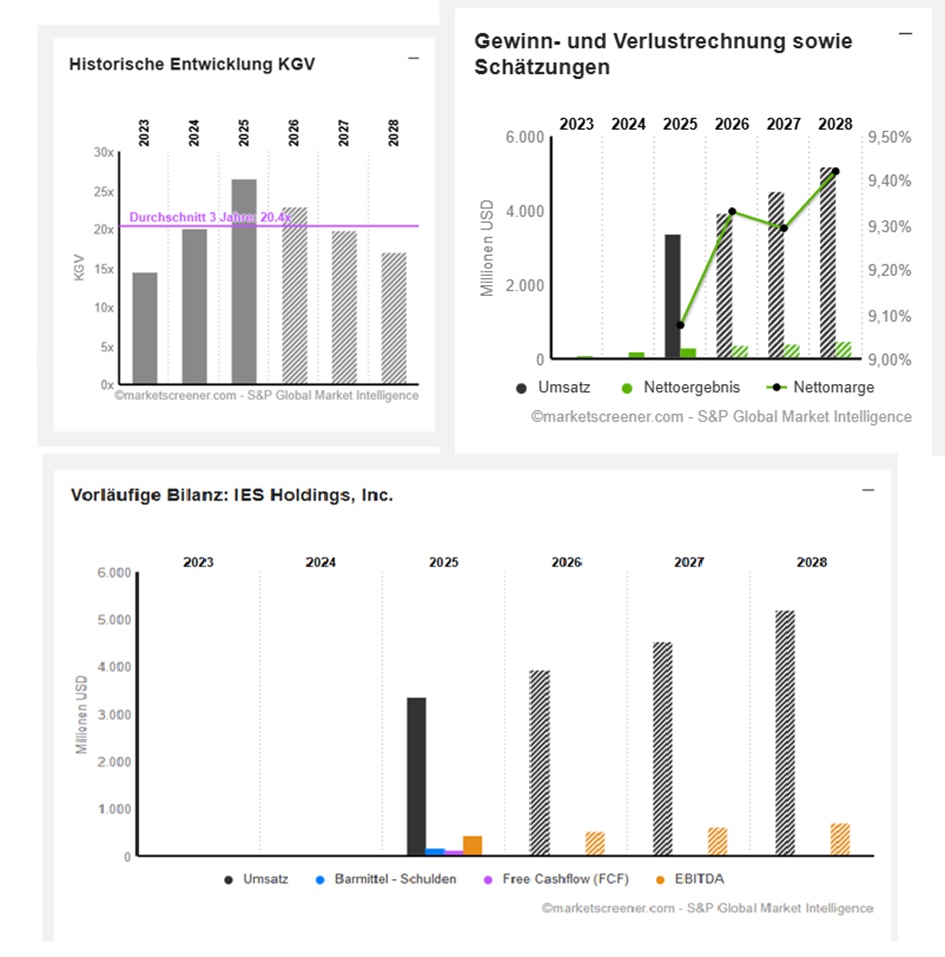
Year Sales Change
2025 3.371
2026 3.944 16,98 %
2027 4.541 15,14 %
2028 5.201 14,53 %
Year EBIT change
2025 383,5
2026 482 25,67 %
2027 562 16,6 %
2028 652 16,01 %
Year Net result Change
2025 306 39,64 %
2026 368 20,27 %
2027 422 14,67 %
2028 490 16,11 %
Net debt 2025 -170
Year CAPEX Free cash flow
2025 67,25 221,5
Year EBIT Margin ROE
2025 11,38 % 40,5 %
2026 12,22 %
2027 12,38 %
2028 12,54 %
Year P/E ratio PEG earnings p share
2025 26.5x 0.5x 15.02
2026 22.9x 1.1x 18.03
2027 19.9x 1.3x 20.71
2028 17.1x 1.1x 24.08
Number of shares (in thousands) 19,855
Market value 8,185
Date of publication 21.11.2025
INVESTOR PRESENTATION January 2025

THANKS FOR READING!

