
October 22, 2025
Source
Postos
40$NDAQ (-0,07%)
$RTX (+0,36%)
$KO (-0,19%)
$MMM (-1,7%)
$NOC (-1,27%)
$LMTB34
$OR (-0,45%)
$TXN (-1,3%)
$NFLX (-1,01%)
$HEIA (-2,21%)
$SAAB B (+3,91%)
$UCG (-1,88%)
$BARC (+0,45%)
$GEV (+0,1%)
$TMO (+1,23%)
$T (+1,89%)
$MCO (+1,67%)
$IBM (+7,67%)
$SAP (-2,59%)
$TSLA (-3%)
$AAL (+9,13%)
$FCX (+0,3%)
$HON (-2,31%)
$DOW (+0,95%)
$NOKIA (+1,79%)
$TMUS (-1,14%)
$INTC (-6,3%)
$NEM (-3,15%)
$F (+6,27%)
$PG (-0,02%)
$GD (+0,43%)

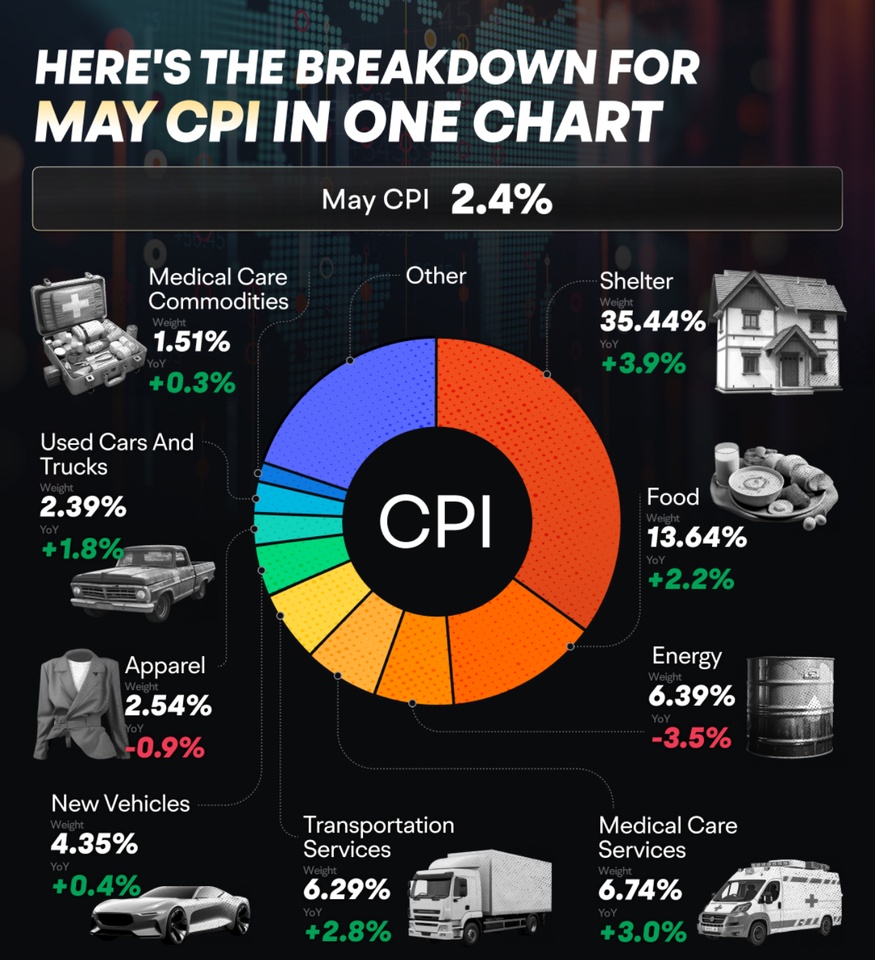
The CPI US Consumer Price Index rose to 2.4% in May 2025 for the first time in four months, up from a low of 2.3% in April 2021, although it was below the expected 2.5%. On a monthly basis, the CPI rose by 0.1%, which was below both the previous month's figure of 0.2% and the expected 0.2%.
Food prices rose by 2.2% year-on-year, following an increase of 2.8% in the previous month. Energy costs fell by 3.5% year-on-year, following a fall of 3.7% in April. Energy prices fell by 1.0% on a monthly basis.
Prices for used cars and trucks rose by 1.8% year-on-year, following a rise of 1.5% in the previous month. Housing costs rose by 3.9% year-on-year, following an increase of 4.0% in April.
The annual core inflation rate, which excludes the volatile food and energy sectors, remained steady at 2.8%, the lowest level since 2021 and below the expected increase to 2.9%. The monthly core CPI also rose by 0.1%, but remained below the 0.2% in April and the expected 0.3%.
$DAX
$NDAQ (-0,07%)
$SPY (+0,84%)
$NVDA (+1,3%)
$BTC (+0,76%)
$MSFT (+0,54%)
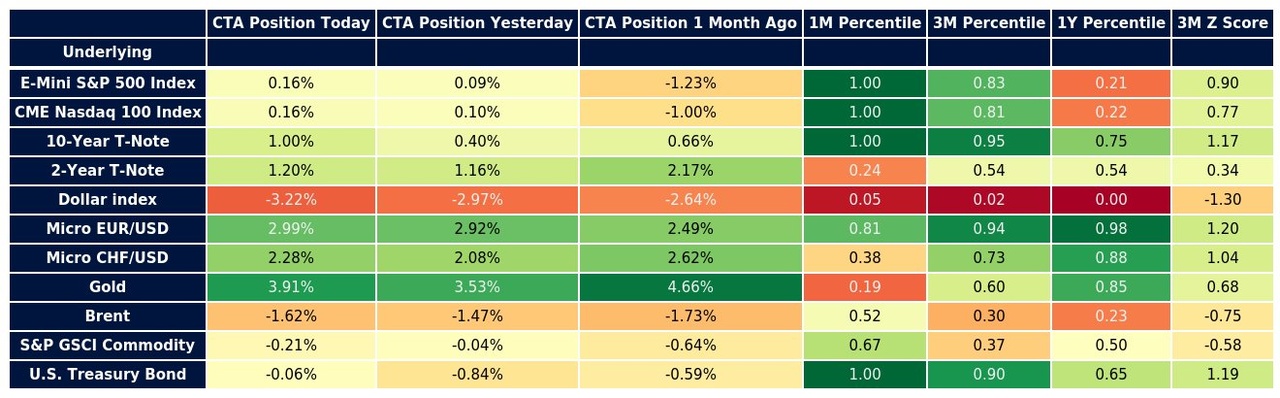
CTA clearly indicate that they are cautiously bullish on S&P500 & $NDAQ (-0,07%) . The position is up 0.16%. The 1 month percentile is at 1, which was the highest level since last month. A cautious long position is opened.
Bonds look very long. The current position is 1%, which is also the highest level in a month. The value is also strongly long within 3 months (3MZ). The inflows in 10Y Treasuries point to a potential interest rate cut.
Looking at the dollar, the position is -3.22%, i.e. strongly short. The 1-year percentile is also at 0, which is historically the lowest value. A small indication that inflation is reducing the purchasing power of the dollar.
Gold is currently very strong at 3.91%. The rise is an indication that there is a risk of inflation.
Since I realize that a large number of people are not familiar with CTAs, I am currently working on a guide on how to interpret such values!
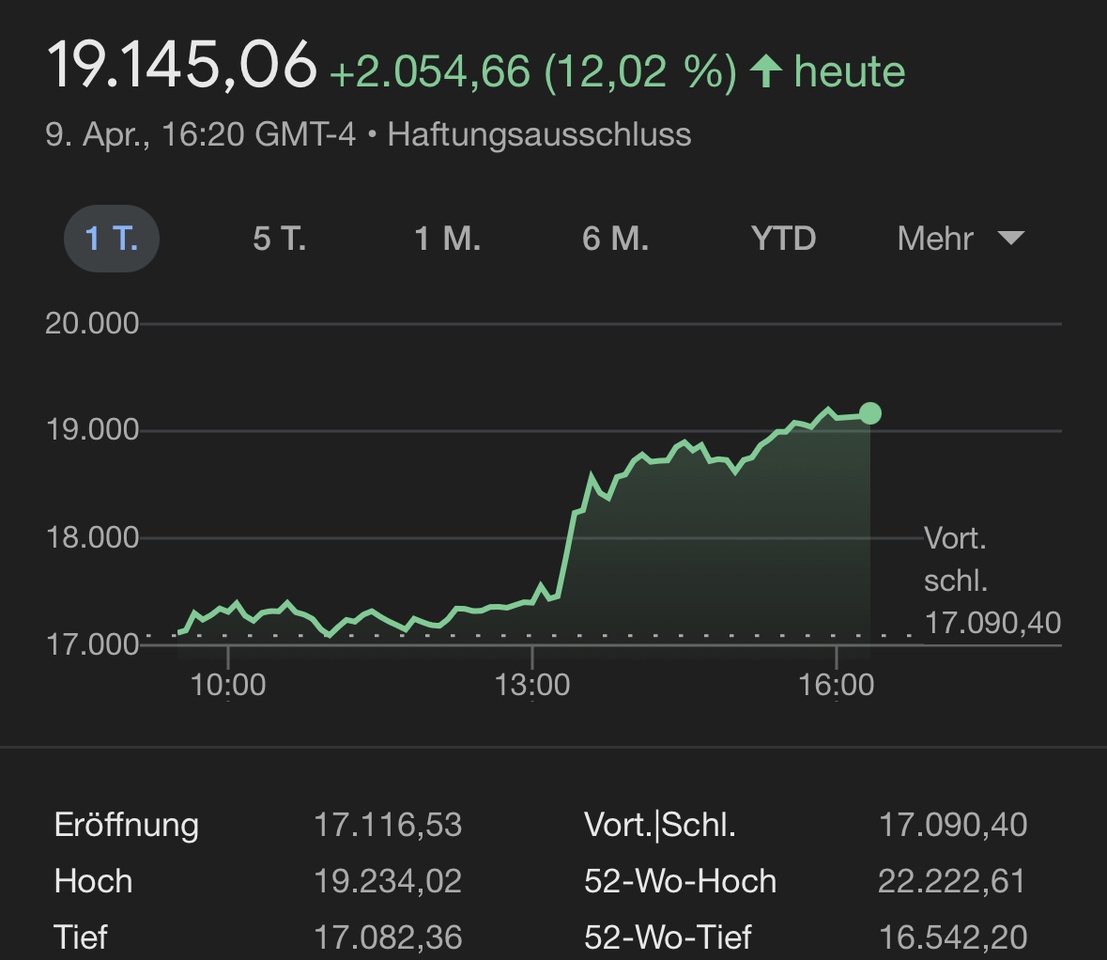
US stock markets $NDAQ (-0,07%) Just reported their biggest daily rise since 2001, making today the third biggest day in the post-war period.
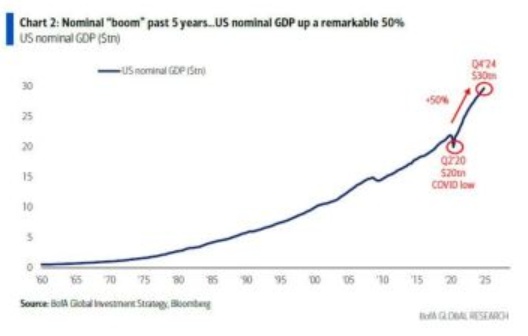
1. economic fundamentals
As shown in Chart 2 the nominale US-Bruttoinlandsprodukt has risen by around 50% in the last five years, from around USD 20 trillion to USD 30 trillion. This increase was largely driven by expansive fiscal policy measures, strong consumption and inflationary effects. However, current indications suggest that political demands for lower inflation and reduced government spending could weaken this "boom". An end to the pace of nominal growth could limit long-term peaks in government bond yields, the US dollar and speculative asset classes.
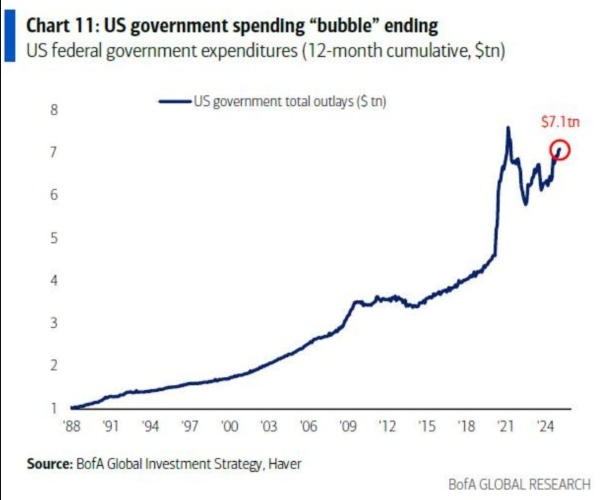
Government spending and budget structure (Chart 11 & Table 1)
Chart 11 shows that cumulative US federal spending over the last twelve months amounted to USD 7.1 trillion. Compared to European countries, it is noticeable that the US invests a significantly lower proportion of its budget in education (4%), while spending on healthcare (27%) and debt servicing (13%) is prioritized. European countries such as Germany and France, on the other hand, dedicate larger budget shares to social areas such as education (13% and 11% respectively) and pensions (24% and 25% respectively).
2. technical market signals
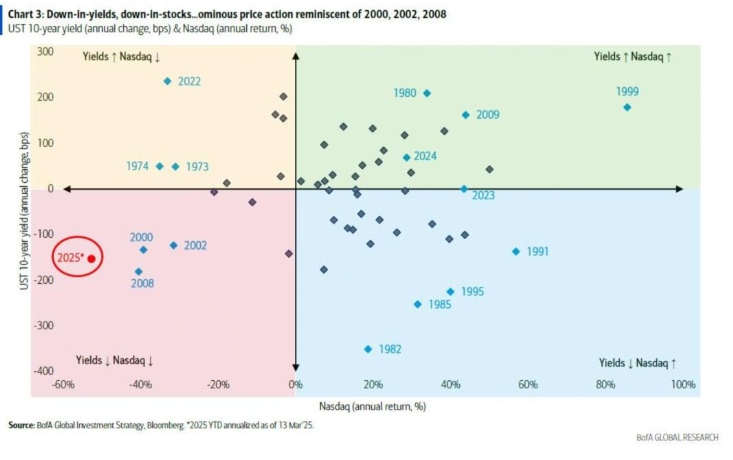
Simultaneous decline in bond yields and equities (Chart 3)
Chart 3 illustrates the current pattern of parallel declines in 10-year US government bond yields and equities. $NDAQ (-0,07%) . Such down-in-yields/down-in-stocks phases have historically occurred in crisis years such as 2000, 2002 and 2008. A key indicator for observation is the XBD-Broker-Dealer-IndexAs broker dealers are closely linked to the financial markets, the index is an important indicator of the health of the fin sector and general market sentiment.
Correction of speculative "Bro Bubble" stocks (Chart 4)
Like Chart 4 shows, one particular group, including$NVDA (+1,3%) , $TSLA (-3%)
$META (+0,32%)
$ARKK (+1,57%) , has fallen by around 25% since January 20, 2024. These stocks had previously gained 55% between the US election and the inauguration in January. The current decline indicates a reduction in risk, i.e. a switch to defensive sectors.
Capital flows and buy-the-dip mentality (Chart 14)
Despite the market volatility, Bank of America retail clients recorded the third-largest weekly inflows into equities in March 2024 since records began (Chart 14). This shows that many investors continue to focus on short-term recoveries.
3. sentiment and position indicators
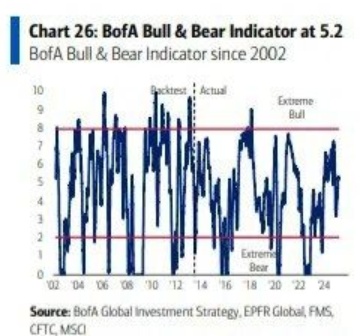
Mixed sentiment in the Bull & Bear indicator (Chart 25 & 26)
An aggregated sentiment indicator (Chart 25 & 26), which takes into account factors such as hedge fund positioning, credit market techniques and capital flows, is currently in neutral territory (5.2 out of 10). A fall in the indicator to 2.0 would historically trigger a buy signal.
Cash allocation and high-yield bond spreads
The average cash allocation in portfolios recently rose to 4%, which is close to the threshold of 4.1% (Chart 25). At the same time, the risk premiums for US high-yield bonds (HY-Spreads) are at 340 basis points. A rise to 400 basis points could mark a low point. HY spreads measure the difference between the yields on high-yield bonds (junk bonds) and the yields on safe government bonds (US Treasuries). Narrower spreads (lower values) indicate a higher risk appetite on the part of investors, while wider spreads (higher values) indicate increased risk aversion. If the cash allocation rises above 4.1%, this could signal that the correction has bottomed out and a recovery is imminent.
4. historical comparisons and scenarios
Political uncertainty and real yields (Chart 5 & 13)
The Chart 5 (NFIB-Unsicherheitsindex) shows that small US companies are increasingly expressing concerns about tax and regulatory policy. The NFIB Uncertainty Index measures the uncertainty of small and medium-sized companies in the USA with regard to economic and political factors. A rise in the index indicates that companies are increasingly concerned about future developments. At the same time Chart 13 illustrates the inverse correlation between US real yields (10-year) and gold prices, which positions gold as a hedge against falling real interest rates. When real yields fall (due to lower nominal yields or higher inflation), gold becomes more attractive. When real yields fall, gold prices tend to rise as investors look for safe investments.
Summary:
The current market correction shows characteristics of a typical technical correction, but is not yet complete. Decisive signals for an end would be
An increase in the cash allocation to over 4.1% (Chart 25),
HY spreads of 400 basis points (Chart 3),
A stabilization of the XBD broker-dealer index above 750 points (Chart 4).
Historical comparisons suggest that the $SPY (+0,84%) reaches a potential support zone at around 5,300 points. Political decisions, particularly on monetary and fiscal policy, remain a critical factor
+ 5
As already posted privately, at least this part is also public. Did some shopping today:
In the last few days, there are apparently signs that the free fall is flattening out. We often see an area that is being approached again and is holding. So for me it was now time to initiate a new wave of buying :)
but: will it really turn now? We don't know... and who knows if the man on the other side of the Atlantic won't come up with something new
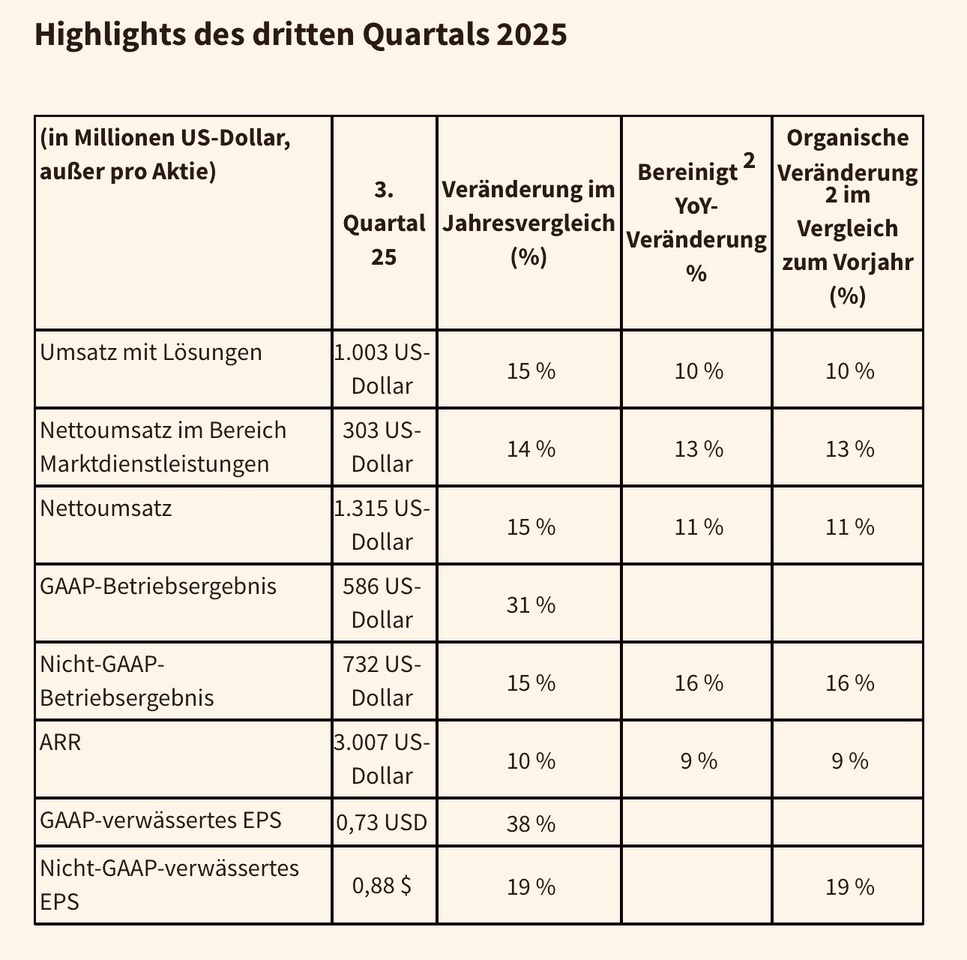
Nasdaq, Inc $NDAQ (-0,07%) – ever heard of it? Of course, you have! It's not just some stock exchange, it's the Nasdaq Stock Market, the second-largest in the world by market capitalization. But hold on tight, because Nasdaq is like a roller coaster of financial innovation, with twists and turns that'll make your head spin. They've gone from trading stocks to becoming a global tech titan, offering cutting-edge solutions for the capital markets. Think of them as the cool kids on the financial block, always pushing the boundaries and making things happen.
Read my full article on my website ! https://www.waver.one/p/nasdaq-inc-buckle-up-for-a-wild-ride

All of these shares reached new ALL-TIME HIGHS at some point today ⤵️
Nvidia $NVDA (+1,3%)
Amazon $AMZN (+1,98%)
Netflix $NFLX (-1,01%)
Walmart $WMT (-0,55%)
JPMorgan $JPM (+2,5%)
Goldman Sachs $GOS0
Palantir $PLTR (+2,27%)
Blackrock $BLK
American Express $AXP (+1,25%)
Arista $ANET
Apollo $APO PR A
Blackstone $BX (+0,28%)
Booking $BKNG (+0,87%)
Instacart $INSTA (-1,45%)
Caterpillar $CAT (+1%)
Capital One $COF (+1,84%)
Discover Financial $DFS
Electronic Arts $EA (-0,14%)
GE Vernova $GEV (+0,1%)
Hilton $HLT (-0,13%)
Howmet $HWM (-0,19%)
Interactive Brokers $IBKR (+2,42%)
Cheniere $LNG (-0,96%)
Morgan Stanley $MS (+2,82%)
Marriot $MAR (+0,86%)
Nasdaq $NDAQ (-0,07%)
News Corp $NWSA (+0%)
Oracle $ORCL (+1,52%)
Palo Alto $PANW (+1,24%)
ServiceNow $NOW (+0,19%)
Steel Dynamics $STLD (+1,26%)
Stryker $SYK (-0,91%)
Royal Caribbean $RCL (+0,28%)
Reddit $RDDT (-0,02%)
Trade Desk $TTD (+1,45%)
Visa $V (+0,3%)
Wells Fargo $WFC (+2,51%)
Principais criadores desta semana