𝗠𝗮𝗿𝗸𝗲𝘁 𝗡𝗲𝘄𝘀 🗞️
𝗠𝗶𝘁 𝗦𝘁𝗮𝗿𝗸𝘄𝗶𝗻𝗱 𝘇𝘂 𝗦𝘁𝗿𝗼𝗺, 𝗙𝗿𝗲𝘀𝗵 𝗙𝗼𝗼𝗱 𝗮𝘂𝘀 𝗱𝗲𝗿 𝗞𝗼𝗰𝗵𝗯𝗼𝘅 , 🚨 𝗖𝗿𝘆𝗽𝘁𝗼-𝗪𝗮𝗿𝗻𝗶𝗻𝗴 🚨
𝗘𝘅-𝗗𝗮𝘁𝗲𝘀 📅
As of today, among others, ASML ($ASME (+0,11%)), Brown & Brown ($BTW (+0,1%)), CrossAmerican Partners ($CAPL), Diana Shipping ($DSZ (+1,52%)), Luby's ($LUB), Metro City Bank ($MCBS (+0%)), MarketAxess ($MWI (+0,41%)), Minerals Technologies Inc. ($MNK (+0%)), Northern Technologies International Corp. ($NTIC), Del Taco ($22L) and VSE Corp. ($VSEC (+1,31%)) traded ex-dividend.
𝗤𝘂𝗮𝗿𝘁𝗮𝗹𝘀𝘇𝗮𝗵𝗹𝗲𝗻 📈
Things are really busy again, so here are the main companies reporting their numbers today. Today BP ($BPE5 (-0,59%)), HelloFresh ($HFG (-0,72%)), IDEXX Laboratories ($IX1 (+0,88%)), OSRAM ($OSR), Pfizer ($PFE (+0,15%)), Prudential Financial ($PLL (+0,1%)), Ralph Lauren Corp. ($PRL (+0,55%)), Samsung SDI ($XSDG (+13,24%)), The Western Union Company ($W3U (-1,05%)), T-Mobile US ($TM5 (+0,48%)), Under Armour ($U9R (-0,02%)) and Yamaha Corp. ($YHA (-0,35%)) presented their figures.
𝗠𝗮𝗿𝗸𝗲𝘁𝘀 🏛️
Wind Energy - So far in 2021, 345 wind turbines with a total capacity of 1.4 gigawatts have been connected to the grid. Compared to the same period last year, this is an increase of over 50%. Currently, the same number of turbines have already been erected in the current year 2021 as in the entire previous year. According to the president of the German Wind Energy Association, it is possible to reach the total capacity of 2 gigawatts of commissioned plants this year.
HelloFresh ($HFG (-0,72%)) - HelloFresh has raised its revenue forecast to thanks to strong growth in the current fiscal year up to and including October another time. Core revenue increased from €970 million to €1.416 billion compared to the same period last year. This was due to strong customer growth and a continued high order rate, as well as high average order values. Adjusted operating profit margin before interest, taxes, depreciation and amortization is forecast to be between 8.25 and 10.25 percent.
𝗖𝗿𝘆𝗽𝘁𝗼 💎
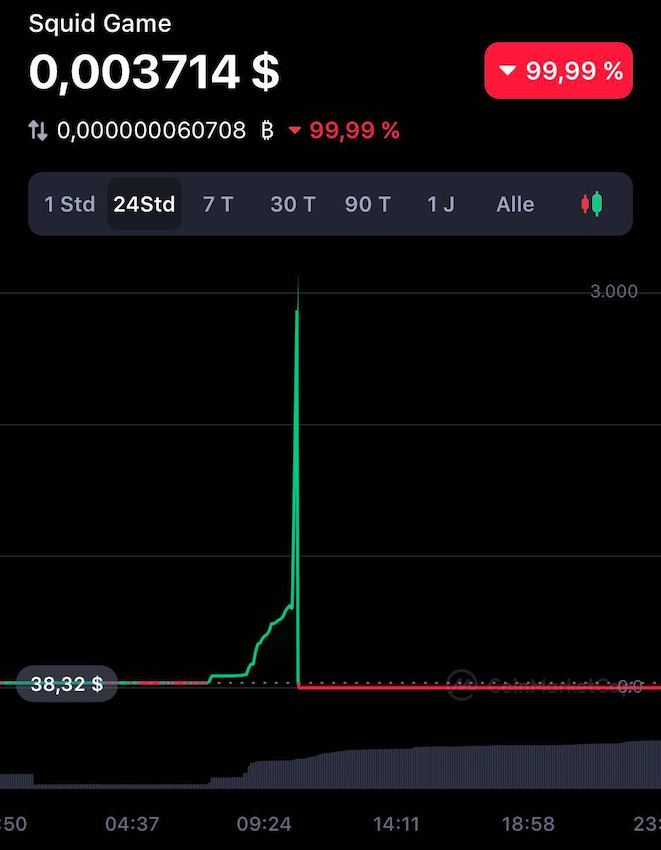
Squid Game - The coin with the acronym SQUID, which alludes to the unprecedentedly successful Netflix series Squid Game, shocked the crypto scene yesterday. The coin launched last Thursday at a starting price of $0.01. Within 4 days, the price increased by an incredible 380,000.00% to $38 on Monday morning. After further growth, the price rose to $89 on the same day. However, the journey was not to end here. Within 3 hours, events rolled over. The price of SQUID grew to an incredible $2,861.80 and just 5 minutes later the coin crashed by 99.99% to $0.0007926.
Additionally, the website that promoted the coin is no longer online. It is now also known that many holders of SQUID were no longer able to sell their positions from a certain point, so they could only watch idly. It is therefore a so-called rug-pull, i.e. that the developers of the project have sold it and have gone underground with the profits. In addition, it is now also clear that there are no connections to Netflix or other representatives of the series.
Please see this story as a warning (🚨) of what can happen when investing imprudently in small-cap meme coins. Many investors have lost their money without a chance to get it back. Inform yourself before you invest. You can see exactly which points you should pay attention to on our Instagram page in the coming days.
Follow us for french content on @MarketNewsUpdateFR