➡️ $CB (+1,02%)
📈 One of the cleanest trades I’ve ever had!
Today I’m closing out the last 50% of my position—and looking back, it really was a textbook trade.
What did the setup look like?
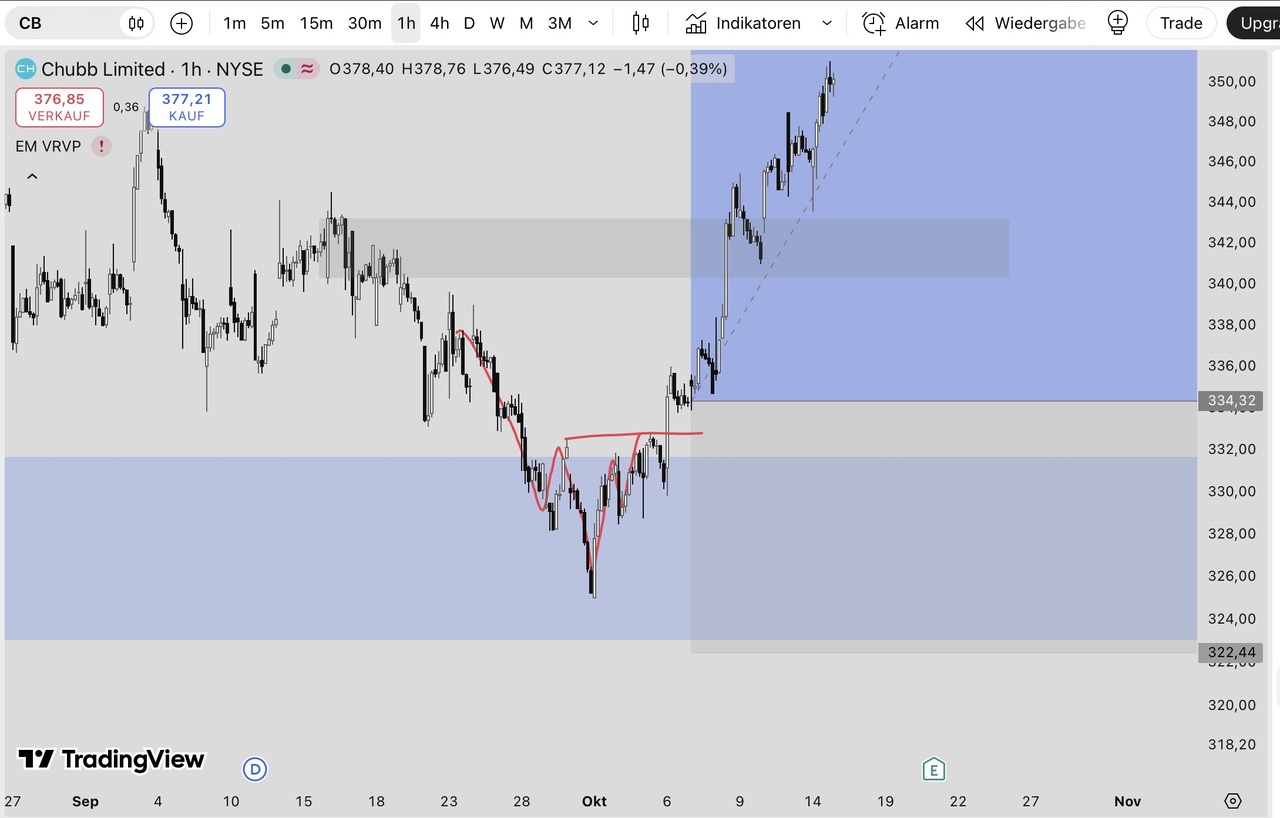
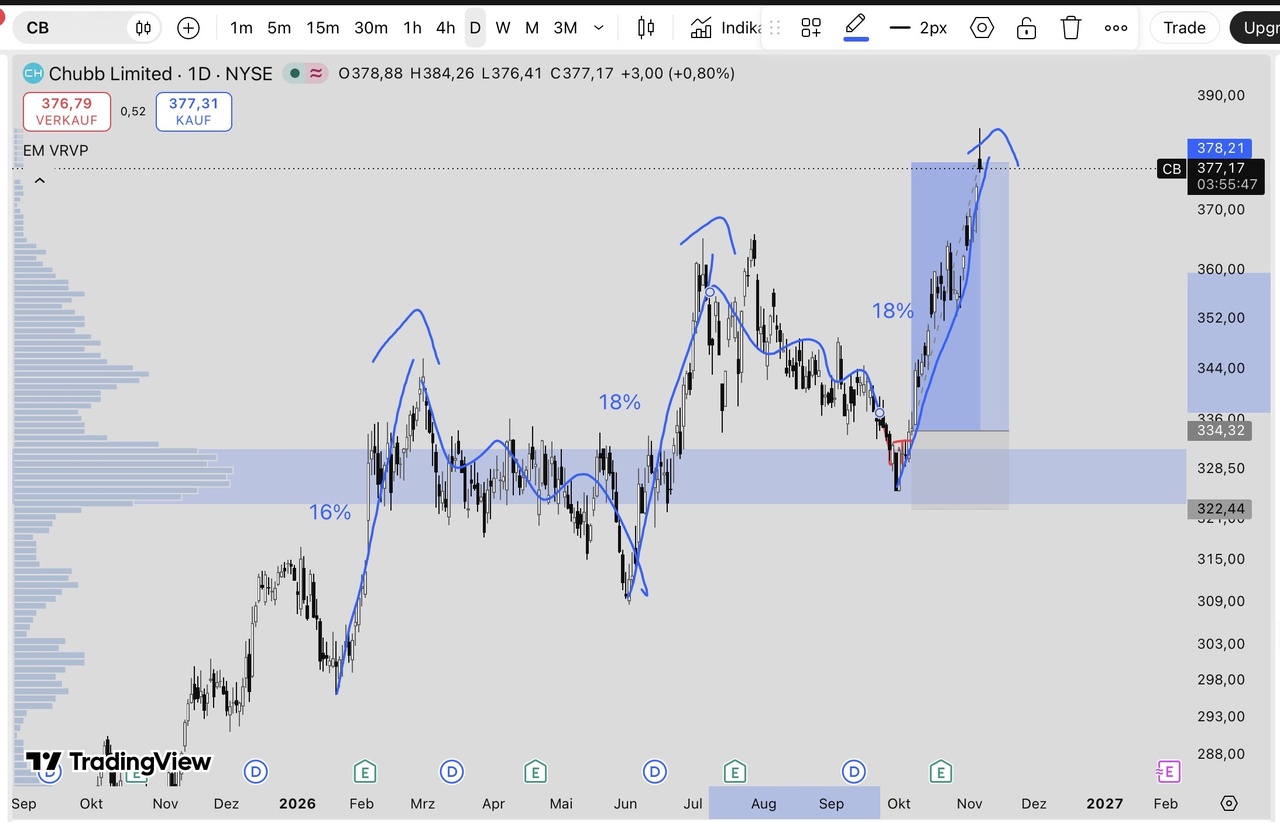
The stock initially moved into our support zone between $320 and $330. There, I took a closer look at the hourly chart and spotted a nice V-shape —a potential turnaround signal right within the support zone.
It was exactly this signal that convinced me. On October 6, I entered a long position there.
Position management:
I sold the first 50% of my position when the price reached the $360 range. By the end of October, the market had started to show signs of weakness, so I decided to take some profits.
I’m now closing out the remaining 50% as well.
What particularly reinforced my confidence in this trade:
My previous observation pattern has been confirmed once again: The stock often rises relatively quickly by about 16–18% and then transitions into a slower correction of approximately 10–12%.
This exact pattern has emerged again this time.
We had:
- A clear support zone at $320–330
- A nice V-shape on the hourly chart
- A recognizable turnaround signal
- A clean entry point
- And then a slow correction following the previous rally
My conclusion: An absolute top-notch trade! These are exactly the kinds of setups I want to trade. The combination of the support zone, chart structure, and clean position management worked perfectly here.
I’d do it exactly the same way again! 🚀
As always, a trade like this can’t be replicated every time. The key is to wait for good setups and have a clear plan.