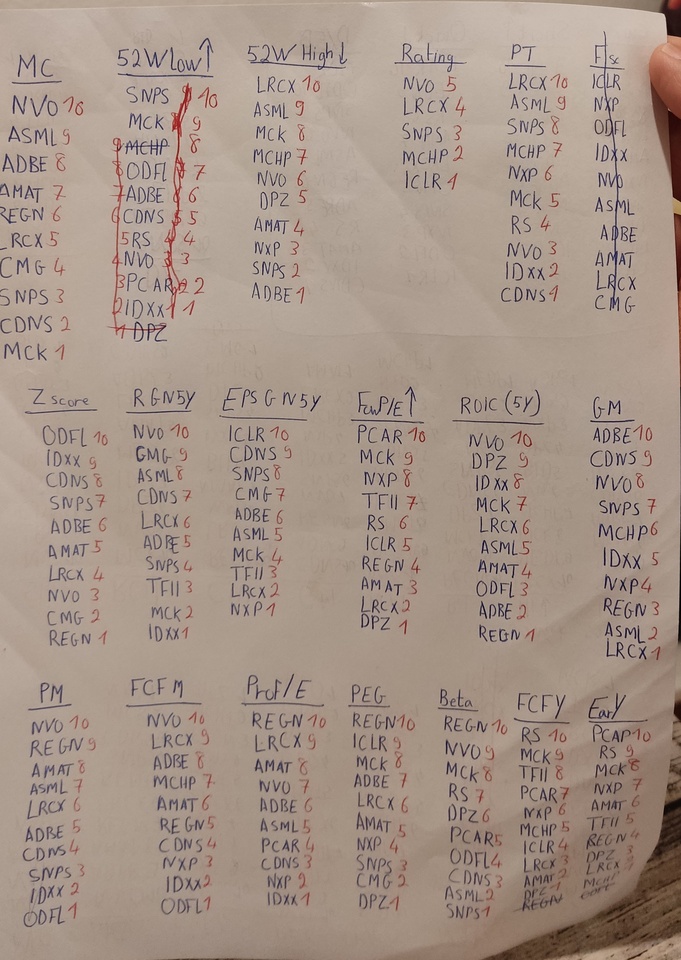
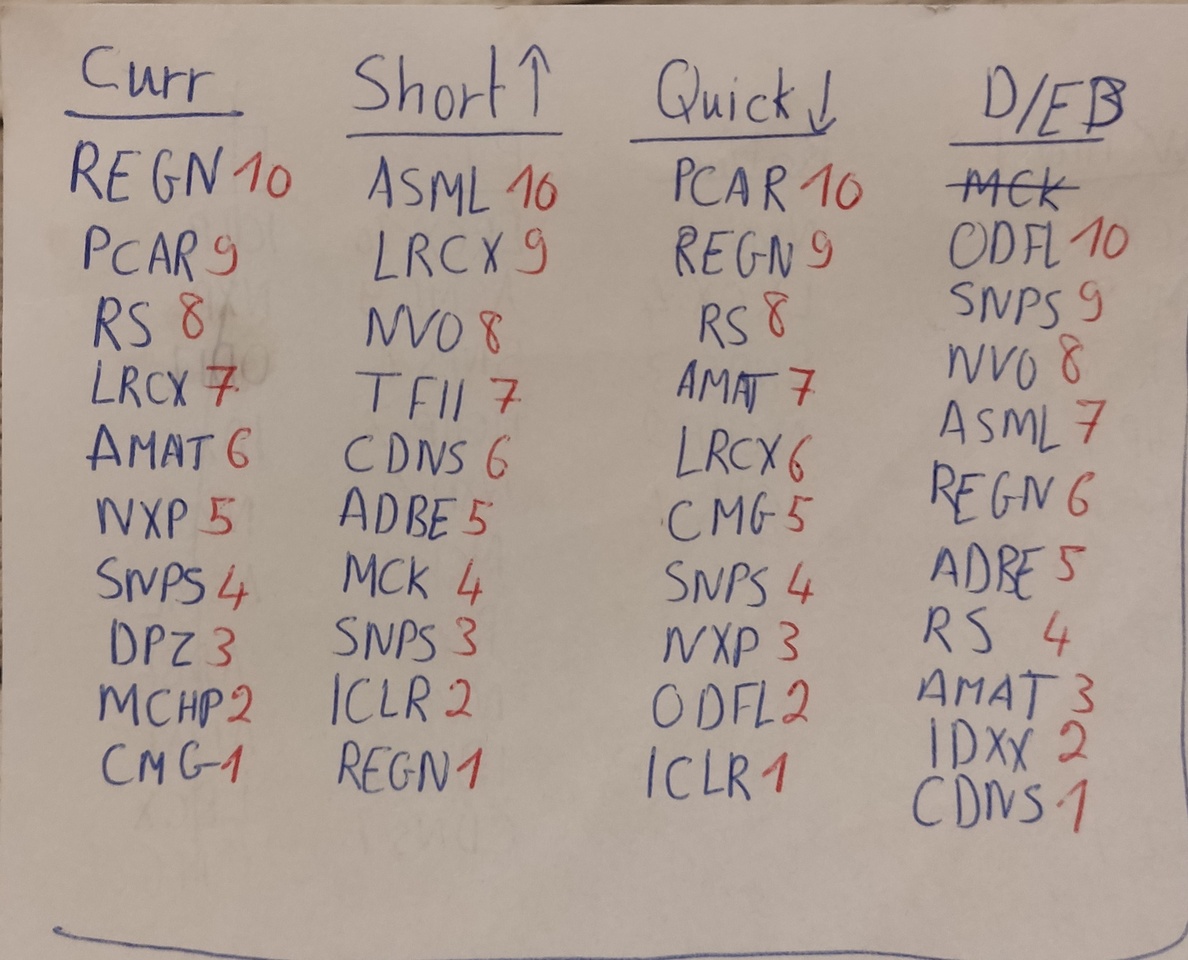
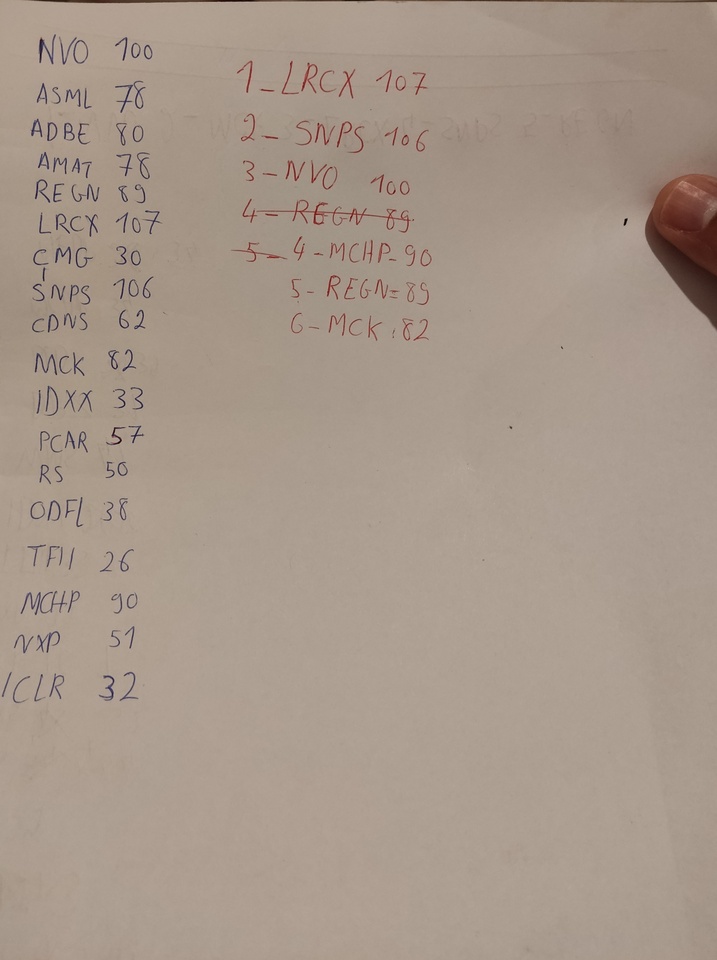
I came up with a crazy idea and I wanted to share my work with you. I decided to organize my watchlist according to different criteria. The best stock gets 10 points and the worst gets 1 point. It is important to mention that this is a snapshot and can change at any time.
The criteria were:
- Market value (the higher the better as with the s&p)
- 52W low difference
- 52W high difference (at least 15 percent 52 w of high)
- Wallstreet rating ( strong buy )
- Price Target Difference
- Z score
- Sales forecast for the next 5 years
- EPS forecast for the next 5 years
- Forward PE ( the lower the better )
- ROIC ( the higher the better)
- Gross profit margin ( the higher the better)
- Net margin ( the higher the better)
-FCF margin ( the higher the better)
- Profit per employee ( the higher the better)
- PEG Ratio ( the lower the better)
- Beta (the lower the better)
- FCF Yield (the higher the better)
- Earning Yield ( the higher the better)
- Current ratio ( the higher the better)
-Short ratio ( the lower the better)
- Quick ratio ( the higher the better)
- Debit / EBITDA (the lower the better)
Place 1- $LRCX
2nd place $SNPS (-0,4%)
3rd place 3- $NOVO B (+2%)
Place 4- $MCHP (-0,56%)
5th place $REGN (+0,32%)
Place 6- $MCK (-0,02%)
ATTENTION: many industries cannot be compared directly, which is why, for example, gastronomy providers perform relatively poorly in such a test or the transportation sector such as ODFL. Here you can only compare shares from the same sector.
I would be very interested to know what you think of my approach? What can be done better here to achieve even more accurate results? Which criteria would you use and which not?
I am very curious about your feedback.
Thank you very much in advance 😘


